I. The 2016 Presidential Candidates
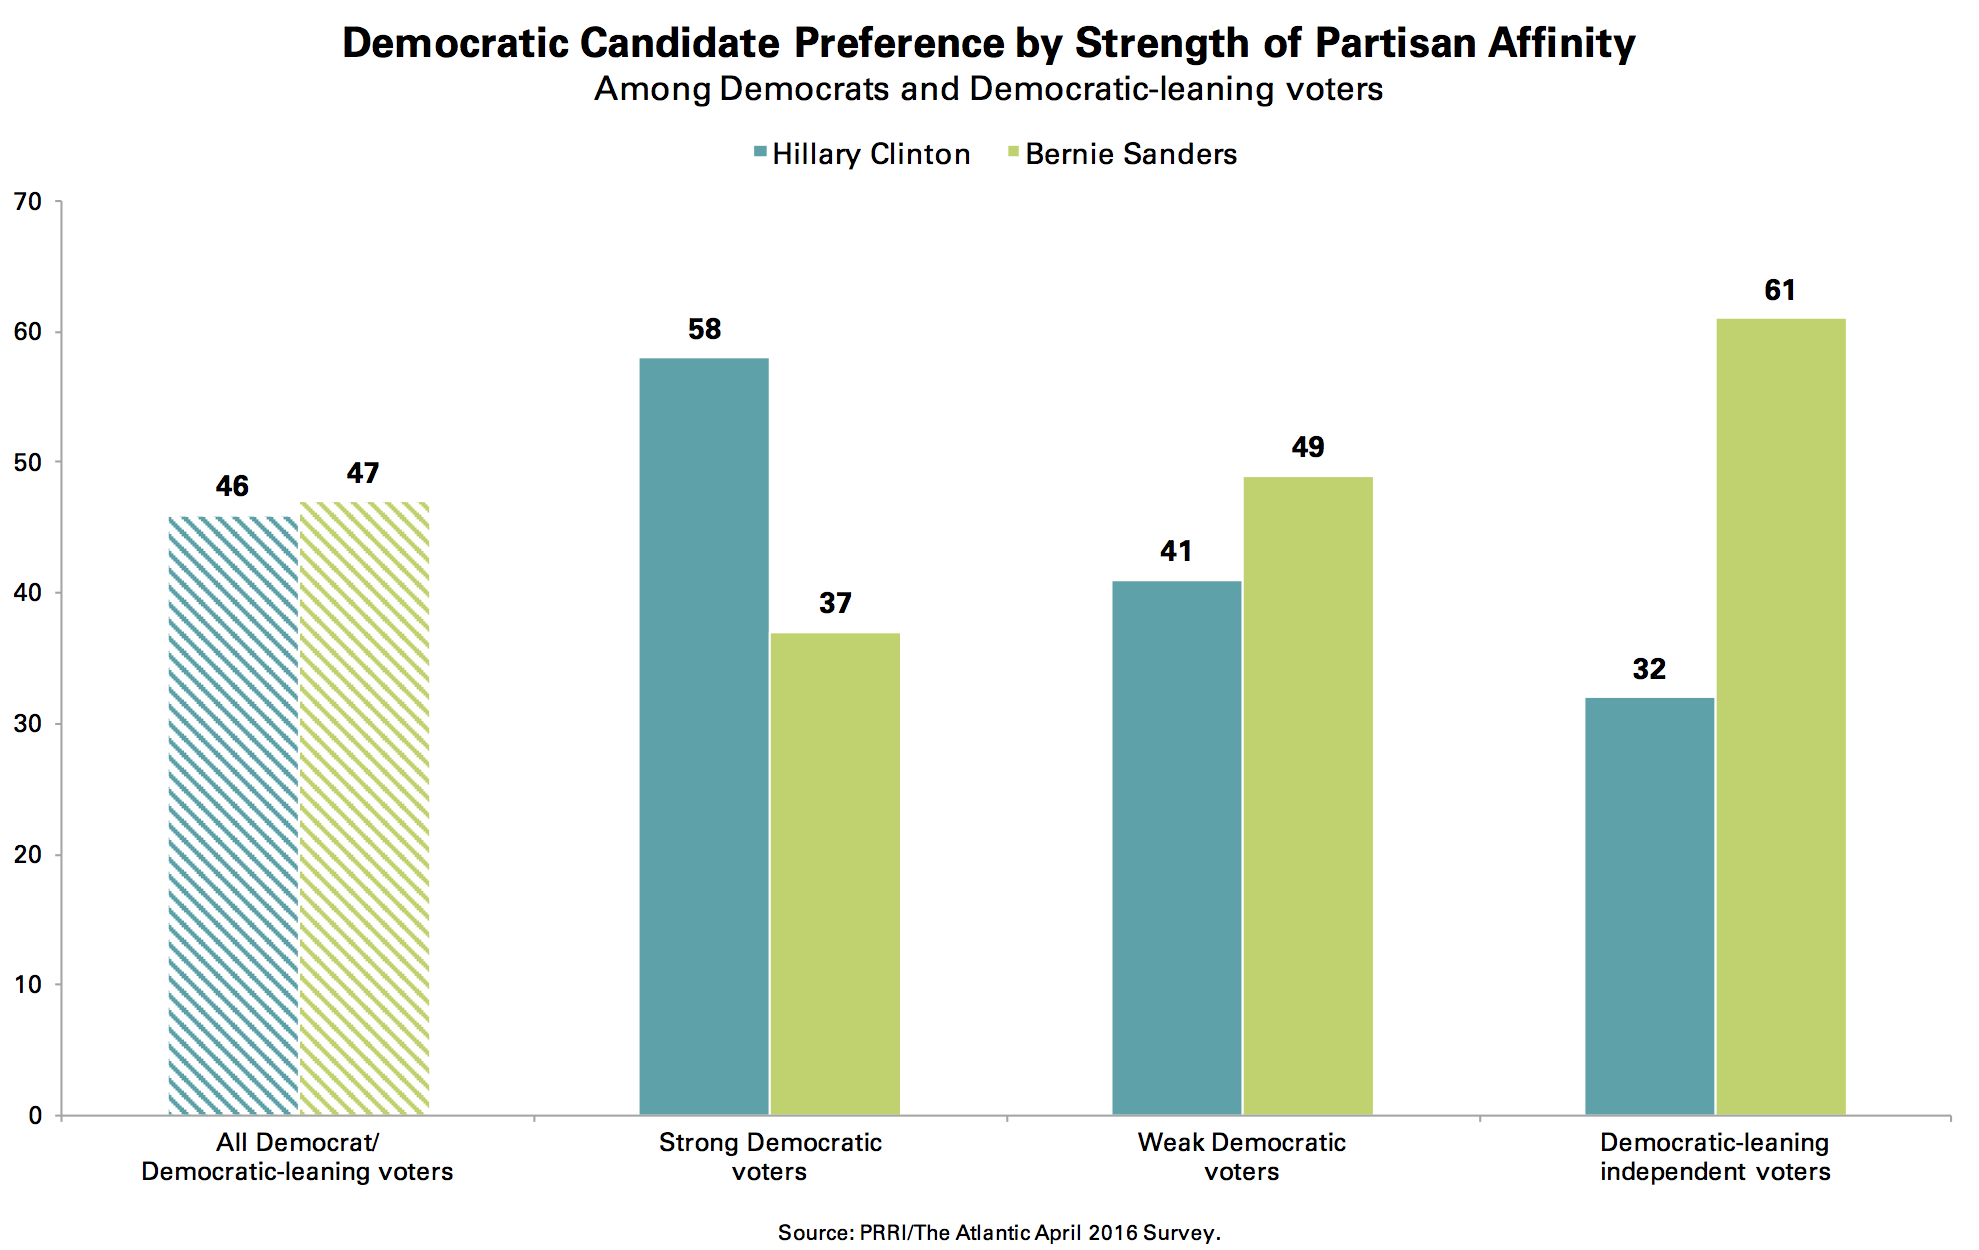
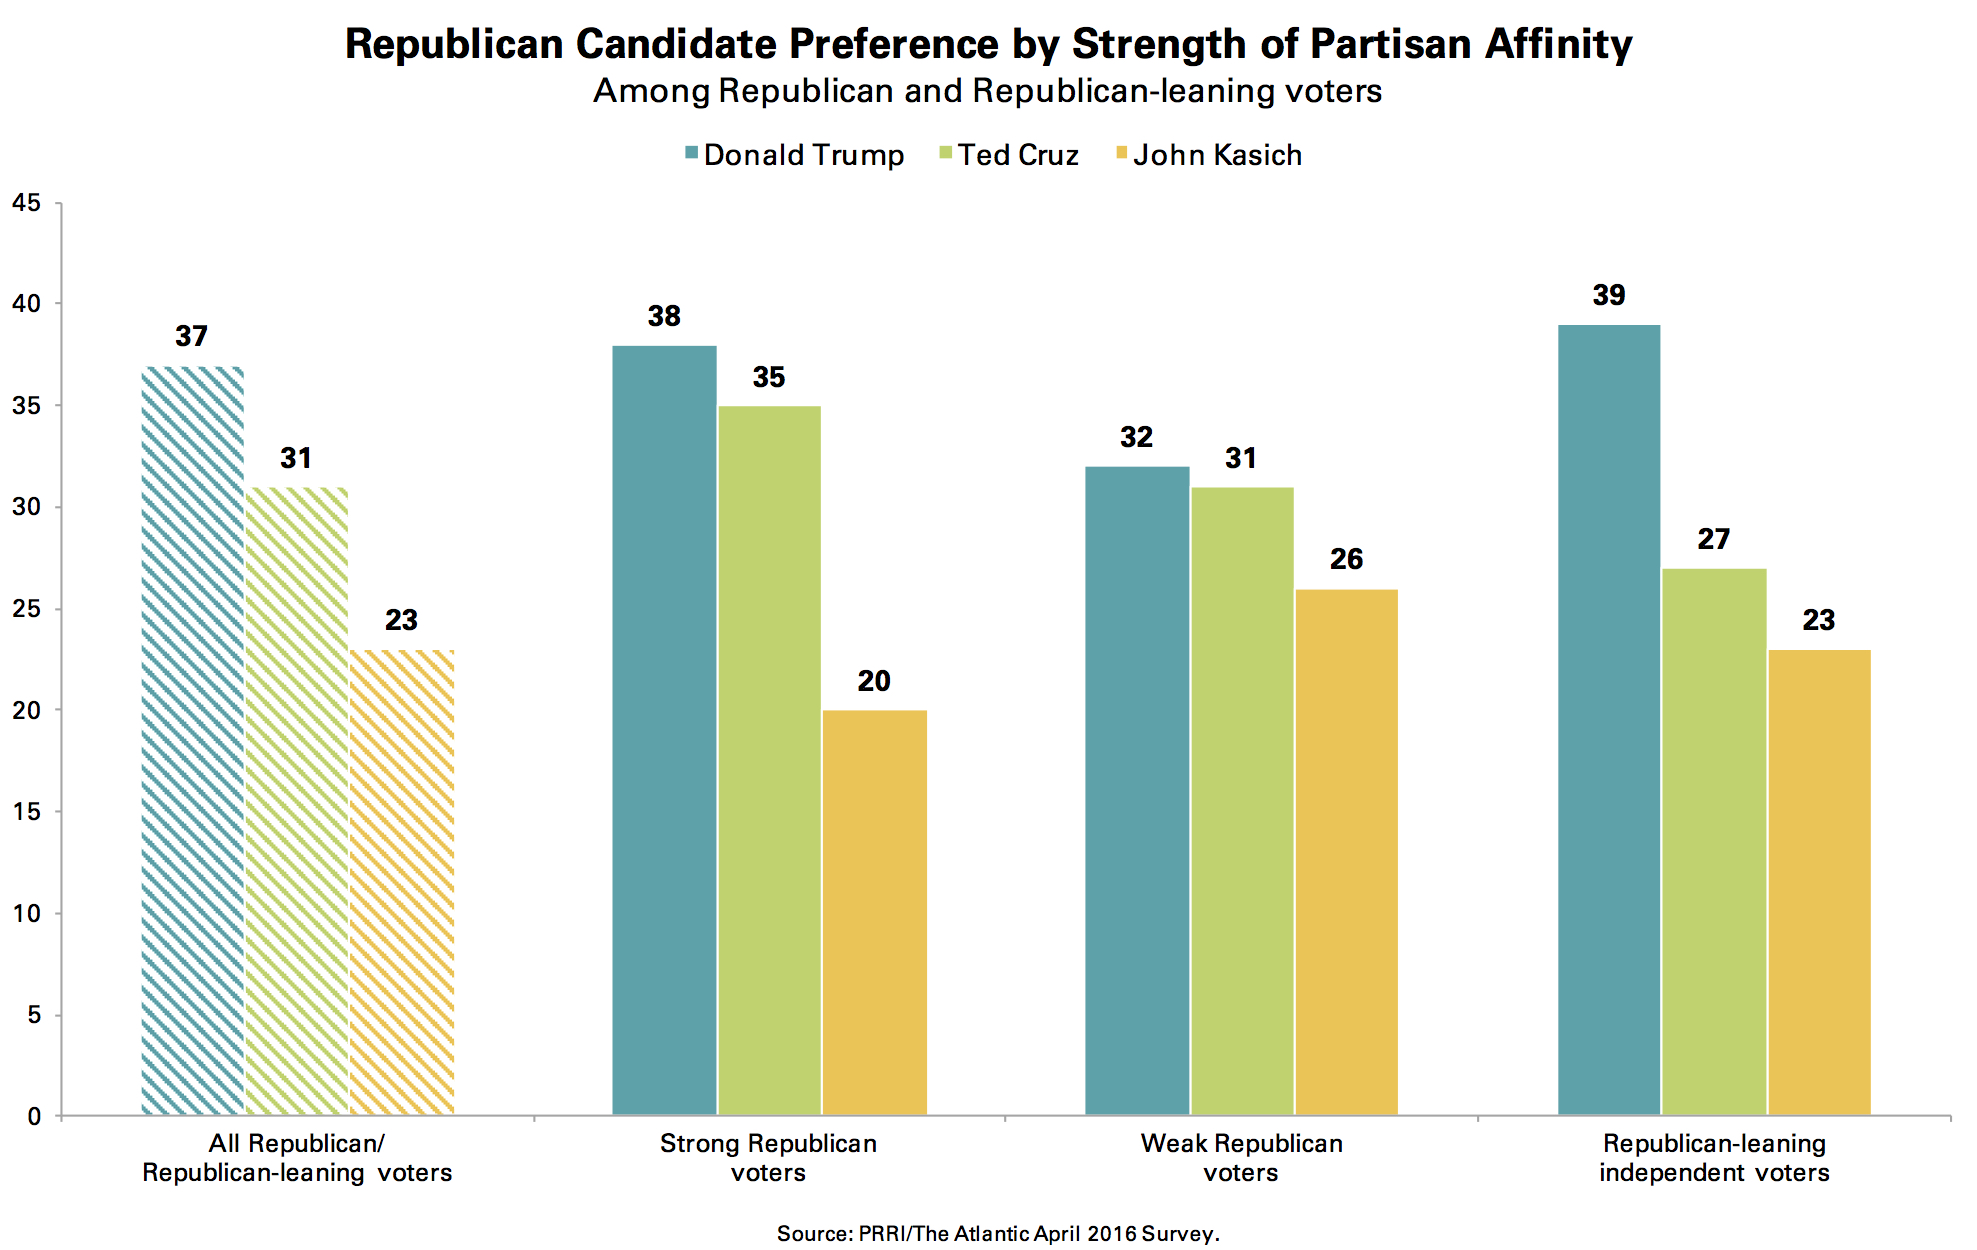
Nationwide, Hillary Clinton is roughly tied with Bernie Sanders (46% vs. 47%, respectively) among Democratic and Democratic-leaning voters. Among Republican and Republican-leaning voters, Donald Trump (37%) leads Ted Cruz (31%) and John Kasich (23%).
Candidate Preferences
The Democratic Contest: Clinton vs. Sanders
Although Clinton and Sanders are running even among all Democratic and Democratic-leaning voters, among strong Democratic voters, Clinton leads Sanders by a considerable margin (58% vs. 37%, respectively). In contrast, roughly half (49%) of weak Democratic voters support Sanders compared to 41% who are supporting Clinton. Sanders holds a significant advantage over and Democratic-leaning independent voters (61% vs. 32%, respectively).
There are wide generational disparities in candidate preferences among Democratic voters. Nearly three-quarters (73%) of young voters (age 18 to 29) and a majority (54%) of voters between the ages of 30 and 49 prefer Sanders. In contrast, strong majorities of Democratic voters between the ages of 50 and 64 (58%) and seniors, age 65 and older, (67%) support Clinton.
Notably, Democratic women voters overall are nearly evenly divided, with 46% supporting Clinton and 44% supporting Sanders. However, there are notable differences between the preferences of older and younger women. Female voters under the age of 50 prefer Sanders to Clinton by a nearly two to one margin (58% vs. 33%, respectively), while female voters over the age of 50 prefer Clinton to Sanders by similar margins (61% vs. 29%, respectively).
White Democratic voters are somewhat more likely to favor Sanders than Clinton (51% vs. 42%, respectively), but black Democratic voters prefer Clinton over Sanders by more than 30 percentage points (63% vs. 30%, respectively). Hispanic Democratic voters are roughly divided (47% Clinton vs. 48% Sanders).
These racial disparities in voting preferences result in very different racial profiles of the Sanders and Clinton voting coalitions. Approximately two-thirds (65%) of Sanders voters are white, non-Hispanic, compared to 53% of Clinton voters. Clinton voters are more than twice as likely as Sanders voters to be black (28% vs. 13%, respectively), while Hispanics are represented equally among each candidate’s voting coalition (12% vs. 12%, respectively).
 The religious voting coalitions of Clinton and Sanders also reflect these racial disparities. Clinton voters are divided roughly evenly between white Protestants—including white evangelical Protestants (7%) and white mainline Protestants (15%)—black Protestants (22%), Catholics (20%), and the religiously unaffiliated (18%). In contrast, roughly four in ten (38%) Sanders voters are religiously unaffiliated, representing the largest single group in his coalition. About one in five Sanders voters are either white evangelical Protestant (11%) or white mainline Protestant (10%). Sixteen percent of Sanders voters identify as Catholic, while only six percent are black Protestant.
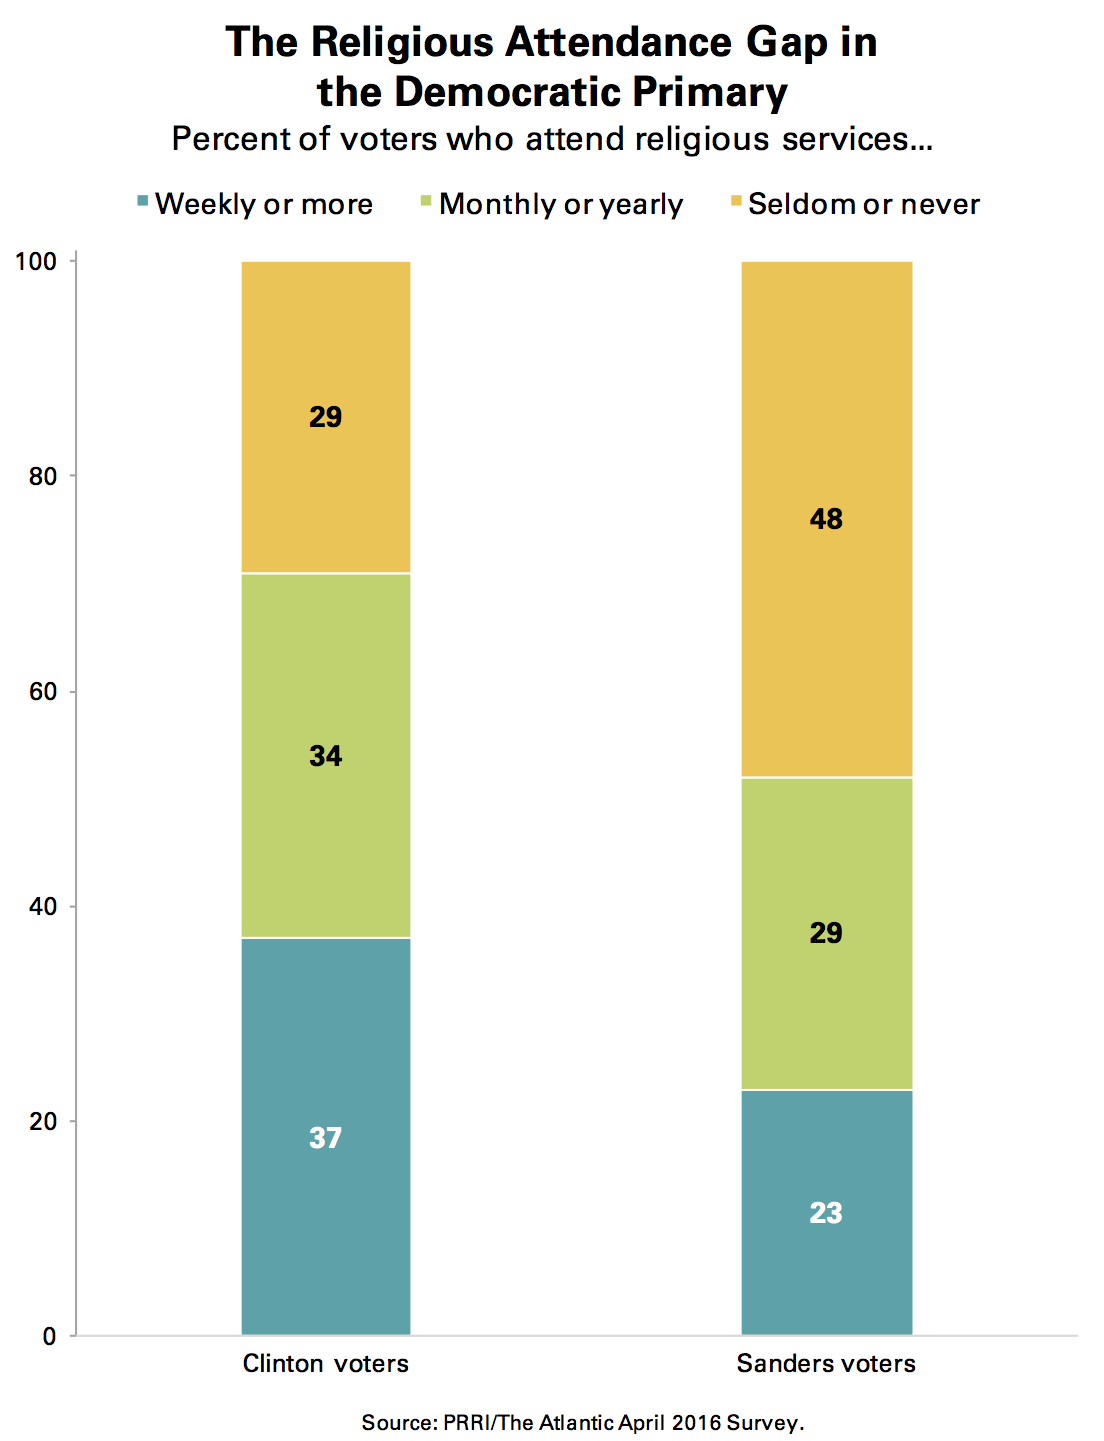
Sanders voters are more likely than Clinton voters to report low levels of religious attendance. Nearly half (48%) of Sanders voters say they seldom or never attend religious services, compared to fewer than one-third (29%) of Clinton voters. However, Sanders voters are not any more likely than Clinton voters to report low levels of participation in secular groups in their community. Thirty-nine percent of Clinton voters—compared to 33% of Sanders voters—report that they seldom or never participate in non-religious community activities such as sports teams, book clubs, PTA, or neighborhood association meetings.
The Republican Contest: Trump, Cruz, and Kasich
While Trump holds a solid lead among all Republican and Republican-leaning voters, the race tightens up among strong Republican voters. Similar numbers of strong Republican voters prefer Trump (38%) and Cruz (35%), while one in five (20%) express a preference for Kasich. The Republican candidates are roughly tied among weak Republican voters (32% Trump, 31% Cruz, 26% Kasich). However, Trump holds a sizable advantage among independent voters who lean Republican. Nearly four in ten (39%) Republican-leaning independent voters want Trump to be the nominee, compared to 27% who are backing Cruz and 23% who prefer Kasich.
The candidate preferences of Republican and Republican-leaning voters differ modestly by religious affiliation. White evangelical Protestant voters are evenly divided between Trump (37%) and Cruz (37%), while fewer than one in five (19%) say they want Kasich to be the nominee. Among white evangelical Protestant voters who report attending religious services at least once a week 39% are supporting Cruz while 33% support Trump.
Trump holds a strong advantage among Republican and Republican-leaning voters who are less civically engaged. Republican voters who report that they seldom or never participate in community activities—such as a sports team, book club, PTA, or neighborhood association—are twice as likely to support Trump than Cruz (50% vs. 24%, respectively). In fact, more than half (52%) of Trump voters, compared to 29% of Cruz voters and 27% of Kasich voters, say that they seldom or never participate in these types of local community activities.
Perceptions of the Candidates
Favorability of the Democratic Candidates
Among the general public, Hillary Clinton is viewed more negatively than Bernie Sanders. A majority (54%) of Americans have an unfavorable view of Hillary Clinton, compared to only four in ten (40%) who have a favorable impression of her. By contrast, nearly half (47%) of the public have a favorable view of Sanders, compared to 41% who have an unfavorable view.
Compared to October 2015, Clinton’s favorability has slipped six percentage points, down from 46%, while Sanders’ favorability has jumped 10 percentage points, up from 37%. However, this disparity is partially due to the fact that approximately one-quarter (26%) of Americans reported they were unfamiliar with Sanders last fall.
Neither candidate, however, has a favorability advantage among self-identified Democrats. Roughly seven in ten Democrats report a favorable view of Clinton (72%) and Sanders (68%), although Clinton is viewed more positively than Sanders among strong Democrats (80% vs. 70%, respectively). In contrast, Clinton is viewed more negatively by Republicans: 87% of Republicans have an unfavorable view of her, including two-thirds (66%) who report a very unfavorable view. About seven in ten (71%) Republicans view Sanders negatively.
A majority (53%) of Clinton supporters view Sanders in favorable light, while less than half (43%) of Sanders supporters say the same of Clinton.1 A majority (54%) of Sanders supporters view Clinton negatively.
Public views of Clinton vary substantially by race and ethnicity, while this is less true for Sanders. Fewer than one-third (31%) of white Americans view Clinton favorably, compared to six in ten (61%) Hispanic Americans and roughly three-quarters (76%) of black Americans. In contrast, Sanders is viewed favorably by 43% of whites, 54% of Hispanics, and 54% of blacks.
Favorability of the Republican Candidates
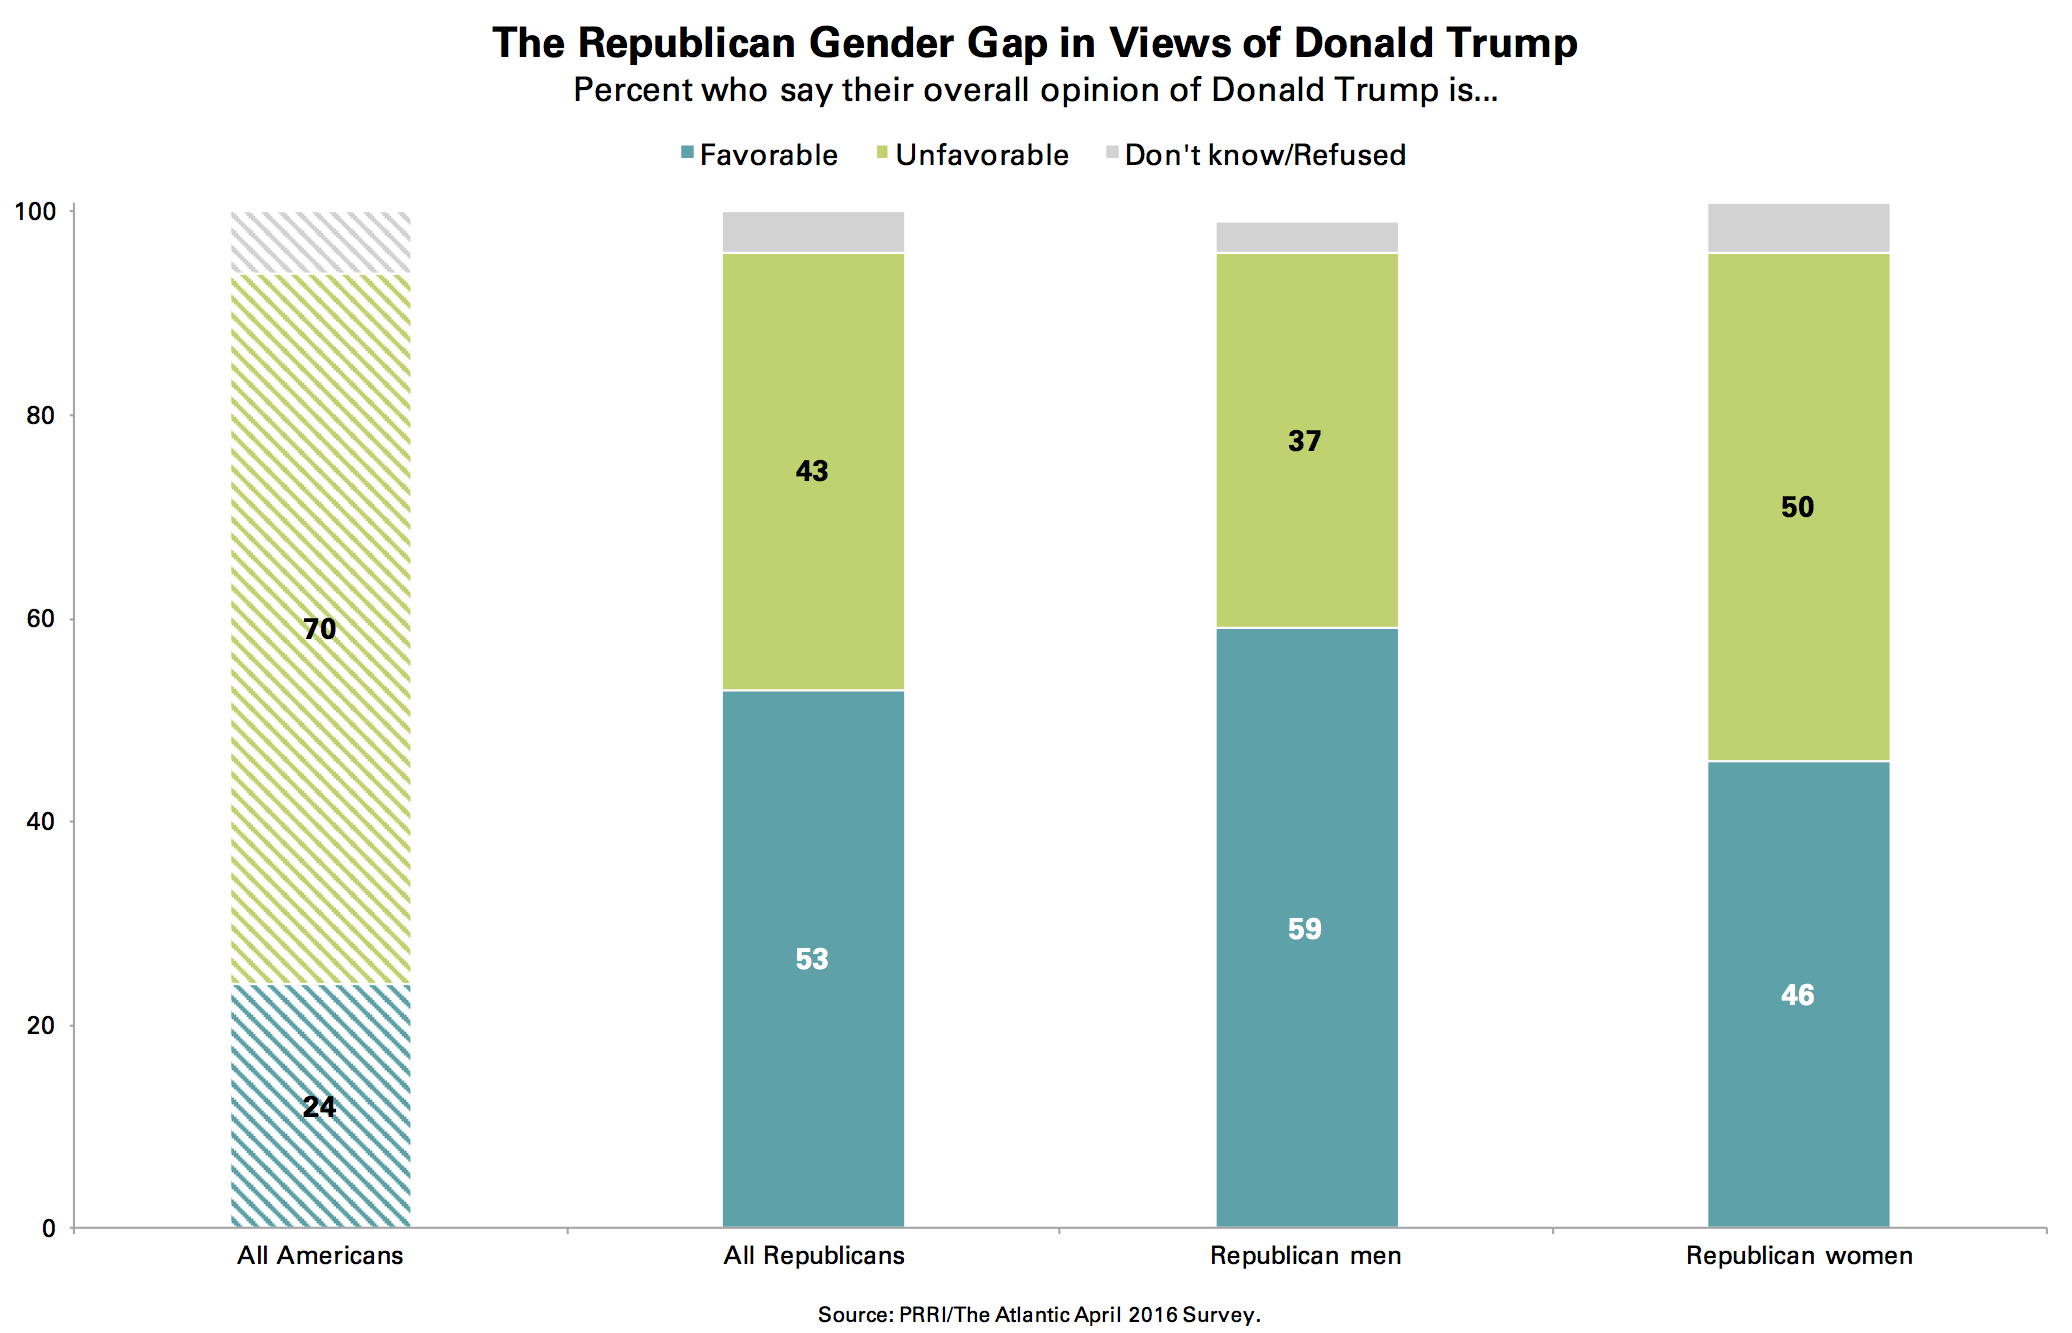
Seven in ten Americans (70%) have an unfavorable opinion of Trump, including more than half (52%) who have a very unfavorable impression of him. Only about one-quarter (24%) of the public view Trump favorably. Nearly six in ten (57%) Americans view Cruz unfavorably, compared to nearly three in ten (29%) who report a positive view of him.
Compared to Clinton and Sanders, neither Cruz nor Trump enjoy widespread admiration among their respective partisans. A majority (53%) of Republicans have a favorable view of Trump, while similar numbers of Republicans (55%) report viewing Cruz favorably. Roughly four in ten Republicans view Trump and Cruz unfavorably (43% vs. 39%, respectively). Trump is viewed somewhat more negatively by Democrats than Cruz (88% vs. 73%, respectively).
Three-quarters (75%) of women, compared to 65% of men, have a negative view of Trump. While roughly six in ten (59%) Republican men have a positive view of Trump, fewer than half (46%) of Republican women do. Half (50%) of all Republican women hold unfavorable views of Trump.
 Trump is viewed particularly negatively among non-white Americans. Nearly nine in ten (87%) black Americans have a negative view of Trump, including 71% who hold a very negative view. Similarly, 83% of Hispanic Americans view Trump unfavorably, including 66% who say they have a very unfavorable view. Roughly two-thirds (64%) of white Americans also report a negative view of him. Cruz, in contrast, is viewed roughly the same among white and black Americans. About six in ten white Americans (58%), and similar numbers of black Americans (62%), view Cruz unfavorably. Fewer Hispanics (51%) report a negative opinion of Cruz.
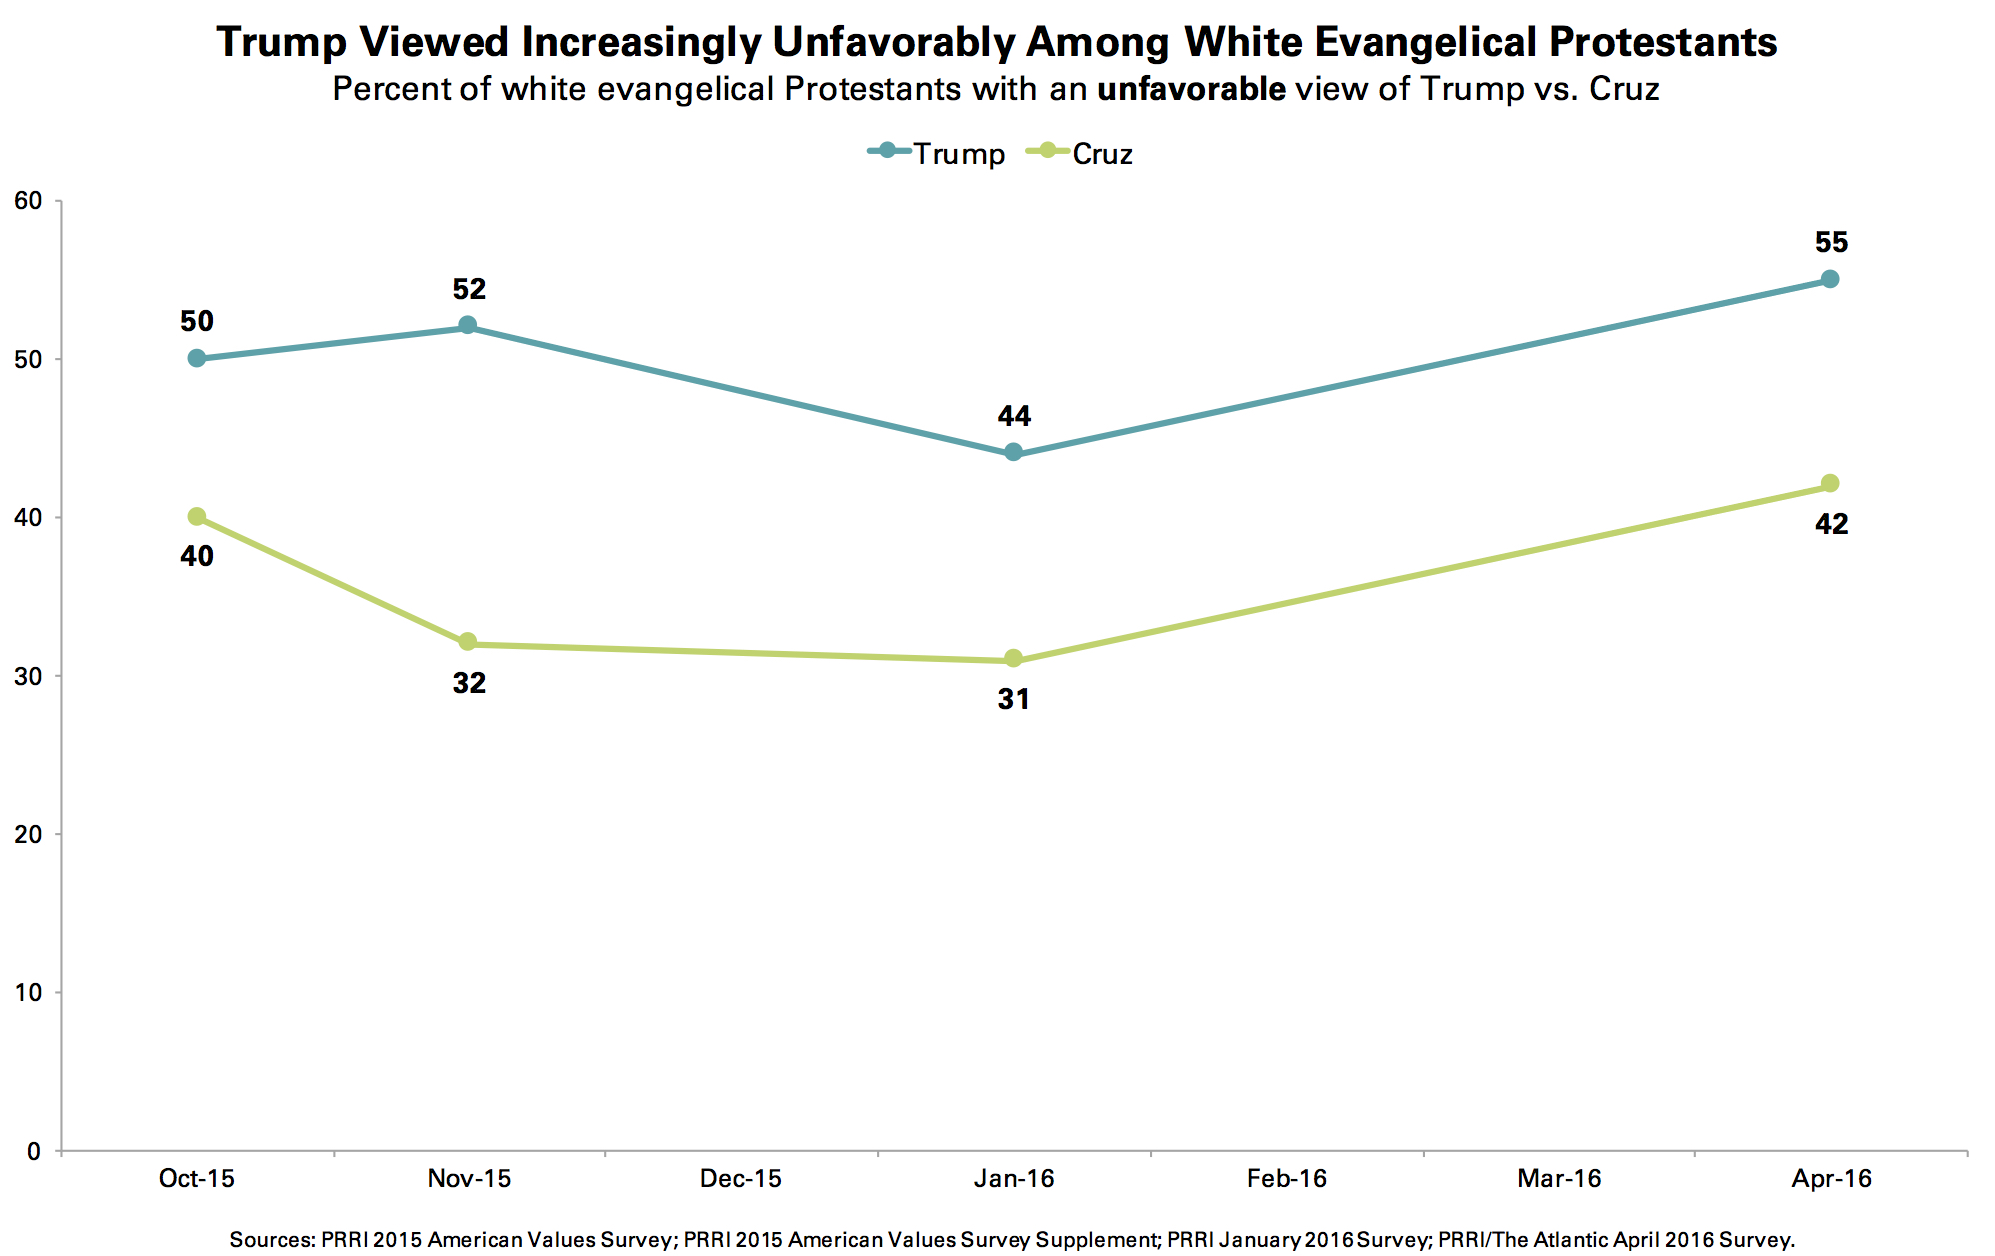
Since the beginning of the year, both Trump’s and Cruz’s stock among white evangelical Protestants has experienced a decline. In January 2016, 44% of white evangelical Protestants held an unfavorable view of Trump. Today, however, a majority (55%) of white evangelical Protestants report holding an unfavorable opinion of Trump, while 40% have a favorable view of him. Cruz’s unfavorable rating among white evangelical Protestants was 31% in January 2016. Today, however, 42% of white evangelical Protestants report holding a negative opinion about Cruz, while nearly half (49%) view him positively.
Neither Trump nor Cruz supporters feel warmly toward the opposing candidate. Roughly two-thirds (66%) of Trump supporters have a negative view of Cruz, while roughly as many Cruz supporters (63%) report an unfavorable opinion of Trump. Among Kasich supporters, 73% hold unfavorable views of Trump and 52% hold unfavorable views of Cruz.
Does the Country Need a Political Leader Willing to Break Some Rules?
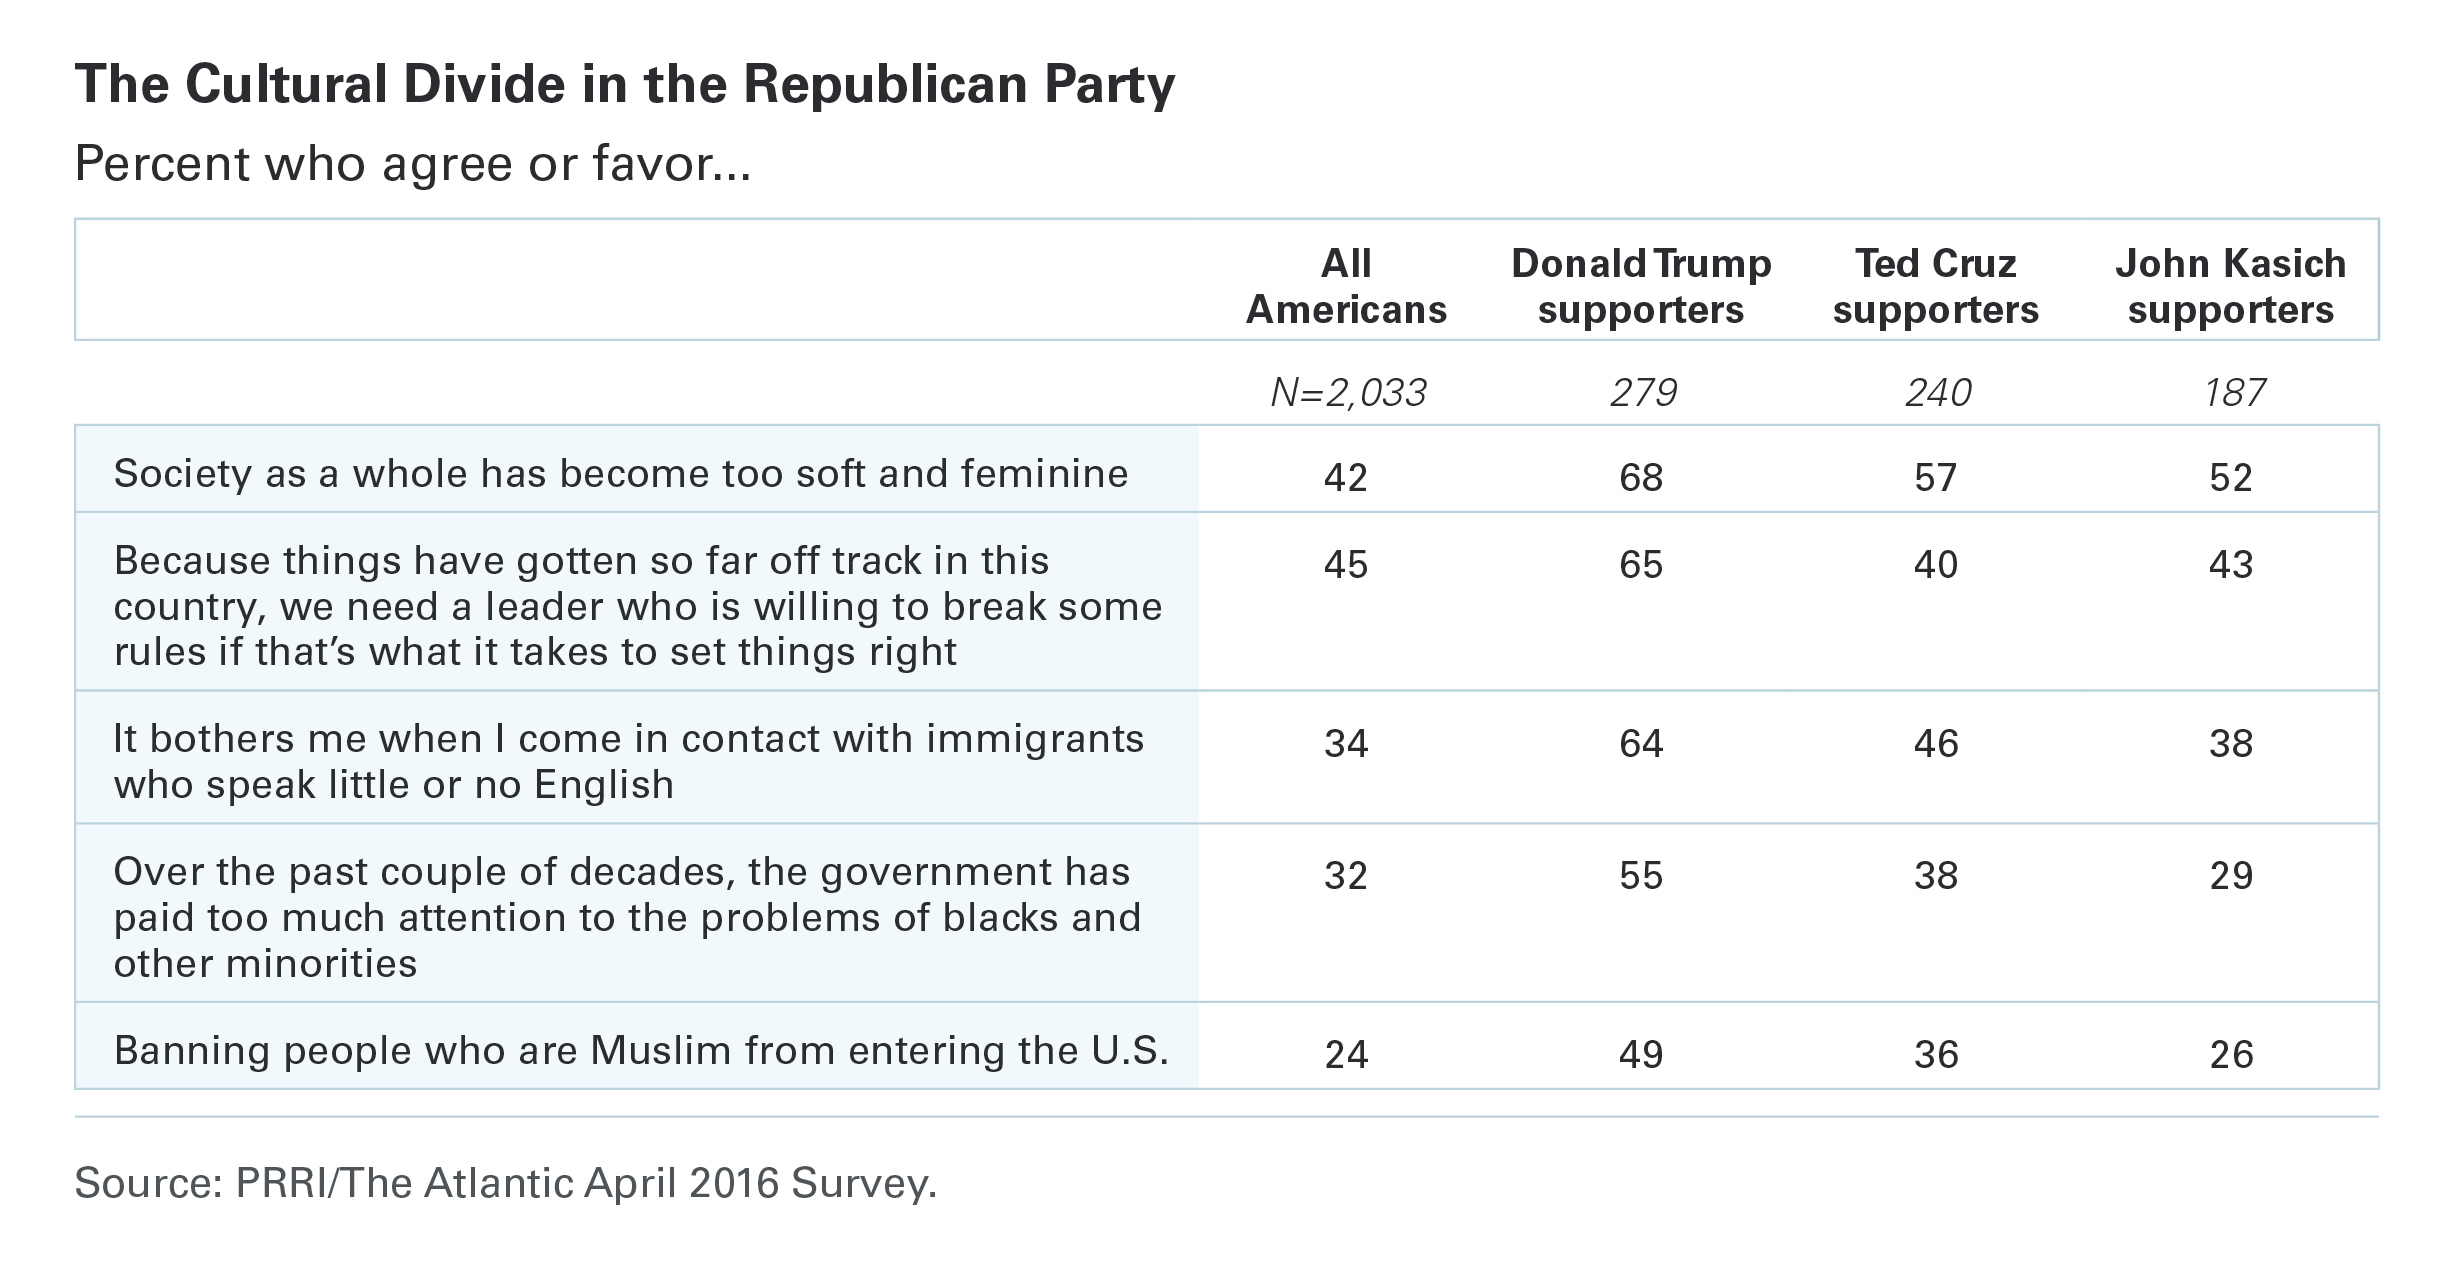
Close to half (45%) of Americans agree that because things in the country have gone so far off track, the U.S. needs a leader willing to break some rules to set things right. A slim majority (51%) disagree with this statement.
There are modest partisan divisions in views about whether America needs a leader ready to break the rules. Approximately half (49%) of Republicans agree with this statement, compared to 41% of Democrats. Political independents do not differ appreciably from Americans overall.
Americans in financial distress are more likely to approve of a leader who is willing to break the rules to set things right. A majority (55%) of Americans who report being in poor financial shape, compared to only 37% of Americans in excellent financial shape, agree that the U.S. needs this type of leader.
While there are no significant differences in views by race or ethnicity, among whites there is considerable variation of opinion by level of educational attainment. A majority (53%) of whites with no college education agree that the country needs a leader who is willing to break some rules to set things right. Fewer than one-third (32%) of whites with a college degree affirm this belief.
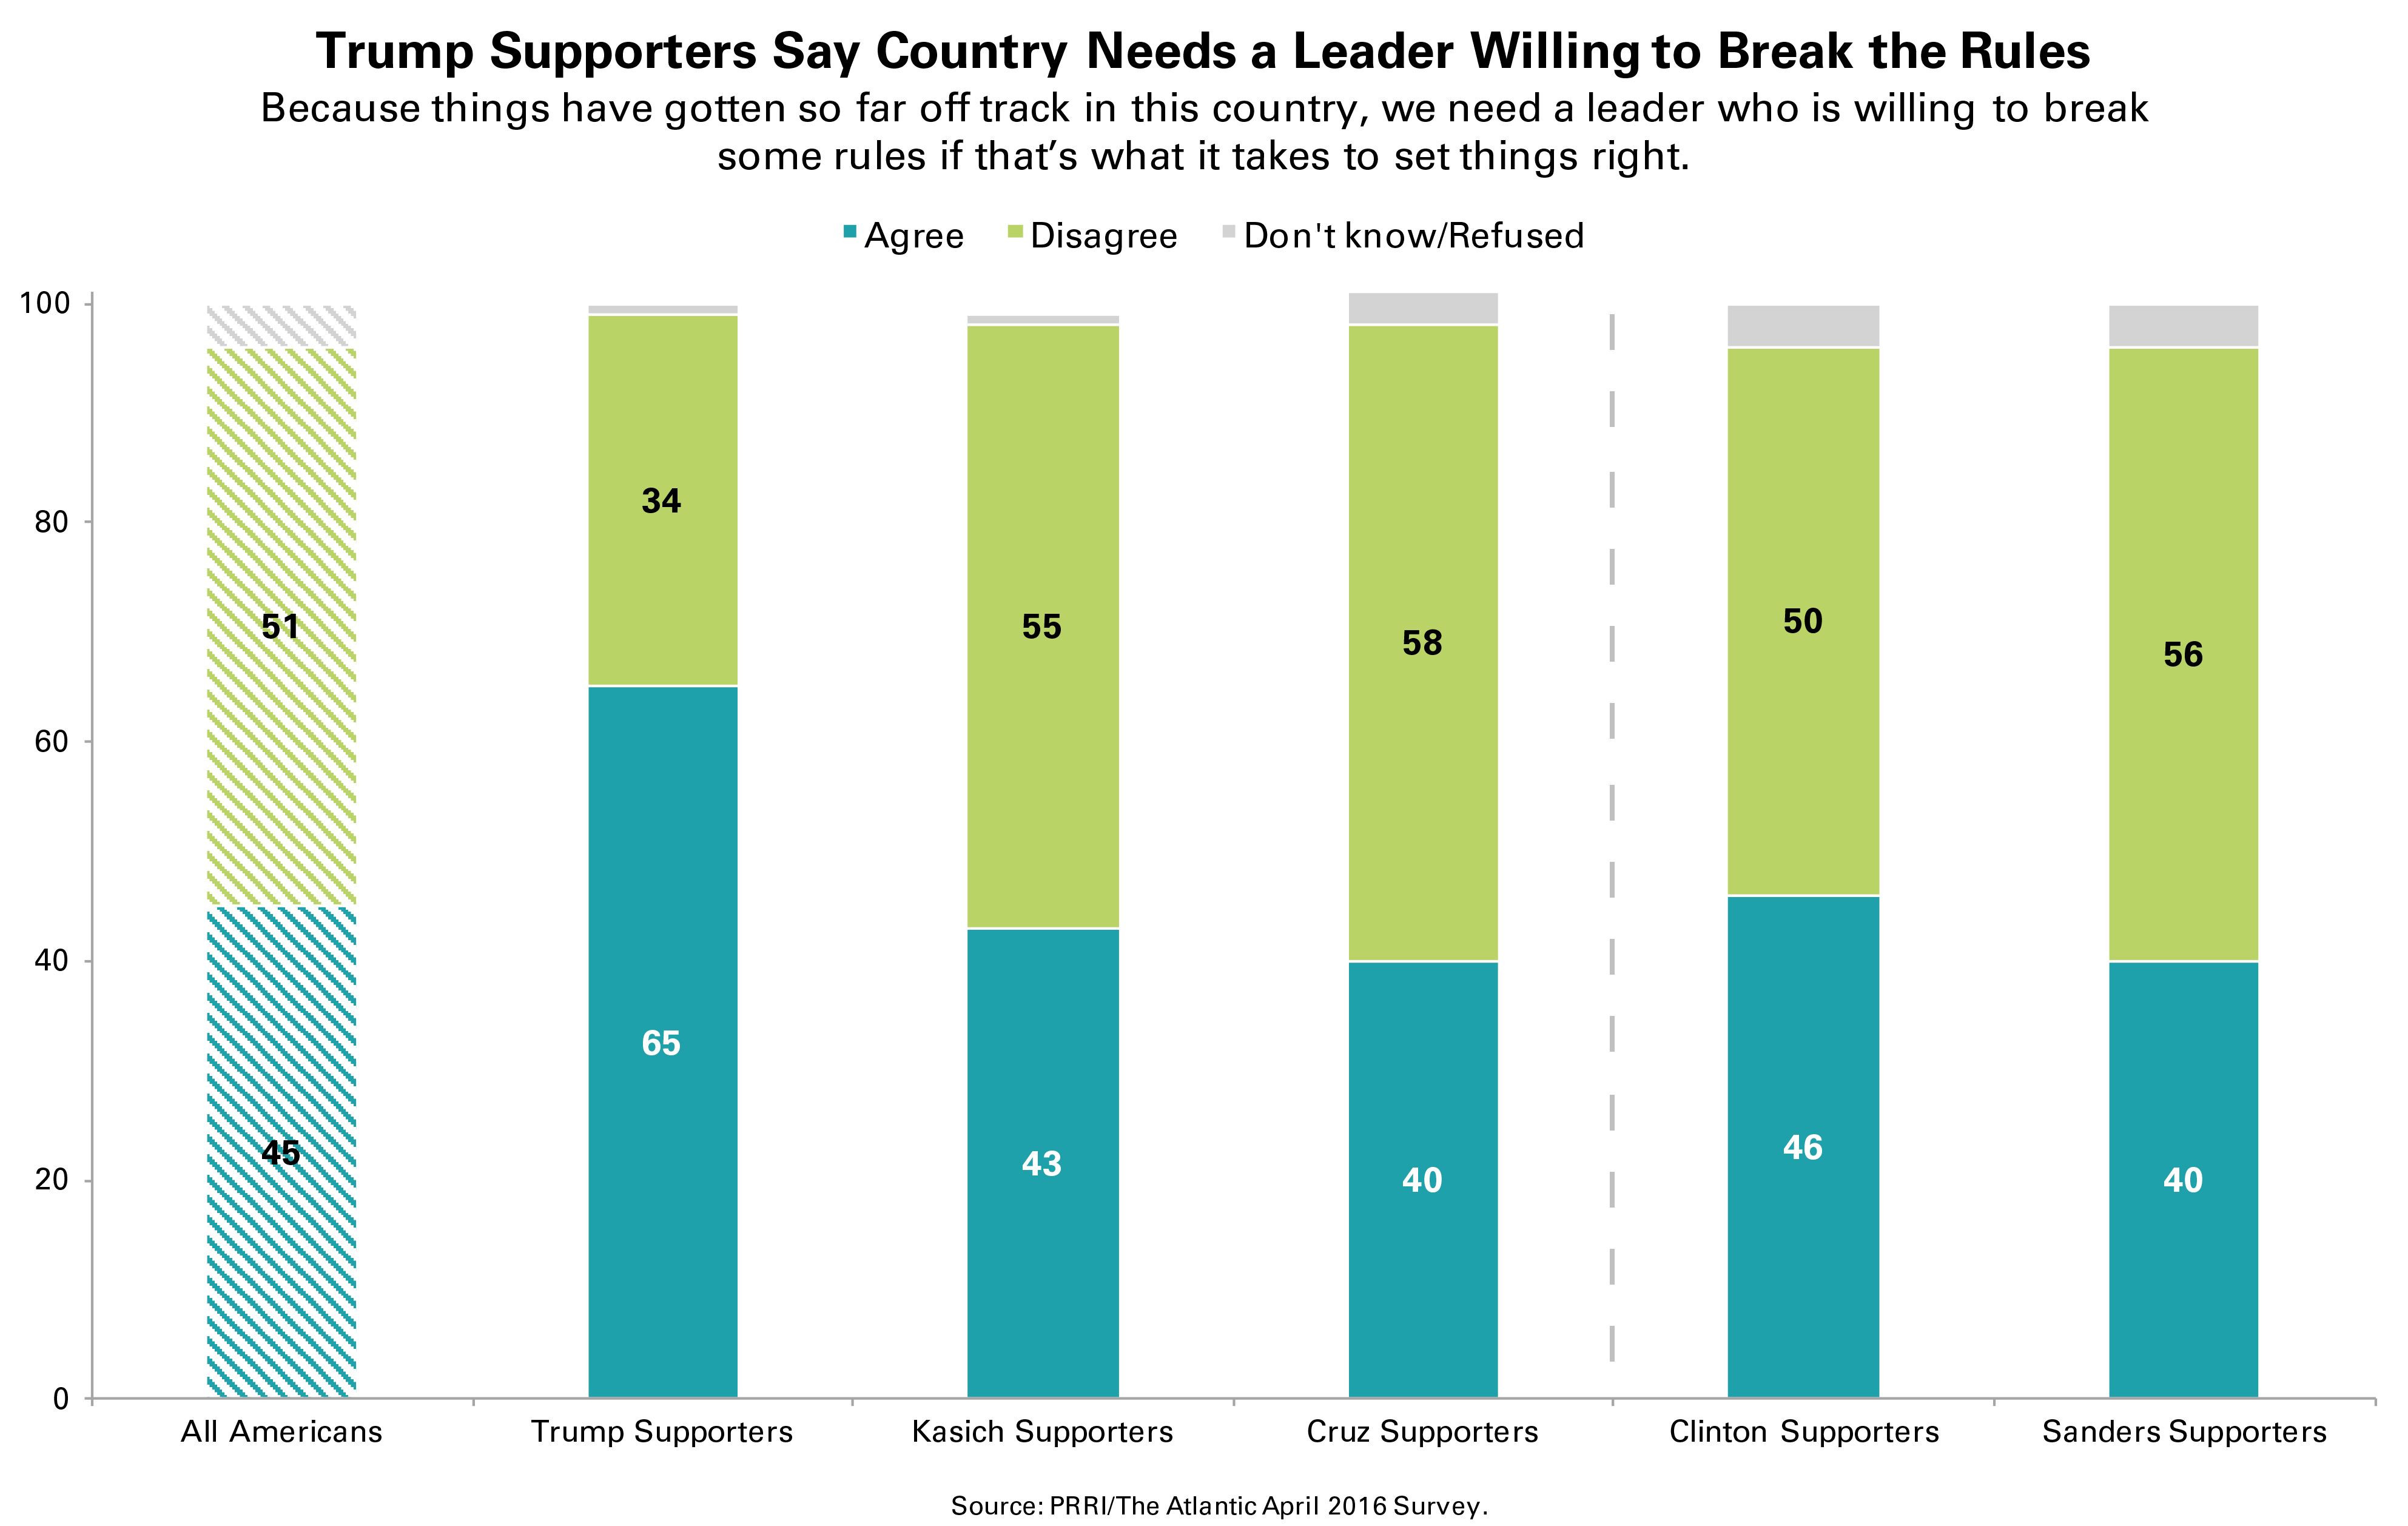 There are dramatic differences in views between Trump supporters and nearly everyone else. Roughly two-thirds (65%) of Trump supporters agree that America needs a leader who is willing to break the rules, while fewer than half of Cruz supporters (40%), Kasich supporters (43%), Clinton supporters (46%), and Sanders supporters (40%) agree.
II. Gender Attitudes in America
Is Society Becoming Too Soft and Feminine?
Approximately four in ten (42%) Americans agree that society as a whole has become too soft and feminine, while a slim majority (53%) disagree.
Perhaps unsurprisingly, there is a stark gender divide in attitudes about whether society is becoming too feminine. Six in ten (60%) women say society has not become too soft and feminine overall, compared to 46% of men. Half (50%) of men agree that society has become too feminine.
Two-thirds (67%) of Democrats disagree that society is now too soft and feminine, compared to fewer than four in ten (37%) Republicans. Six in ten (60%) Republicans say society as a whole has become too soft and feminine.
Among religious groups, white evangelical Protestants stand out as the only one in which a majority (53%) agree that society has become too soft and feminine. These views contrast sharply with those of religiously unaffiliated Americans (30% agree, 66% disagree).
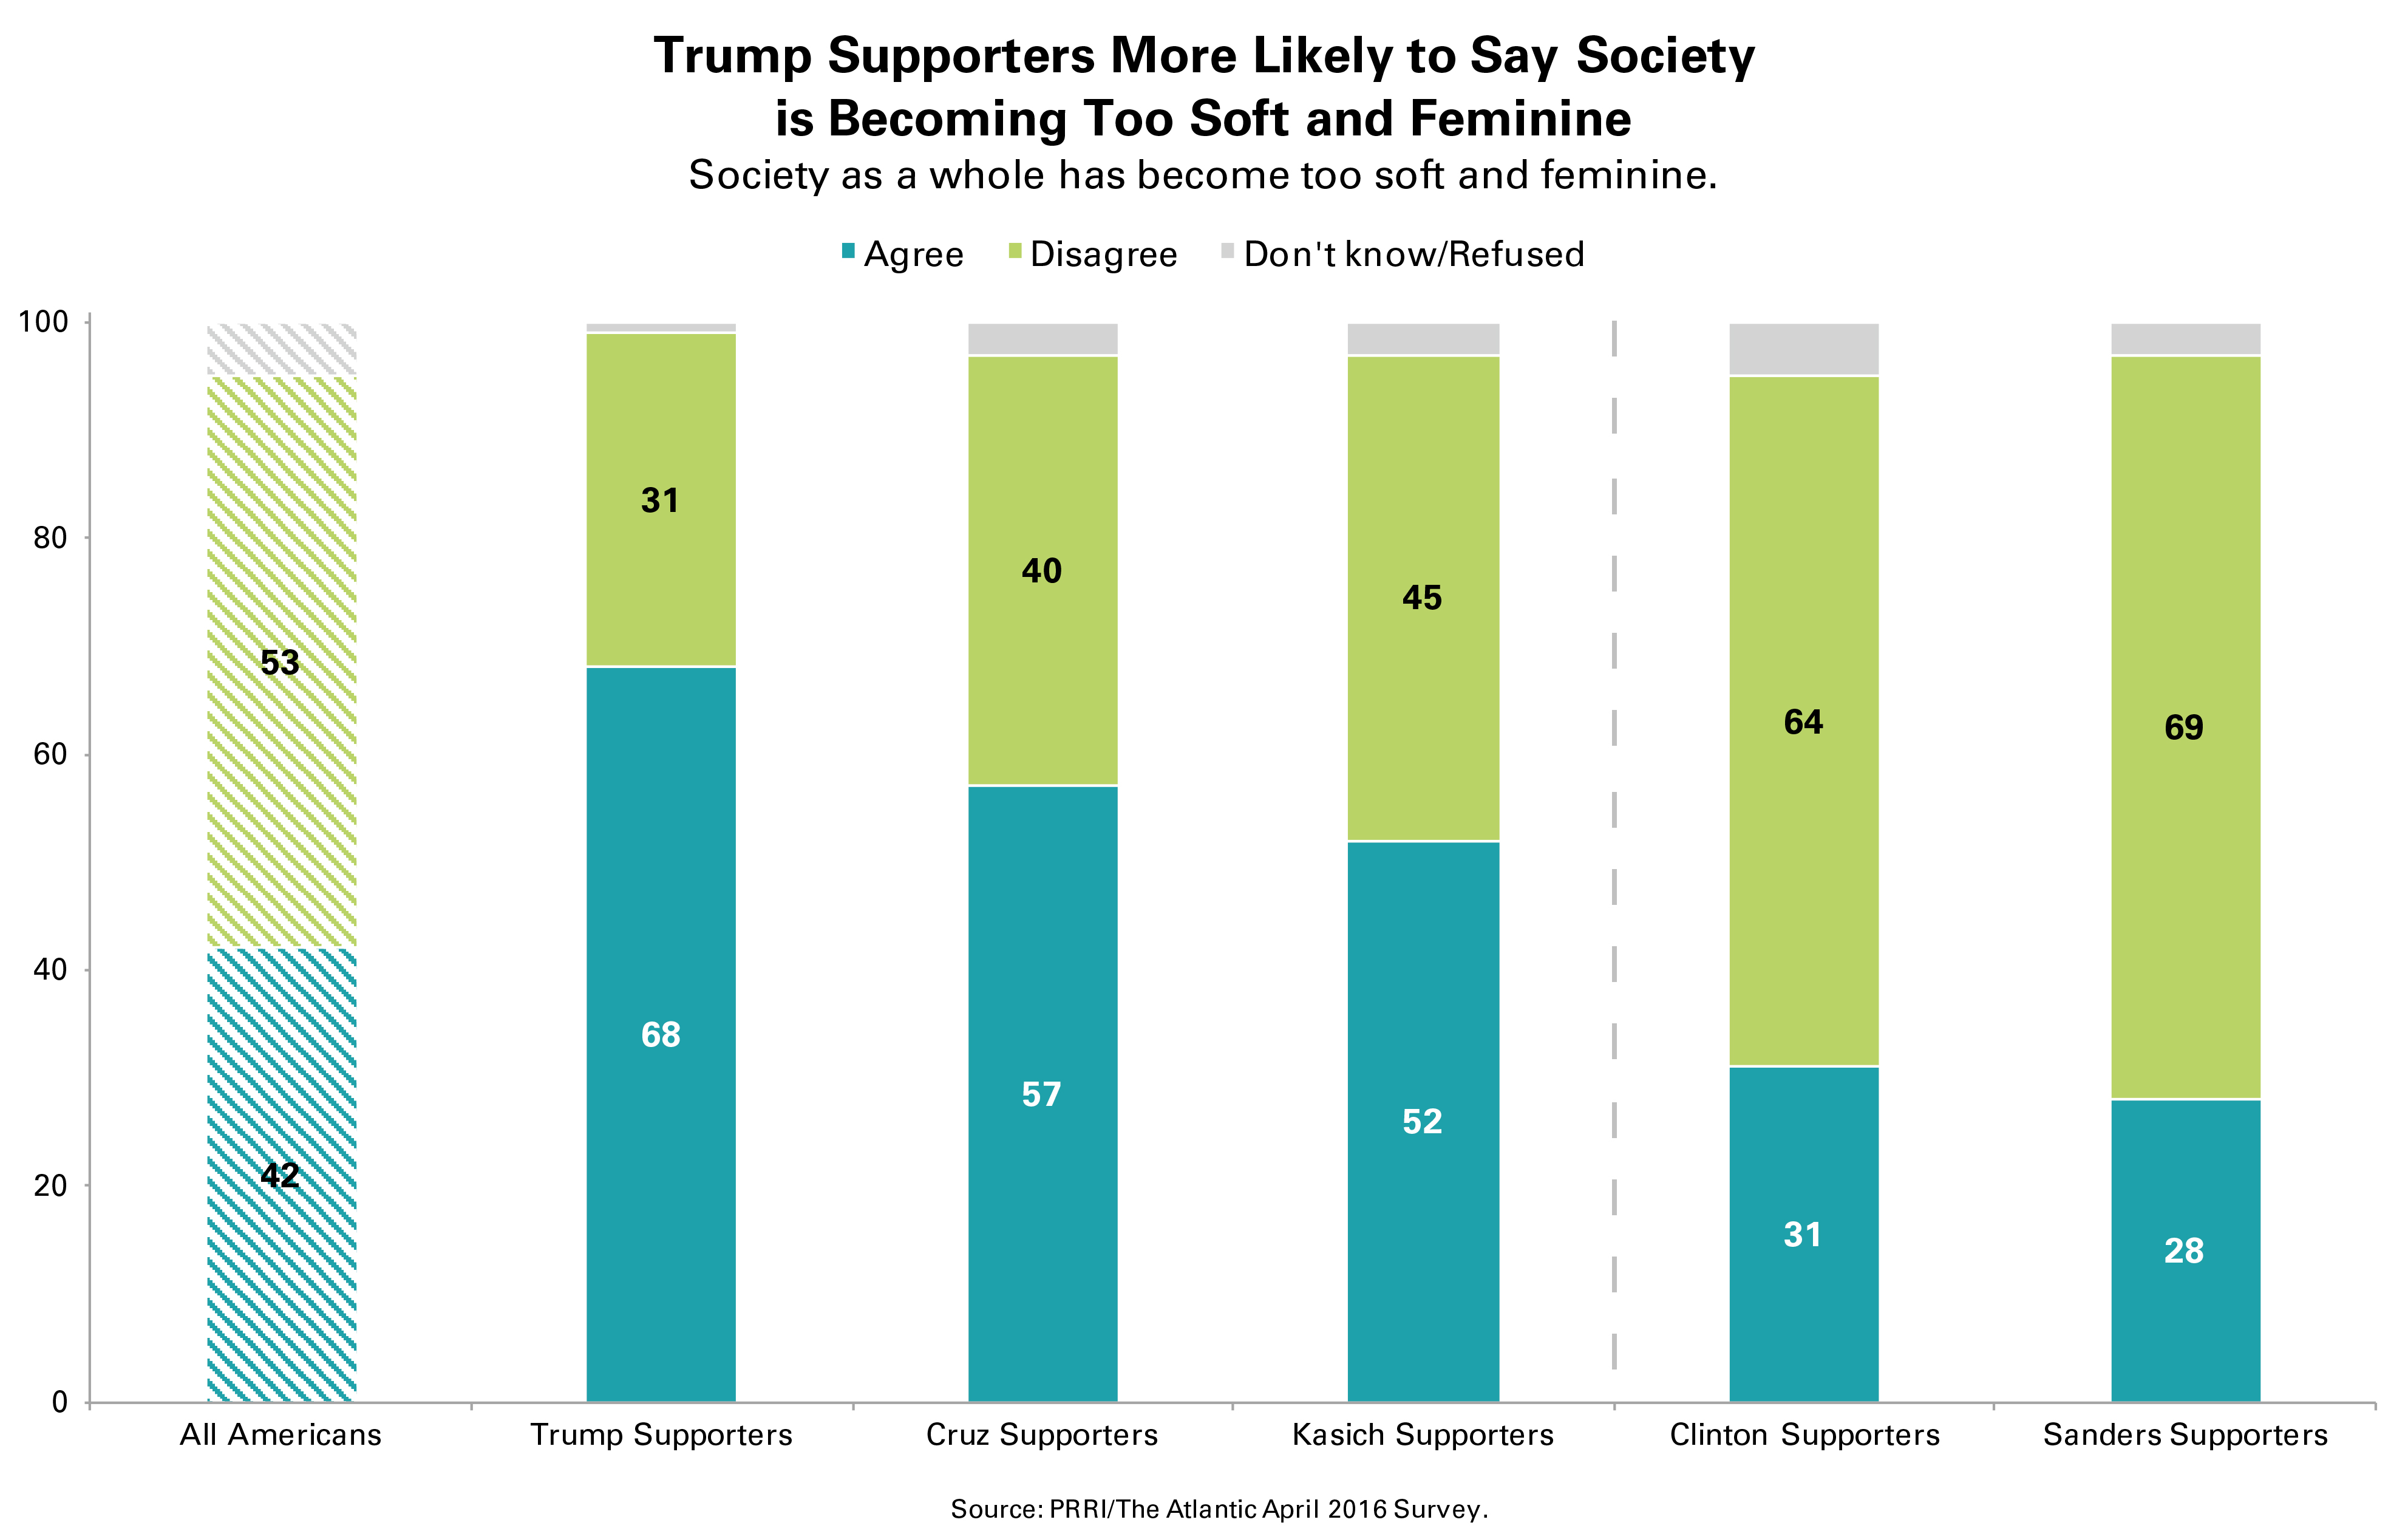 Trump supporters are notable for the degree to which they believe society is becoming too soft and feminine. More than two-thirds (68%) of Trump supporters, compared to 57% of Cruz supporters, say society as a whole has become too soft and feminine. By contrast, more than six in ten Clinton supporters (64%) and Sanders supporters (69%) reject this notion.
Traditional Gender Roles
Most Americans reject the idea that society is better off when men and women stick to more traditional gender roles and tasks. A majority (55%) of Americans do not believe that society is better off when men and women stick to the jobs and tasks they are naturally suited for, while about four in ten (39%) believe it is.
Notably, both men and women reject the notion that society is better off when people conform to traditional gender roles. A majority of both men (53%) and women (57%) disagree that society would benefit if men and women stick to jobs for which they are naturally suited.
Nearly two-thirds (65%) of Democrats reject the idea that society would benefit if men and women embraced traditional gender roles. Republicans, in contrast, are much more divided: a slim majority (51%) do not believe society is better off when men and women stick to the occupations and activities for which they are naturally suited, while 44% say it is. The attitudes of political independents closely align with the views of Republicans (52% disagree, 43% agree).
Nearly seven in ten (69%) religiously unaffiliated Americans and about six in ten black Protestants (61%), white mainline Protestants (61%), and white Catholics (57%) say society is not better off when men and women stick to more traditional roles. By contrast, roughly six in ten white evangelical Protestants (58%) and Hispanic Catholics (59%) agree that society is better off when men and women stick to activities and pursuits for which they are naturally suited.
Supporters of the two leading Republican candidates for president, Donald Trump and Ted Cruz, express similar attitudes about the societal benefit of men and women adhering to traditional gender roles. Half (50%) of Trump supporters and roughly as many (47%) Cruz supporters believe that it benefits society for men and women to embrace traditional gender roles. In contrast, only 29% of Sanders supporters and 39% Clinton supporters agree. Nearly seven in ten (68%) Sanders supporters and a majority (56%) of Clinton supporters reject the idea that society benefits when men and women remain in pursuits prescribed by their gender. These differences are largely driven by the disproportionate support Clinton has among non-white Americans who tend to hold more traditional views about gender roles. Clinton’s white supporters have nearly identical views as whites who support Sanders.
Perceptions of Discrimination Against Women
Americans generally reject the idea that discrimination against women is a thing of the past. Nearly seven in ten (68%) disagree that discrimination against women is no longer a problem in the United States, while about three in ten (31%) agree with the statement.
Notably, men and women are about equally likely to believe women still face discrimination. About seven in ten (71%) women and roughly two-thirds (65%) of men believe discrimination against women is still a problem in the U.S.
There are, however, substantial differences of opinion over whether women still face discrimination between Republicans and Democrats. Nearly eight in ten (77%) Democrats disagree that discrimination against women is no longer a problem in the U.S., compared to about six in ten (59%) Republicans. The opinions of independents closely mirror those of Americans overall.
At least seven in ten supporters of Sanders (79%) and Clinton (70%) say women still face discrimination in the U.S. On the Republican side, 59% of Cruz supporters and 52% of Trump supporters believe discrimination against women is still an issue. Forty-six percent of Trump supporters say discrimination against women is no longer a problem in the U.S.
III. Immigration, Race, and Islam
Contact with Immigrants Who Don’t Speak English
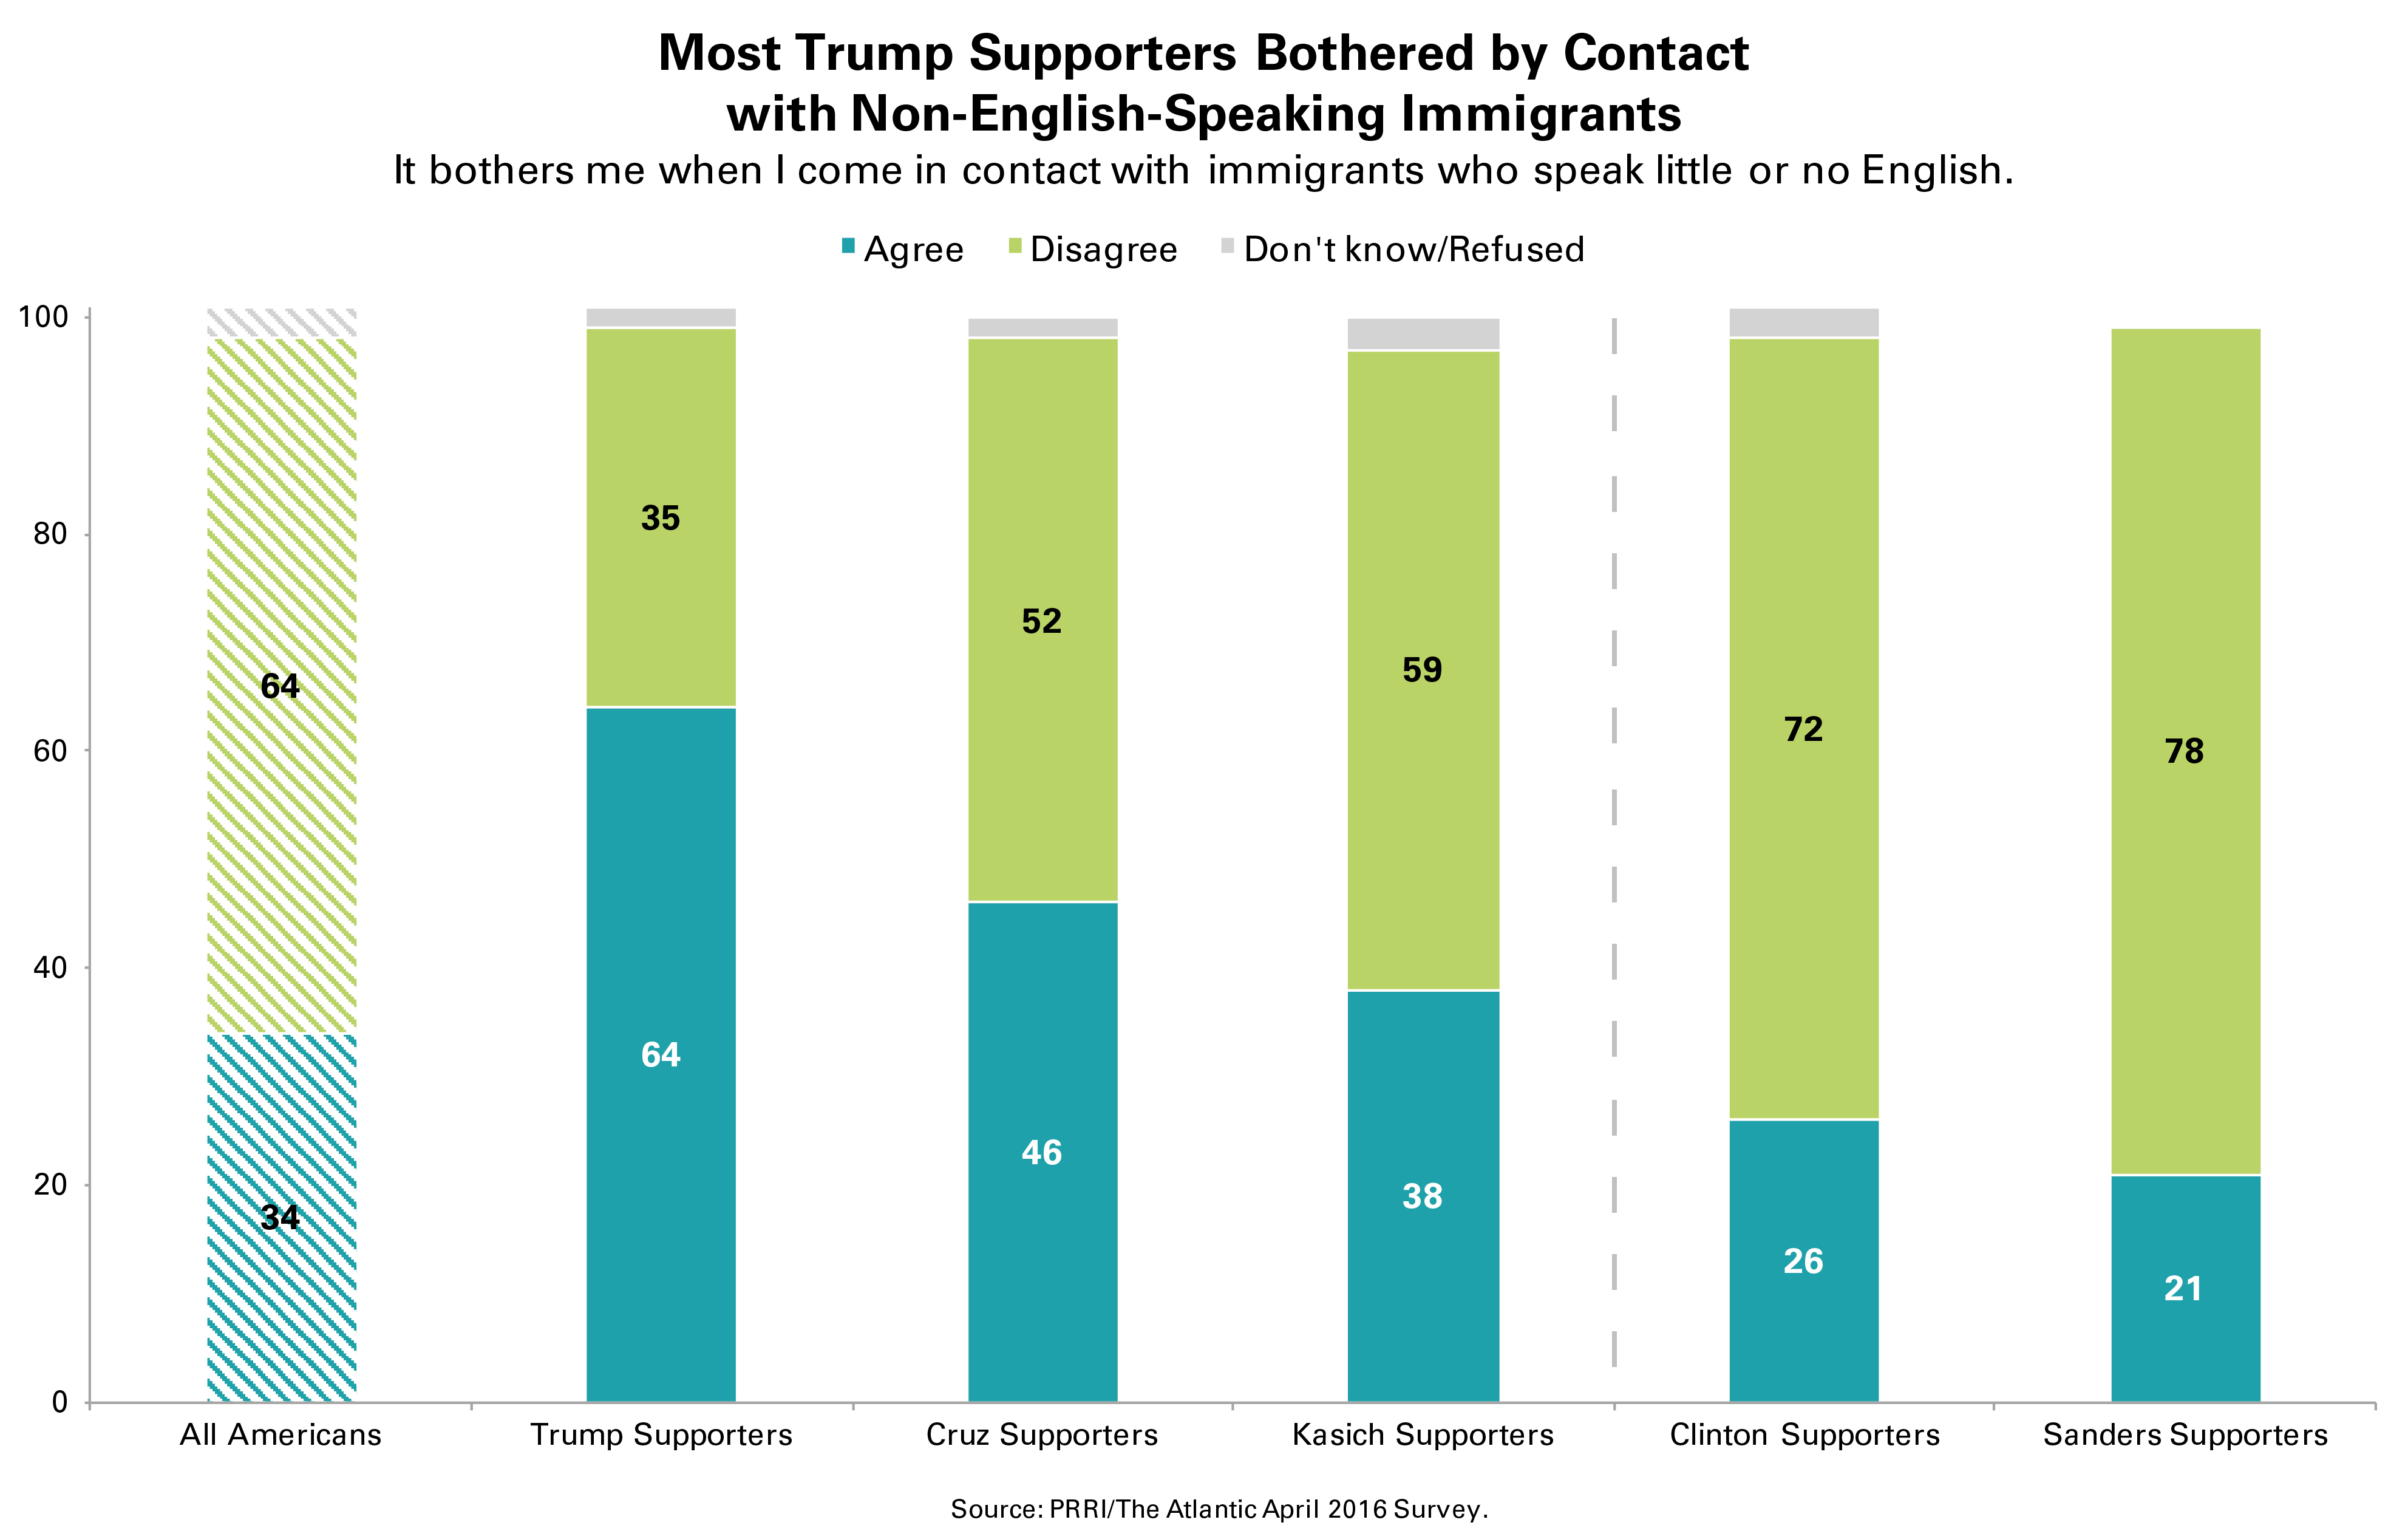
Nearly two-thirds (64%) of Americans report that it does not bother them when they come into contact with immigrants who speak little or no English, while about one-third (34%) say that it does.
The extent to which Americans report being comfortable around immigrants who do not speak English varies starkly by age. Three-quarters (76%) of young adults (age 18 to 29) say they are not bothered when coming into contact with immigrants who speak very little English. Seniors (age 65 and older) are divided: half (50%) say they are not bothered when they come into contact with immigrants who do not speak English, while 45% say that this bothers them.
Three-quarters (74%) of Democrats and roughly two-thirds (65%) of independents say they are not bothered when they come in contact with immigrants who speak little or no English. Republicans, in contrast, are almost evenly divided: 49% say it does bother them when they come into contact with immigrants who speak little English, and 48% disagree.
About two-thirds (64%) of Trump supporters say they are bothered when dealing with immigrants who speak little or no English, compared to 46% of Cruz supporters. A slim majority (52%) of Cruz supporters report they are not bothered when they come into contact with these immigrants. Only 26% of Clinton supporters and 21% of Sanders supporters say they are bothered when they encounter immigrants who speak little or no English.
Ban on Muslims Entering U.S.
Americans roundly reject the idea that the U.S. should prevent Muslims from other countries from entering the country. Two-thirds (67%) of Americans oppose banning people who are Muslim from entering the U.S., while about one-quarter (24%) favor the policy. Attitudes on the issue are virtually unchanged from December 2015 (66% favor, 27% oppose).2
More than eight in ten (82%) young adults oppose banning Muslims from entering the U.S., while fewer than six in ten (56%) seniors express the same view.
American attitudes on banning Muslims are also sharply divided along party lines. Nearly eight in ten (78%) Democrats oppose enacting a ban that would block Muslims from entering the U.S., compared to 55% of Republicans. Nearly four in ten (37%) Republicans support this proposal.
More than three-quarters of religiously unaffiliated Americans (80%), black Protestants (77%), and adherents of non-Christian faiths (76%) oppose barring people are Muslim from entering America. Two-thirds (67%) of white mainline Protestants and approximately six in ten white (62%) and Hispanic Catholics (58%) also oppose such a ban. Even among white evangelical Protestants—the religious group least likely to oppose a Muslim ban—a majority (55%) oppose prohibiting Muslims from entering the country.
Notably, even among supporters of Donald Trump, the first presidential candidate to propose a ban on Muslims entering the U.S., opinion is divided. Fewer than half (49%) of Trump supporters favor banning people who are Muslim from entering America, while 46% oppose such a ban. A majority of Cruz supporters (54%) and Kasich supporters (70%) oppose such a ban.
Government Support for Black Americans
Most Americans do not believe the government has paid too much attention to the problems of blacks and other minorities over the past couple of decades. More than six in ten (63%) Americans say they do not believe the government has paid too much attention while about three in ten (32%) Americans disagree
Nearly eight in ten black Americans (77%) disagree that the government has given too much attention to the problems of blacks and other minorities, while a significantly smaller number of white (61%) and Hispanic Americans (57%) disagree
Almost three-quarters (73%) of Democrats disagree that the government has been overly attentive to the problems of blacks and other minorities, compared to a slim majority (53%) of Republicans. More than four in ten (42%) Republicans say the problems of blacks and other minorities have received too much attention from the government. The attitudes of independents are nearly identical to the attitudes of Americans overall.
A majority (55%) of Trump supporters say the government has paid too much attention to the problems of blacks and other minorities in recent decades, while only 38% of Cruz supporters and 29% of Kasich supporters agree.
IV. Economic and Security Concerns
How Americans View Their Personal Financial Situation
A majority of Americans report a dim view of their current economic health, with a majority reporting that their current financial situation is either only fair (37%) or poor (17%). More than four in ten Americans say they are in good (36%) or excellent (8%) financial shape.
Americans’ view of their personal financial situation has declined over the past six years. In 2010, fewer than half reported being only in fair (33%) or poor (13%) economic shape, compared to half who said their financial situation was either excellent (9%) or good (41%).
Notably, Trump supporters do not report being in worse financial shape than Americans overall. Close to half of Trump supporters say that they are in excellent (12%) or good (34%) financial shape, while a majority say they are in only fair (35%) or poor (19%) financial shape. Cruz supporters report a similar financial health. Kasich supporters, however, report being in much better shape. More than six in ten Kasich supporters say they are in excellent (5%) or good (58%) shape financially.
Raising the Tax Rate on Wealthy Households
Nearly six in ten (59%) Americans favor increasing the tax rate on Americans earning more than $250,000 a year, while roughly one-third (35%) are opposed. Support has remained relatively unchanged over the last few years. In 2012, 61% of Americans expressed support for this policy
More than three-quarters (77%) of Democrats favor a tax rate increase for the wealthiest Americans. In contrast, only about four in ten (41%) Republicans favor this proposal, while 55% oppose it.
Notably, Trump supporters (48%) and Kasich supporters (47%) are significantly more likely than Cruz supporters (39%) to favor increasing taxes on the wealthy. On the Democratic side, Sanders supporters are more likely than Clinton supporters to favor an increase in the tax rate on wealthy Americans (77% vs. 69%, respectively).
Concerns About Terrorism
Nearly half (45%) of Americans report being worried that they or someone in their family will be a victim of terrorism, while 55% say that they are not too worried or not at all worried. Public concern about terrorism has remained steady since December 2015.
Republicans are significantly more likely than Democrats to say they are somewhat or very concerned about being a victim of terrorism (49% vs. 39%, respectively). More than six in ten (61%) Democrats say that they are not concerned about being affected by terrorism. Independents roughly mirror the general population on this issue.
A majority (53%) of Donald Trump supporters report being worried that they or a family member will be a victim of terrorism. Fewer than half of Kasich (47%), Clinton (46%), and Cruz (45%) supporters report being concerned about terrorism. Notably, only one-third (33%) of Sanders supporters say they are very or somewhat worried.
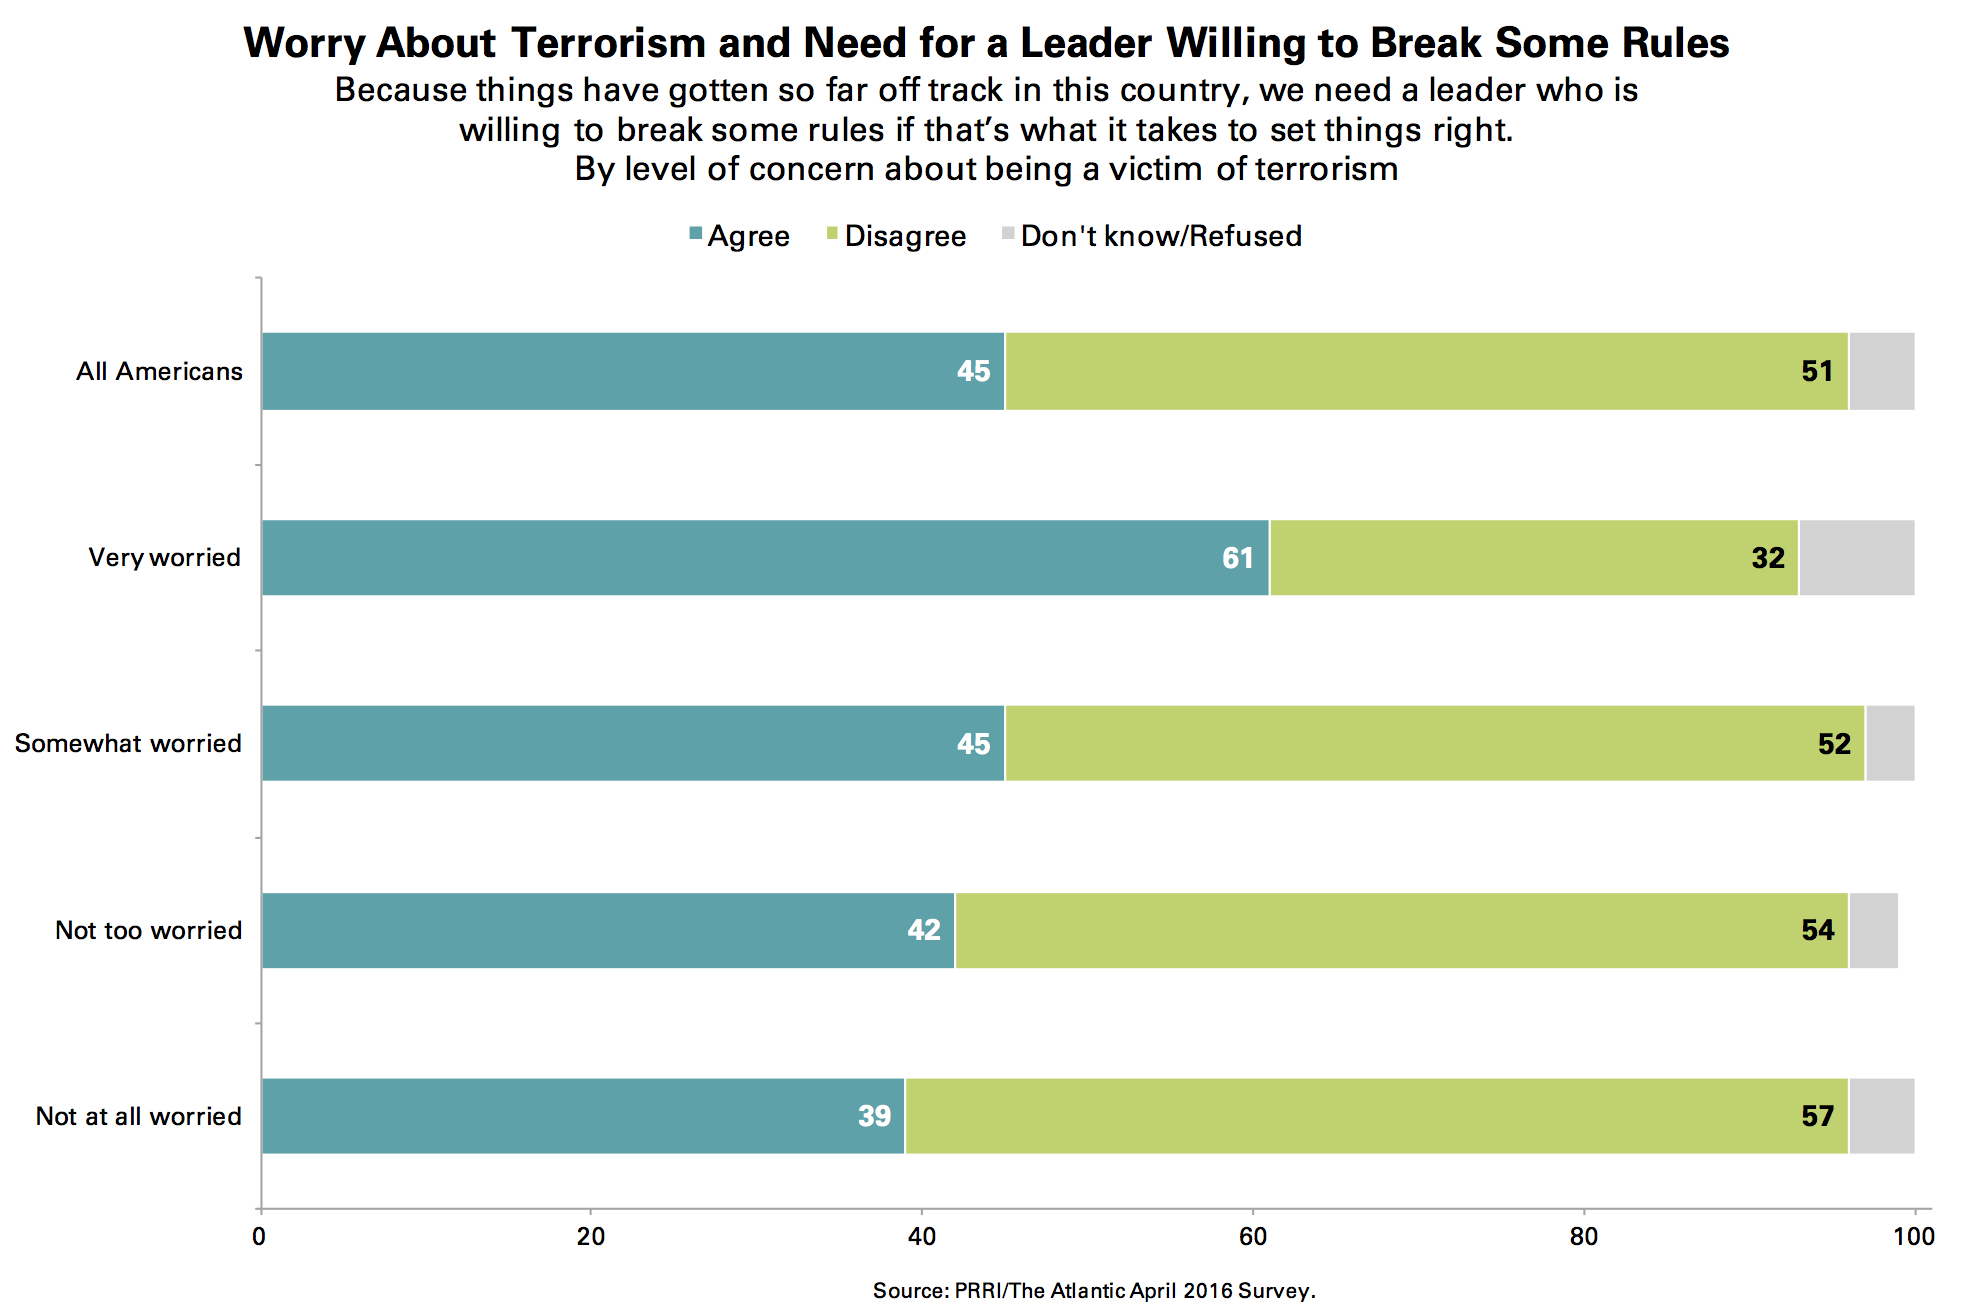 Americans who are most concerned about terrorism also report much stronger support for a leader who is willing to break the rules. About six in ten (61%) Americans who say they are very worried about being a victim of terrorism agree that the country needs a leader who is willing to break rules to put things right, compared to 39% of those who are not at all concerned.
Endnotes
1 Supporters refers to Americans who express a preference for a particular candidate and is not limited to registered voters.
2 Quinnipiac University Poll, December 2015.
Recommended citation:
Jones, Robert P., and Daniel Cox. “Two-thirds of Trump Supporters Say Nation Needs a Leader Willing to Break the Rules: PRRI/The Atlantic Survey.” PRRI. 2016. http://www.prri.org/research/prri-atlantic-poll-republican-democratic-primary-trump-supporters/.