I. Attitudes on Same-sex Marriage Steady in 2015
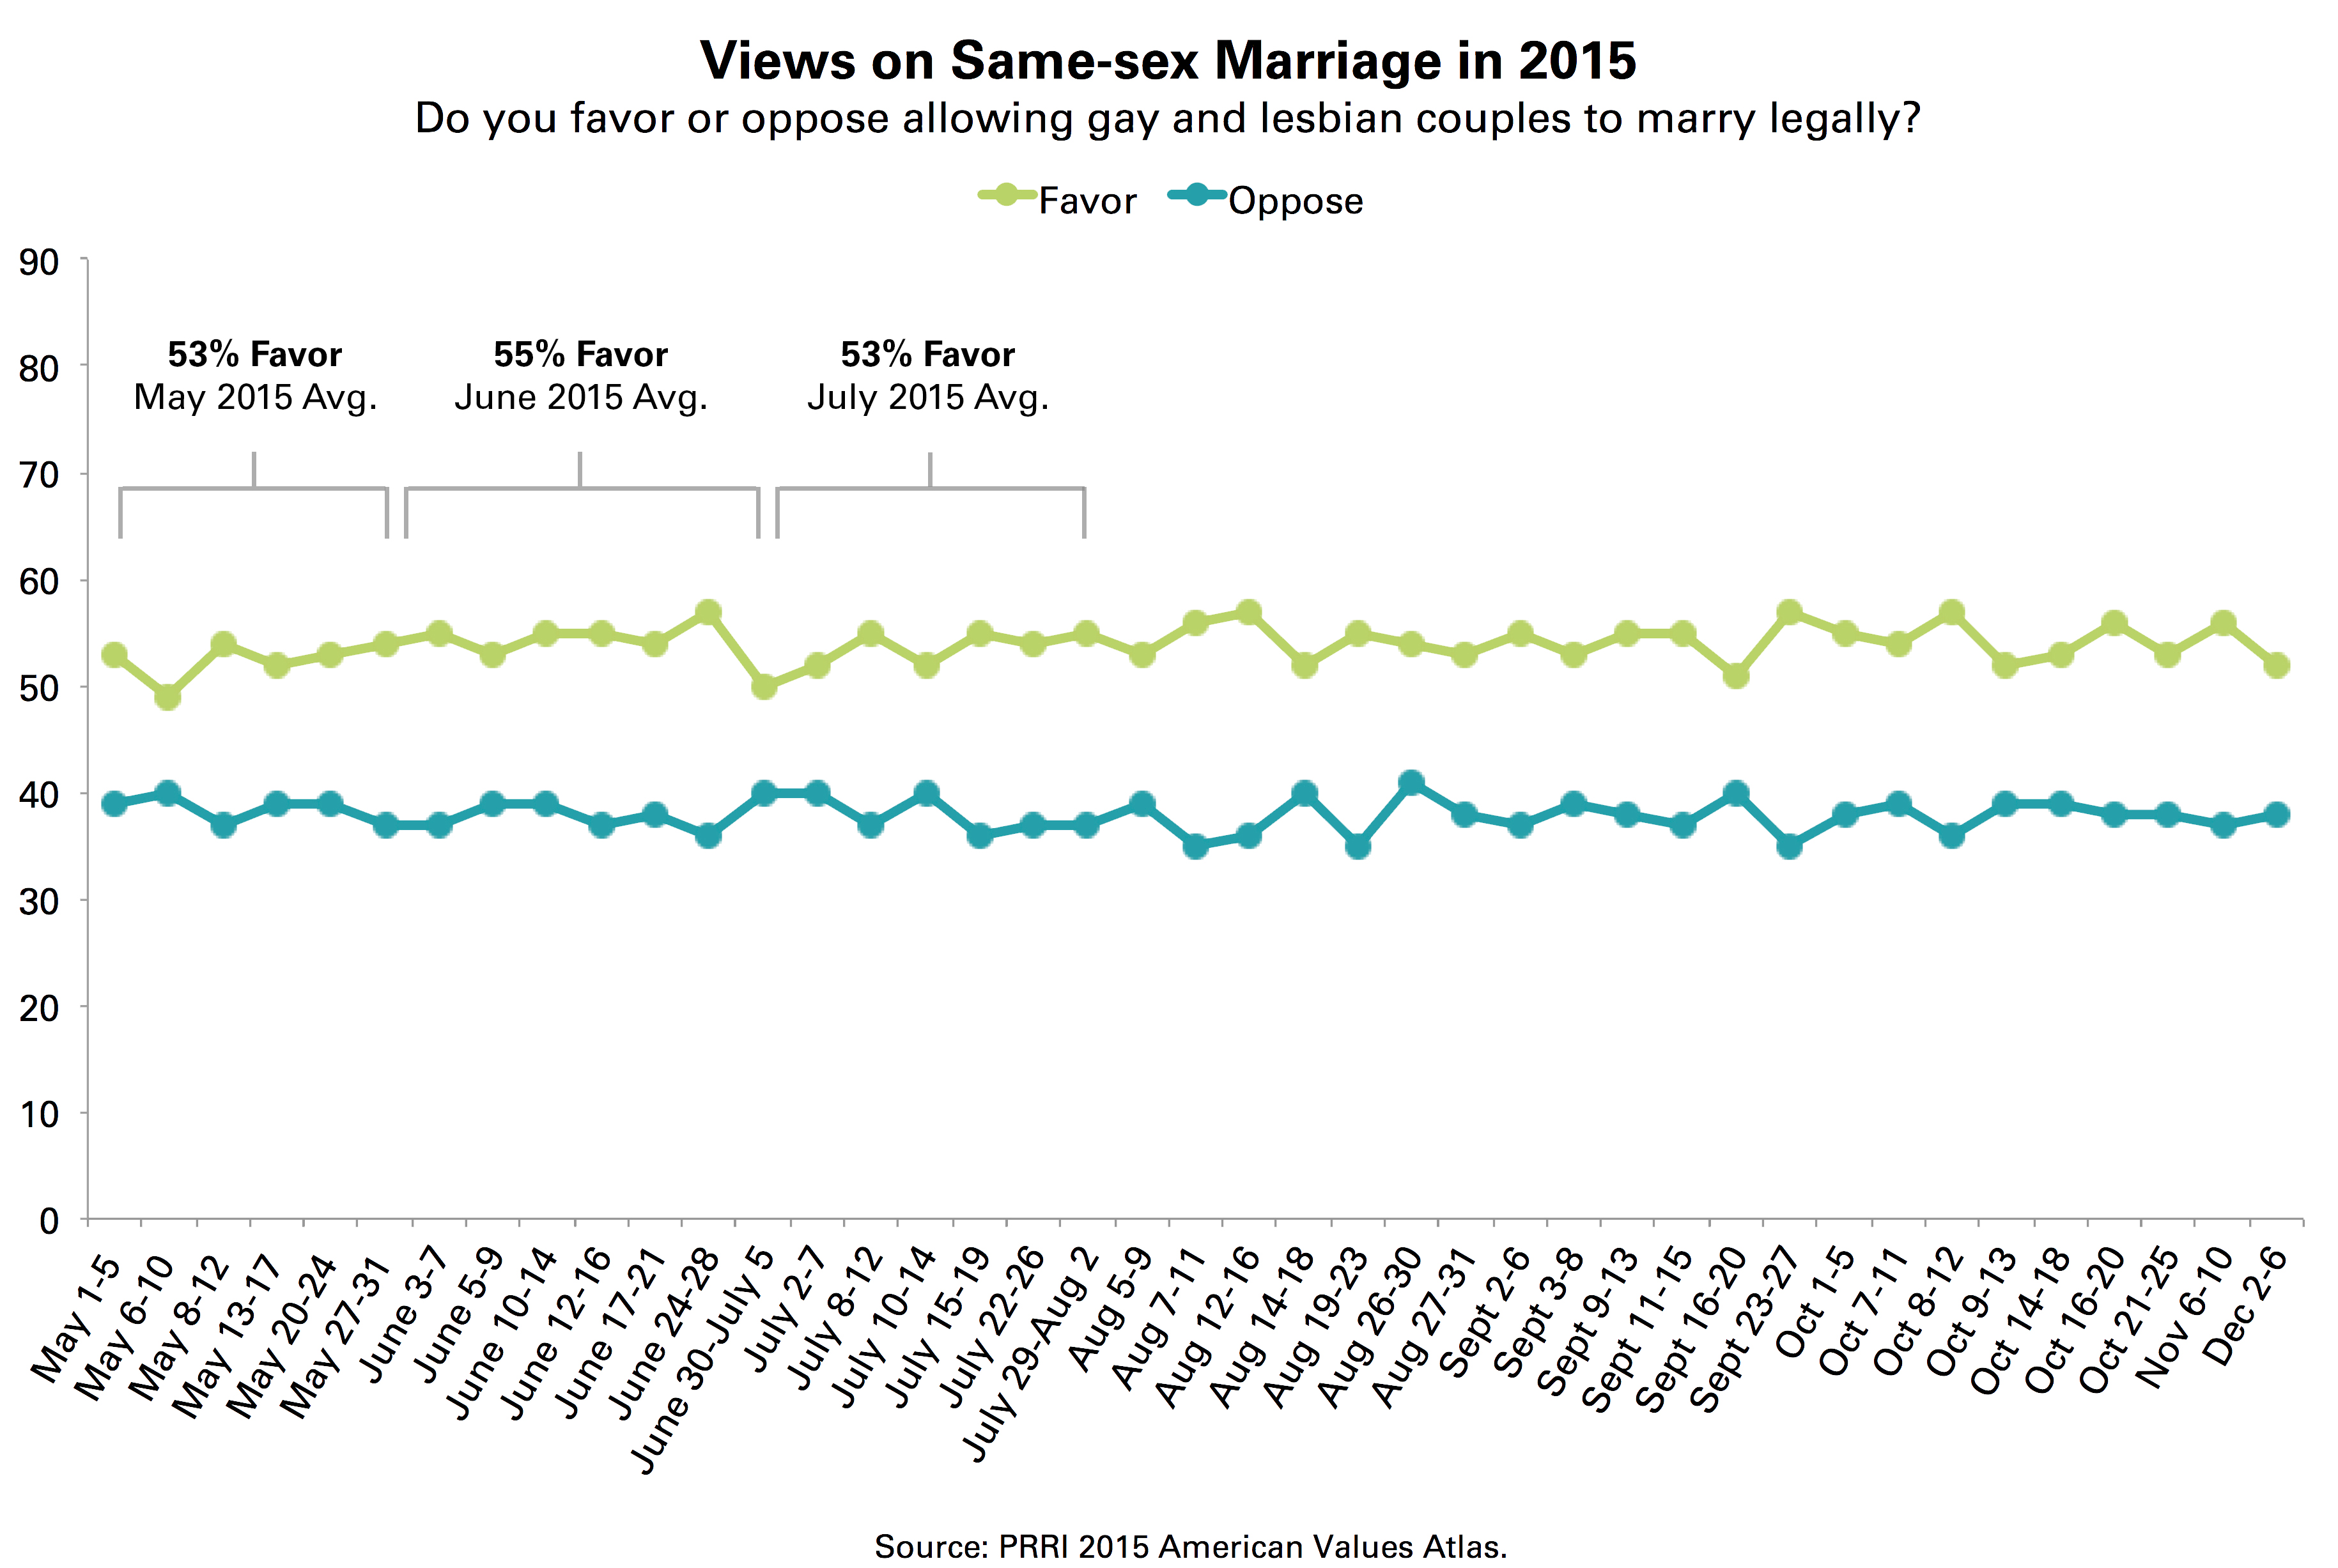
Across 2015, the year that saw same-sex marriage become legal in all 50 states following the landmark Obergefell v. Hodges Supreme Court decision in June, public opinion on same-sex marriage remained remarkably stable. Based on interviews with more than 42,000 Americans conducted between May and December 2015, PRRI finds that 53% of Americans support allowing gay and lesbian people to legally marry, while 37% are opposed.
In surveys conducted during May 2015, the month before the Supreme Court decision, 53% of the public on average supported same-sex marriage. Weekly tracking polls showed no significant shift in opinion as a result of the court decision, with the June average showing 55% support and the July average showing 53% support.
Same-sex Marriage by Age and Gender
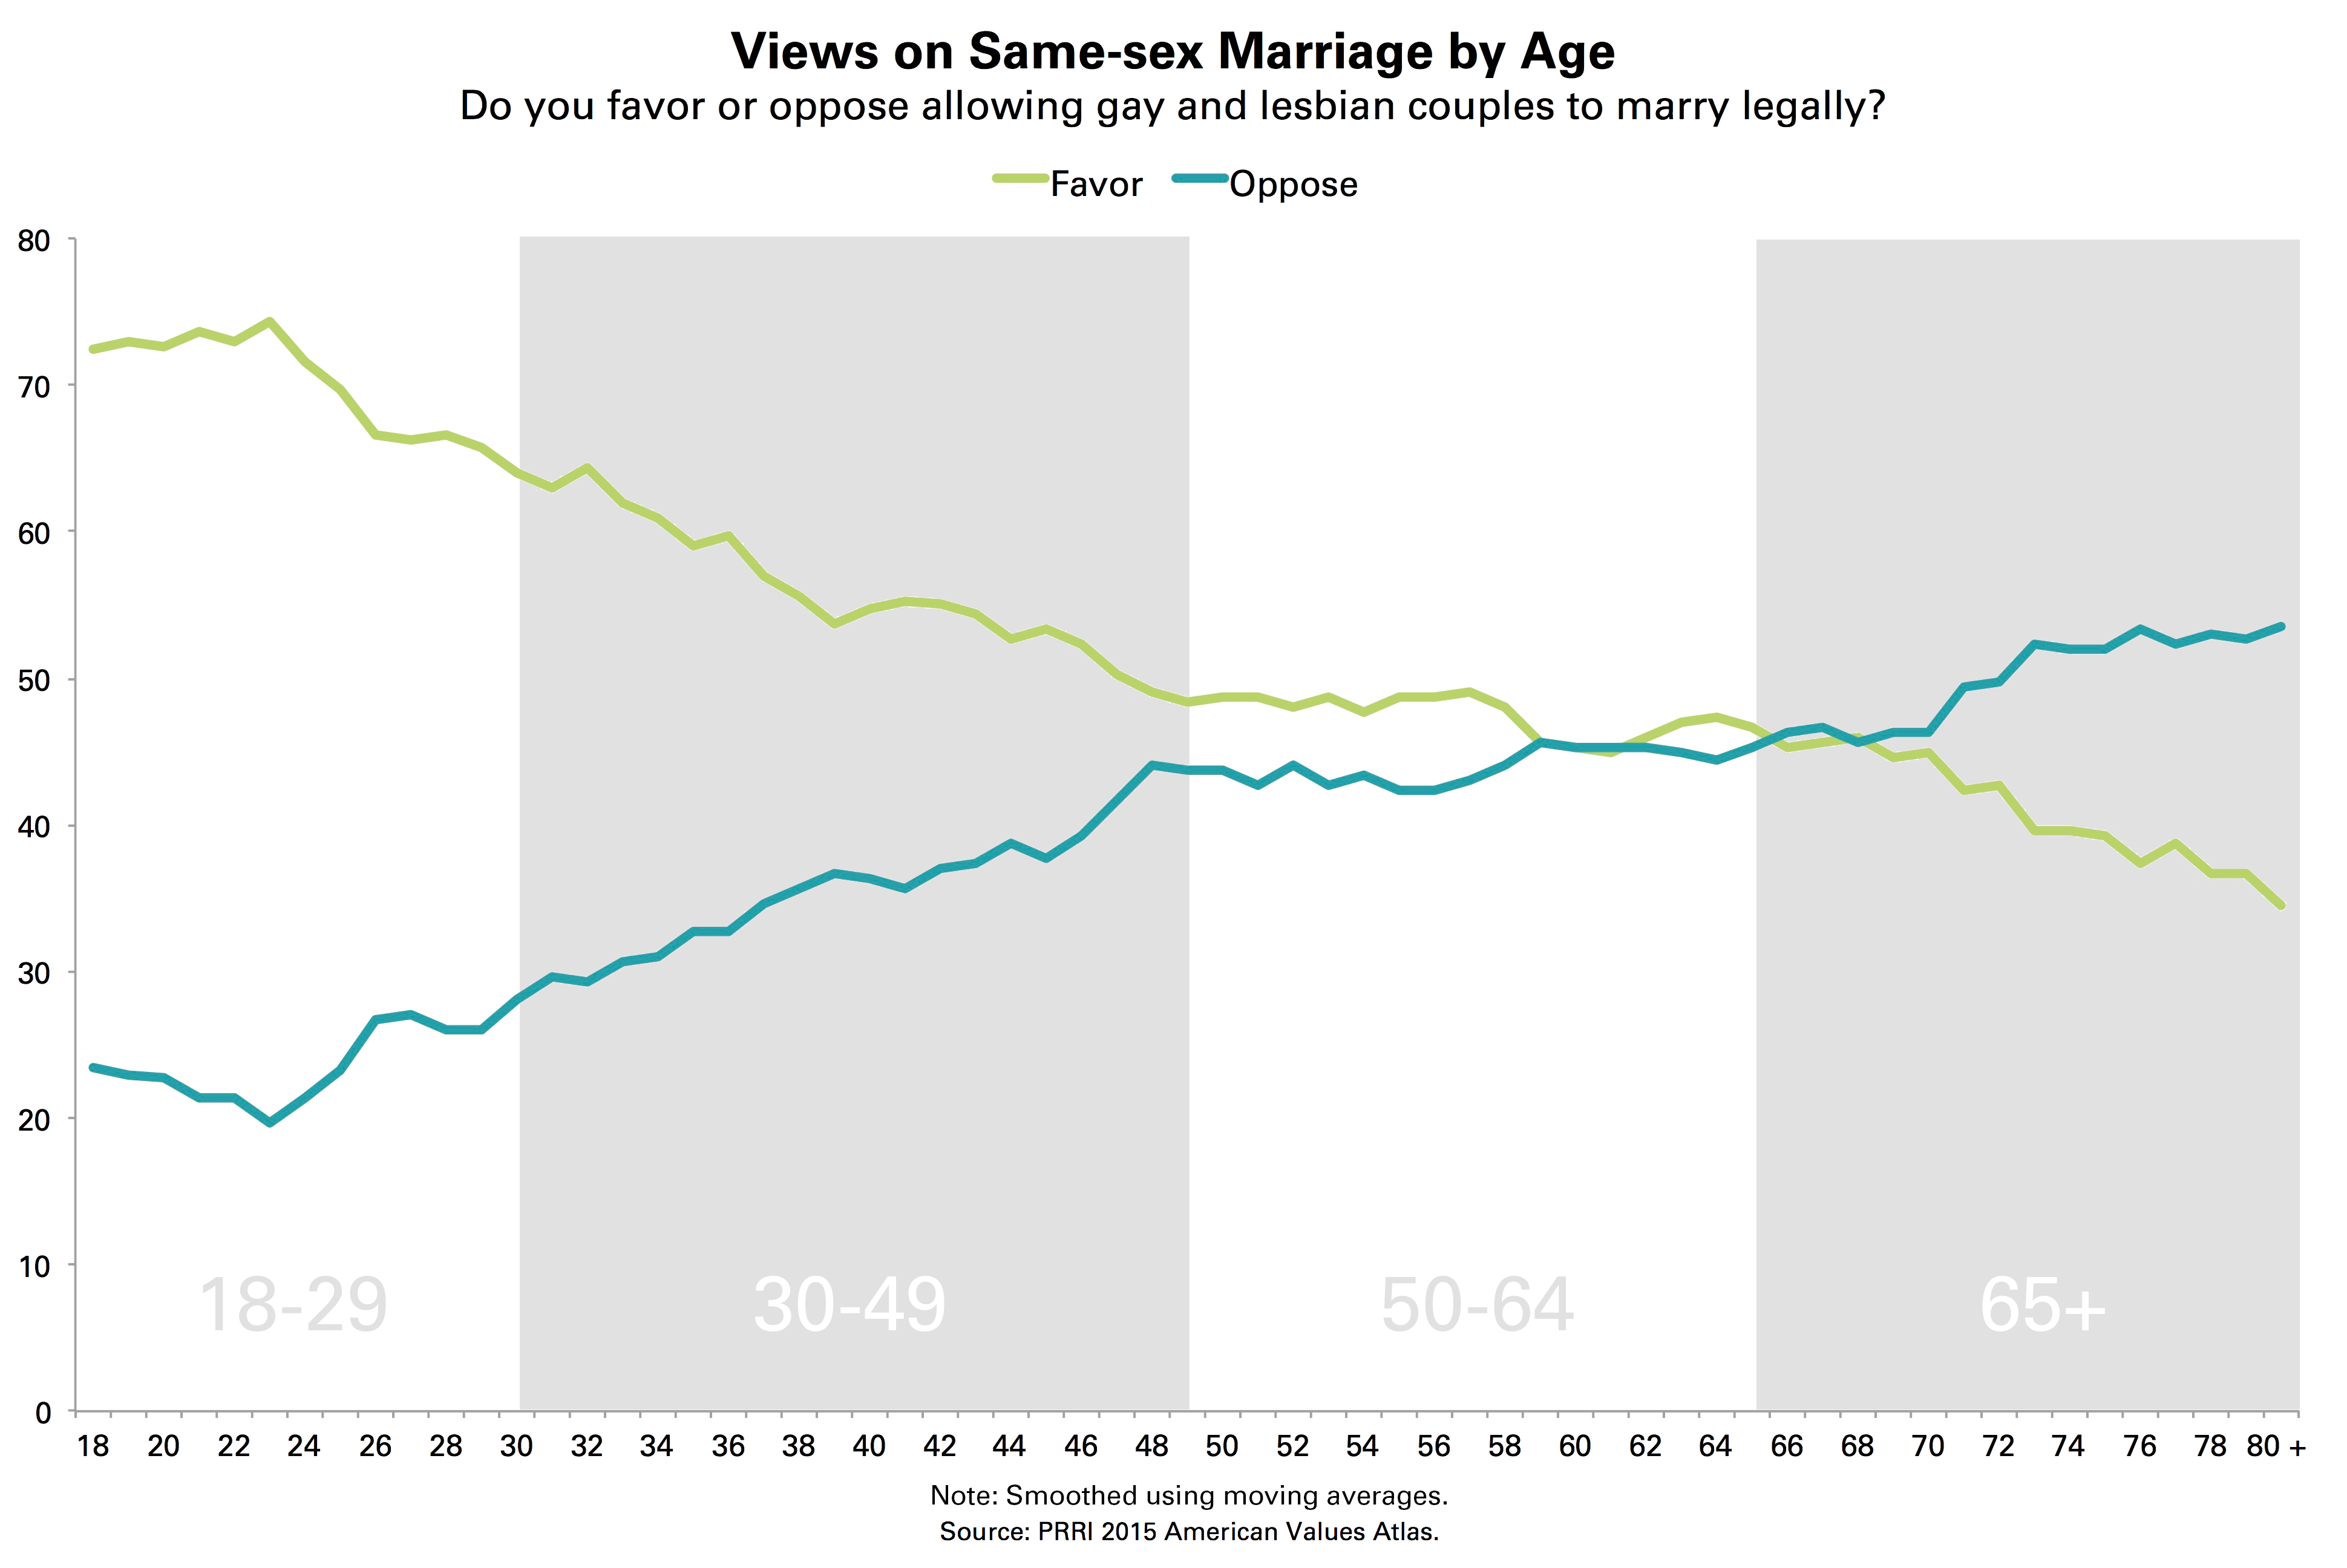
Few attributes are more important in structuring attitudes on same-sex marriage than age. Generally, there is an inverse relationship between support for same-sex marriage and increasing age, but the relationship is not uniformly linear. Among younger American adults, from those in their late teens to mid-forties, majorities support same-sex marriage, with the strength of support generally decreasing as age increases. For example, 74% of 20-year-olds support same-sex marriage, compared to 53% of 45-year-olds.
Among Americans in their late forties to late sixties, the linear relationship between support for same-sex marriage and age plateaus, with Americans in this group roughly divided on the issue. Forty-nine percent of 50-year-olds support same-sex marriage, a number that is similar to support among 68-year-olds (48%). The linear relationship between support for same-sex marriage and age picks up again among Americans who are 70 years of age or older. For example, 41% of 70-year-olds support same-sex marriage, compared to only 33% of those aged 80 and older.
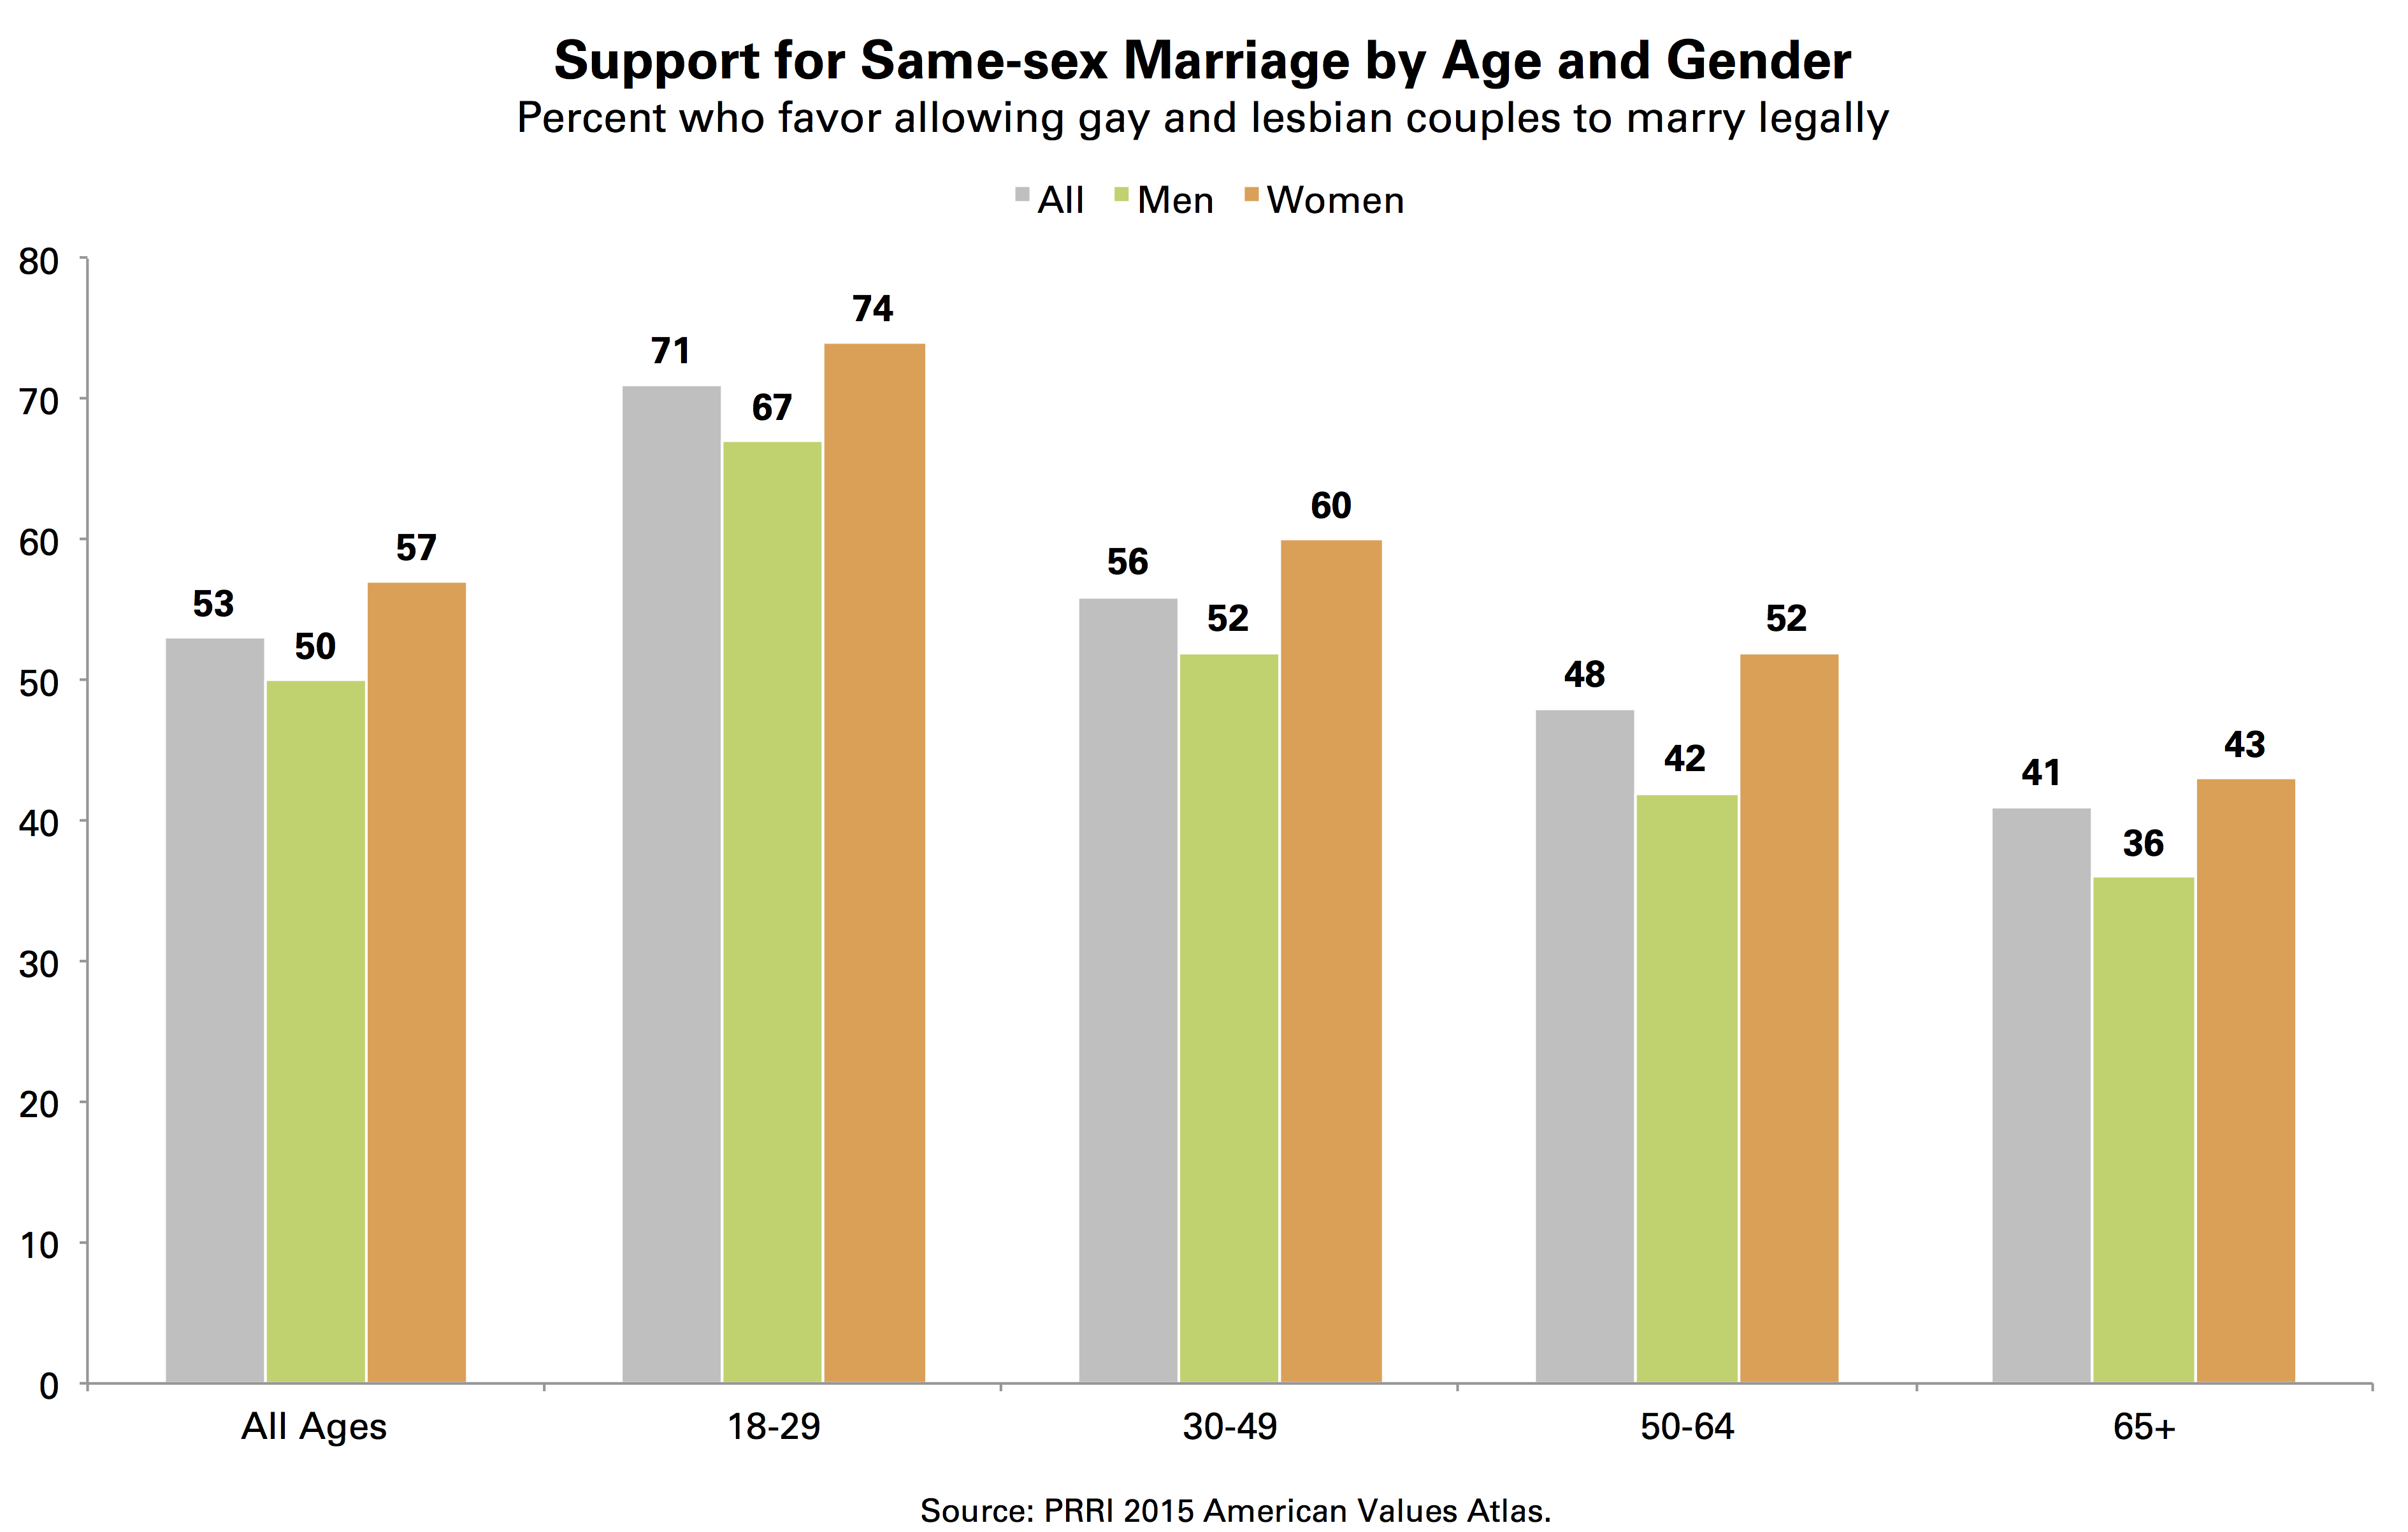
The correlation between age and support for same-sex marriage is also striking when comparing age cohorts. More than seven in ten (71%) young adults (age 18 to 29) favor allowing gay and lesbian couples to marry, compared to roughly four in ten (41%) seniors (age 65 and older). Notably, however, there is no age group in which a majority opposes same-sex marriage. Only half (50%) of seniors oppose same-sex marriage, although one in ten (10%) offer no opinion on the issue.
Women are somewhat more likely to support same-sex marriage than men, a pattern that is consistent across generations. Overall, nearly six in ten (57%) women, compared to only half (50%) of men, favor allowing gay and lesbian couples to marry legally. Among young adults, roughly three-quarters (74%) of women and two-thirds (67%) of men favor same-sex marriage.1 The age gap is roughly the same size among seniors. More than four in ten (43%) senior women, but only 36% of senior men, support same-sex marriage.
Same-sex Marriage by Race and Ethnicity
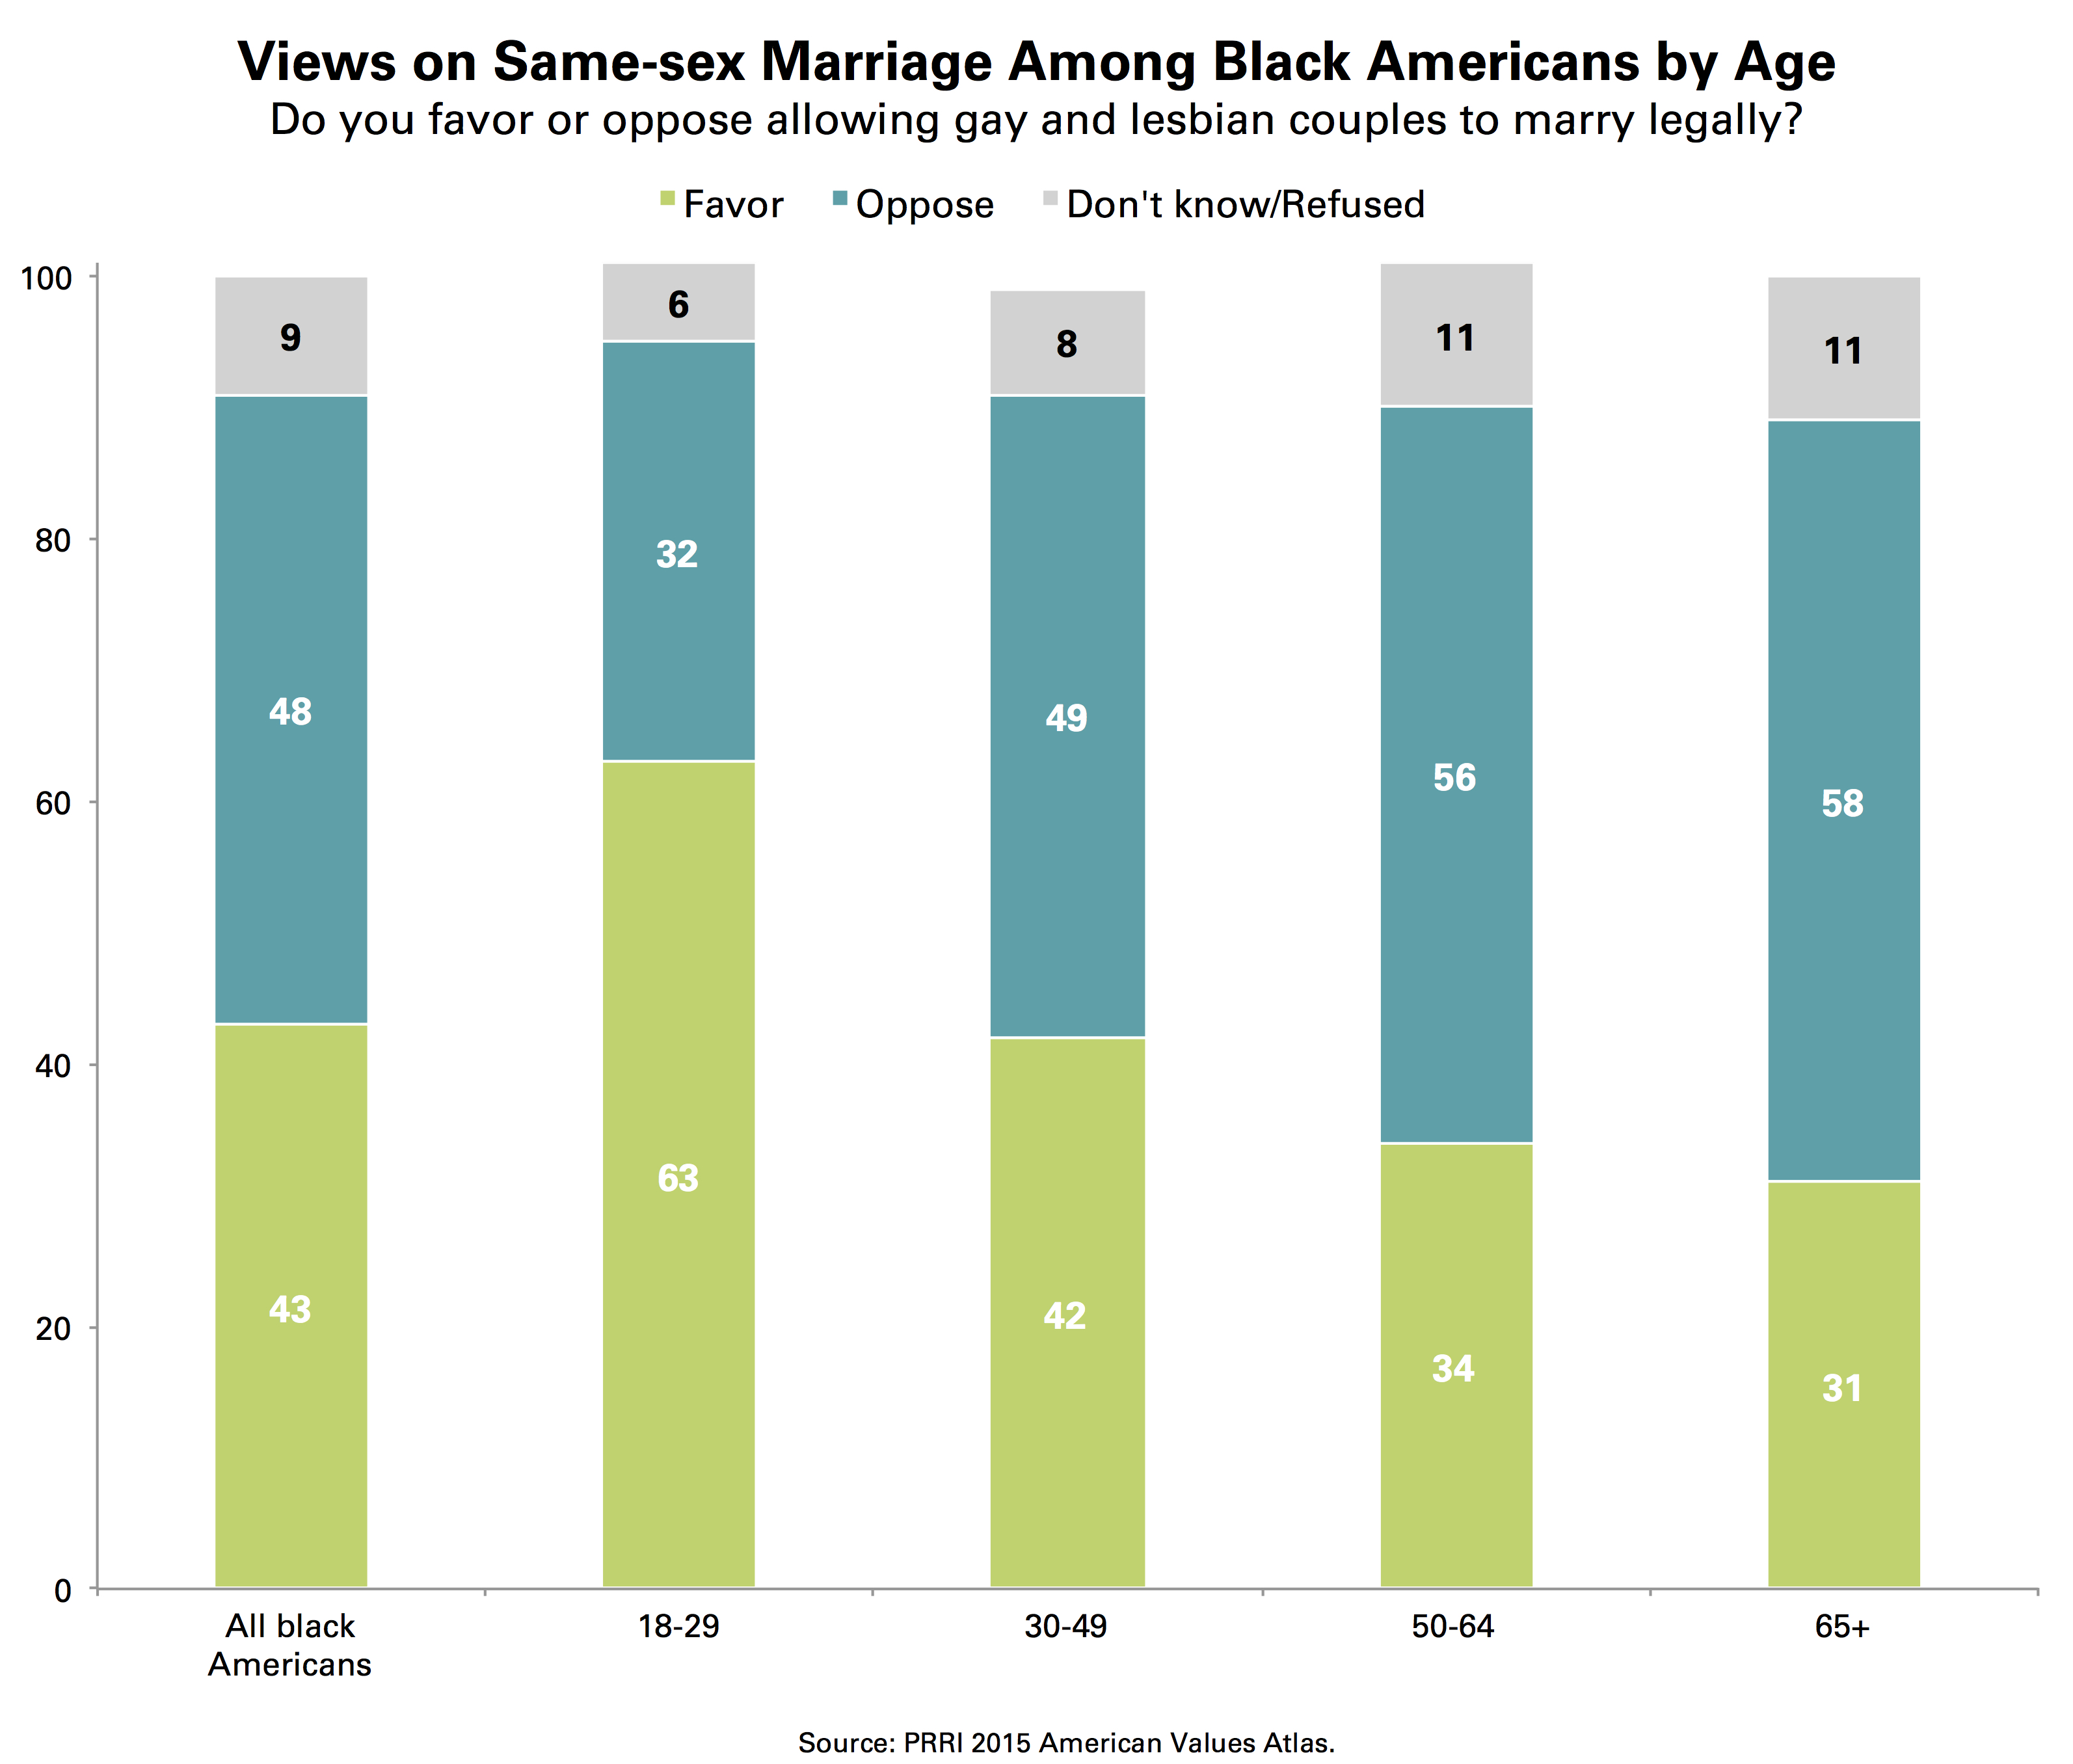
Among racial and ethnic groups, Americans who identify as Asian or Pacific Islander (API) are the most supportive of same-sex marriage. Nearly two-thirds (64%) of API Americans favor allowing gay and lesbian couples to marry. Similar to the public overall, majorities of white Americans (56%), Hispanic Americans (54%), and mixed-race Americans (55%) favor same-sex marriage. Black Americans are roughly divided in their opinions about same-sex marriage (43% favor, 48% oppose). There is a strong generational divide among black Americans, with 63% of black Americans under the age of 30 supporting same-sex marriage, compared to only 31% of black seniors.
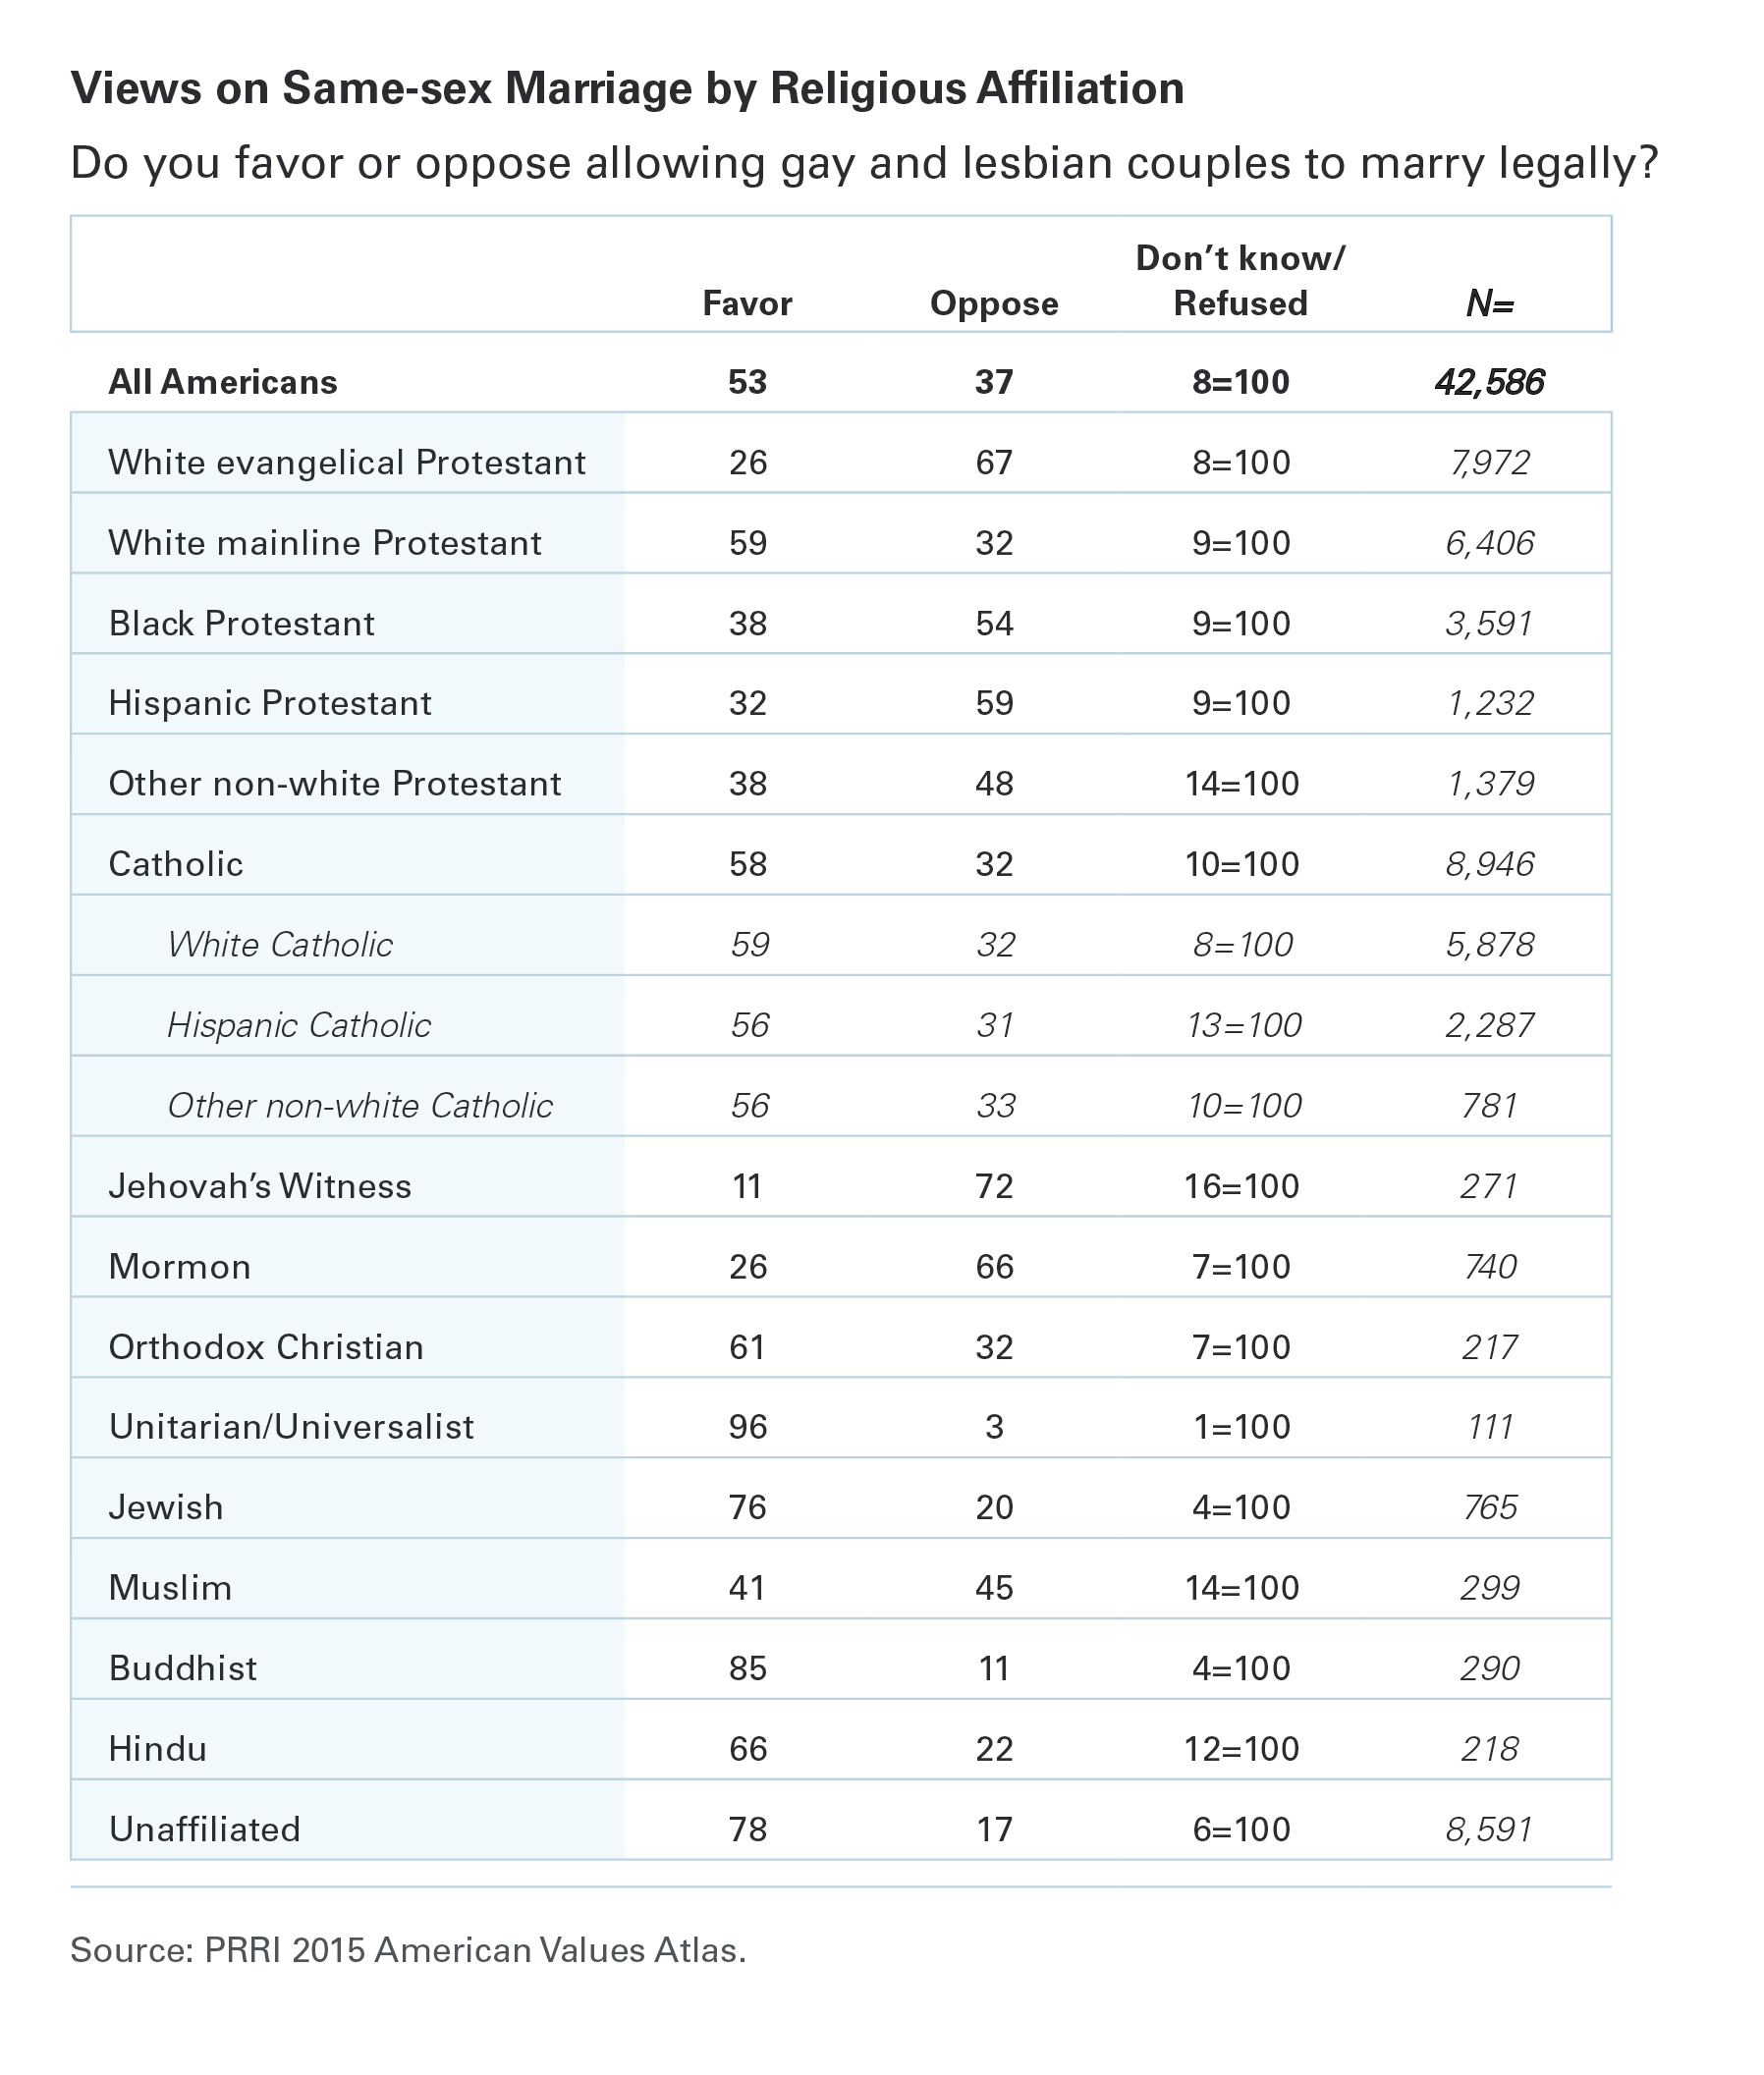
Same-sex Marriage by Religious Affiliation
The strongest supporters of same-sex marriage continue to be members of non-Christian religious traditions and religiously unaffiliated Americans. At least three-quarters of Buddhists (85%), the religiously unaffiliated (78%), and Jewish Americans (76%) favor allowing gay and lesbian to marry. Solid majorities of Hindus (66%), Orthodox Christians (61%), white mainline Protestants (59%), white Catholics (59%), and Hispanic Catholics (56%) also express support for same-sex marriage. In contrast, majorities of black Protestants (54%), Hispanic Protestants (59%), Mormons (66%), white evangelical Protestants (67%), and Jehovah’s Witnesses (72%) oppose allowing gay and lesbian couples to marry. Muslims are divided in their opinions over same-sex marriage (41% favor, 45% oppose).
Even among the most ardent opponents of same-sex marriage, stark generational divisions persist. Young white evangelical Protestants, for example, are divided over same-sex marriage, with roughly equal numbers expressing support (47%) and opposition (49%). In contrast, roughly three-quarters (74%) of white evangelical Protestant seniors oppose same-sex marriage. There are only modest generational differences among Mormons. Nearly six in ten (58%) younger Mormons oppose same-sex marriage, as do seven in ten (70%) Mormon seniors.
Same-sex Marriage by Political Affiliation
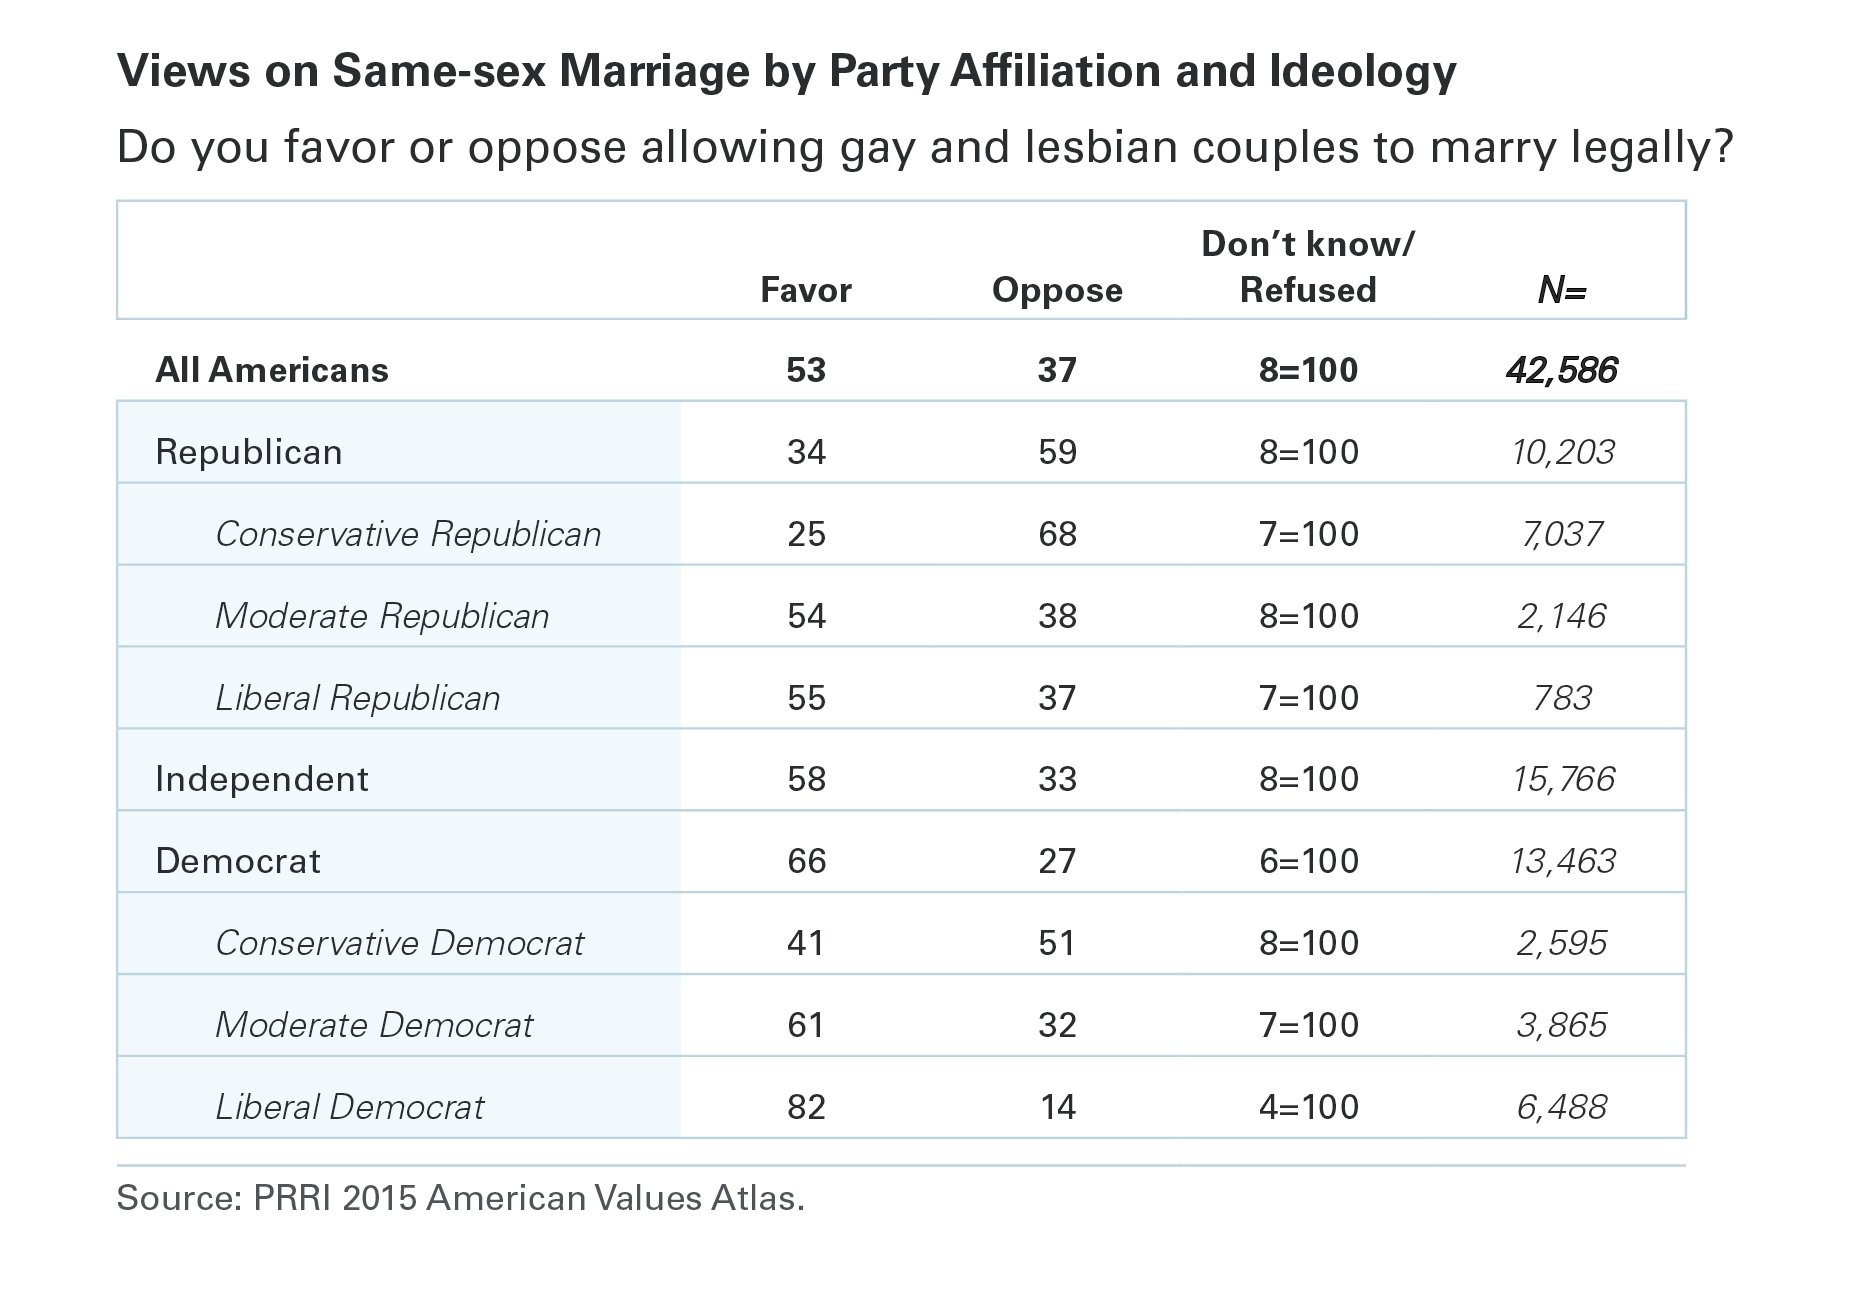
The views of Republicans and Democrats on same-sex marriage are near mirror opposites. Roughly two-thirds (66%) of Democrats favor allowing gay and lesbian couples to marry, while fewer than three in ten (27%) are opposed. Conversely, nearly six in ten (59%) Republicans oppose same-sex marriage, while about one-third (34%) support it. Political independents are closer to Democrats than Republicans on this issue: a majority (58%) favor allowing gay and lesbian couples to marry.
However, ideology impacts Republicans and Democrats alike on the issue of same-sex marriage. While about eight in ten (82%) liberal Democrats and roughly six in ten (61%) moderate Democrats support same-sex marriage, only about four in ten (41%) conservative Democrats say the same. Among Republicans, a majority of liberal (55%) and moderate (54%) Republicans favor same-sex marriage, compared to only one-quarter (25%) of conservative Republicans. Approximately seven in ten (68%) conservative Republicans oppose same-sex marriage.
Even among the most ardent opponents of same-sex marriage, stark generational divisions persist. Young white evangelical Protestants, for example, are divided over same-sex marriage, with roughly equal numbers expressing support (47%) and opposition (49%). In contrast, roughly three-quarters (74%) of white evangelical Protestant seniors oppose same-sex marriage. There are only modest generational differences among Mormons. Nearly six in ten (58%) younger Mormons oppose same-sex marriage, as do seven in ten (70%) Mormon seniors.
Same-sex Marriage by Geography
Support for same-sex marriage varies significantly by region. Residents of the Northeast express the highest support, with more than six in ten (63%) favoring same-sex marriage. A majority of Americans living in the West (59%) and the Midwest (54%) also favor same-sex marriage, while residents of the South are divided on the issue (46% favor, 45% oppose).
In the South, however, there are significant generational divisions on the issue. Two-thirds (67%) of young adults in the South support same-sex marriage, compared to roughly one-third (32%) of seniors. Nearly six in ten (58%) Southern seniors express opposition to same-sex marriage.
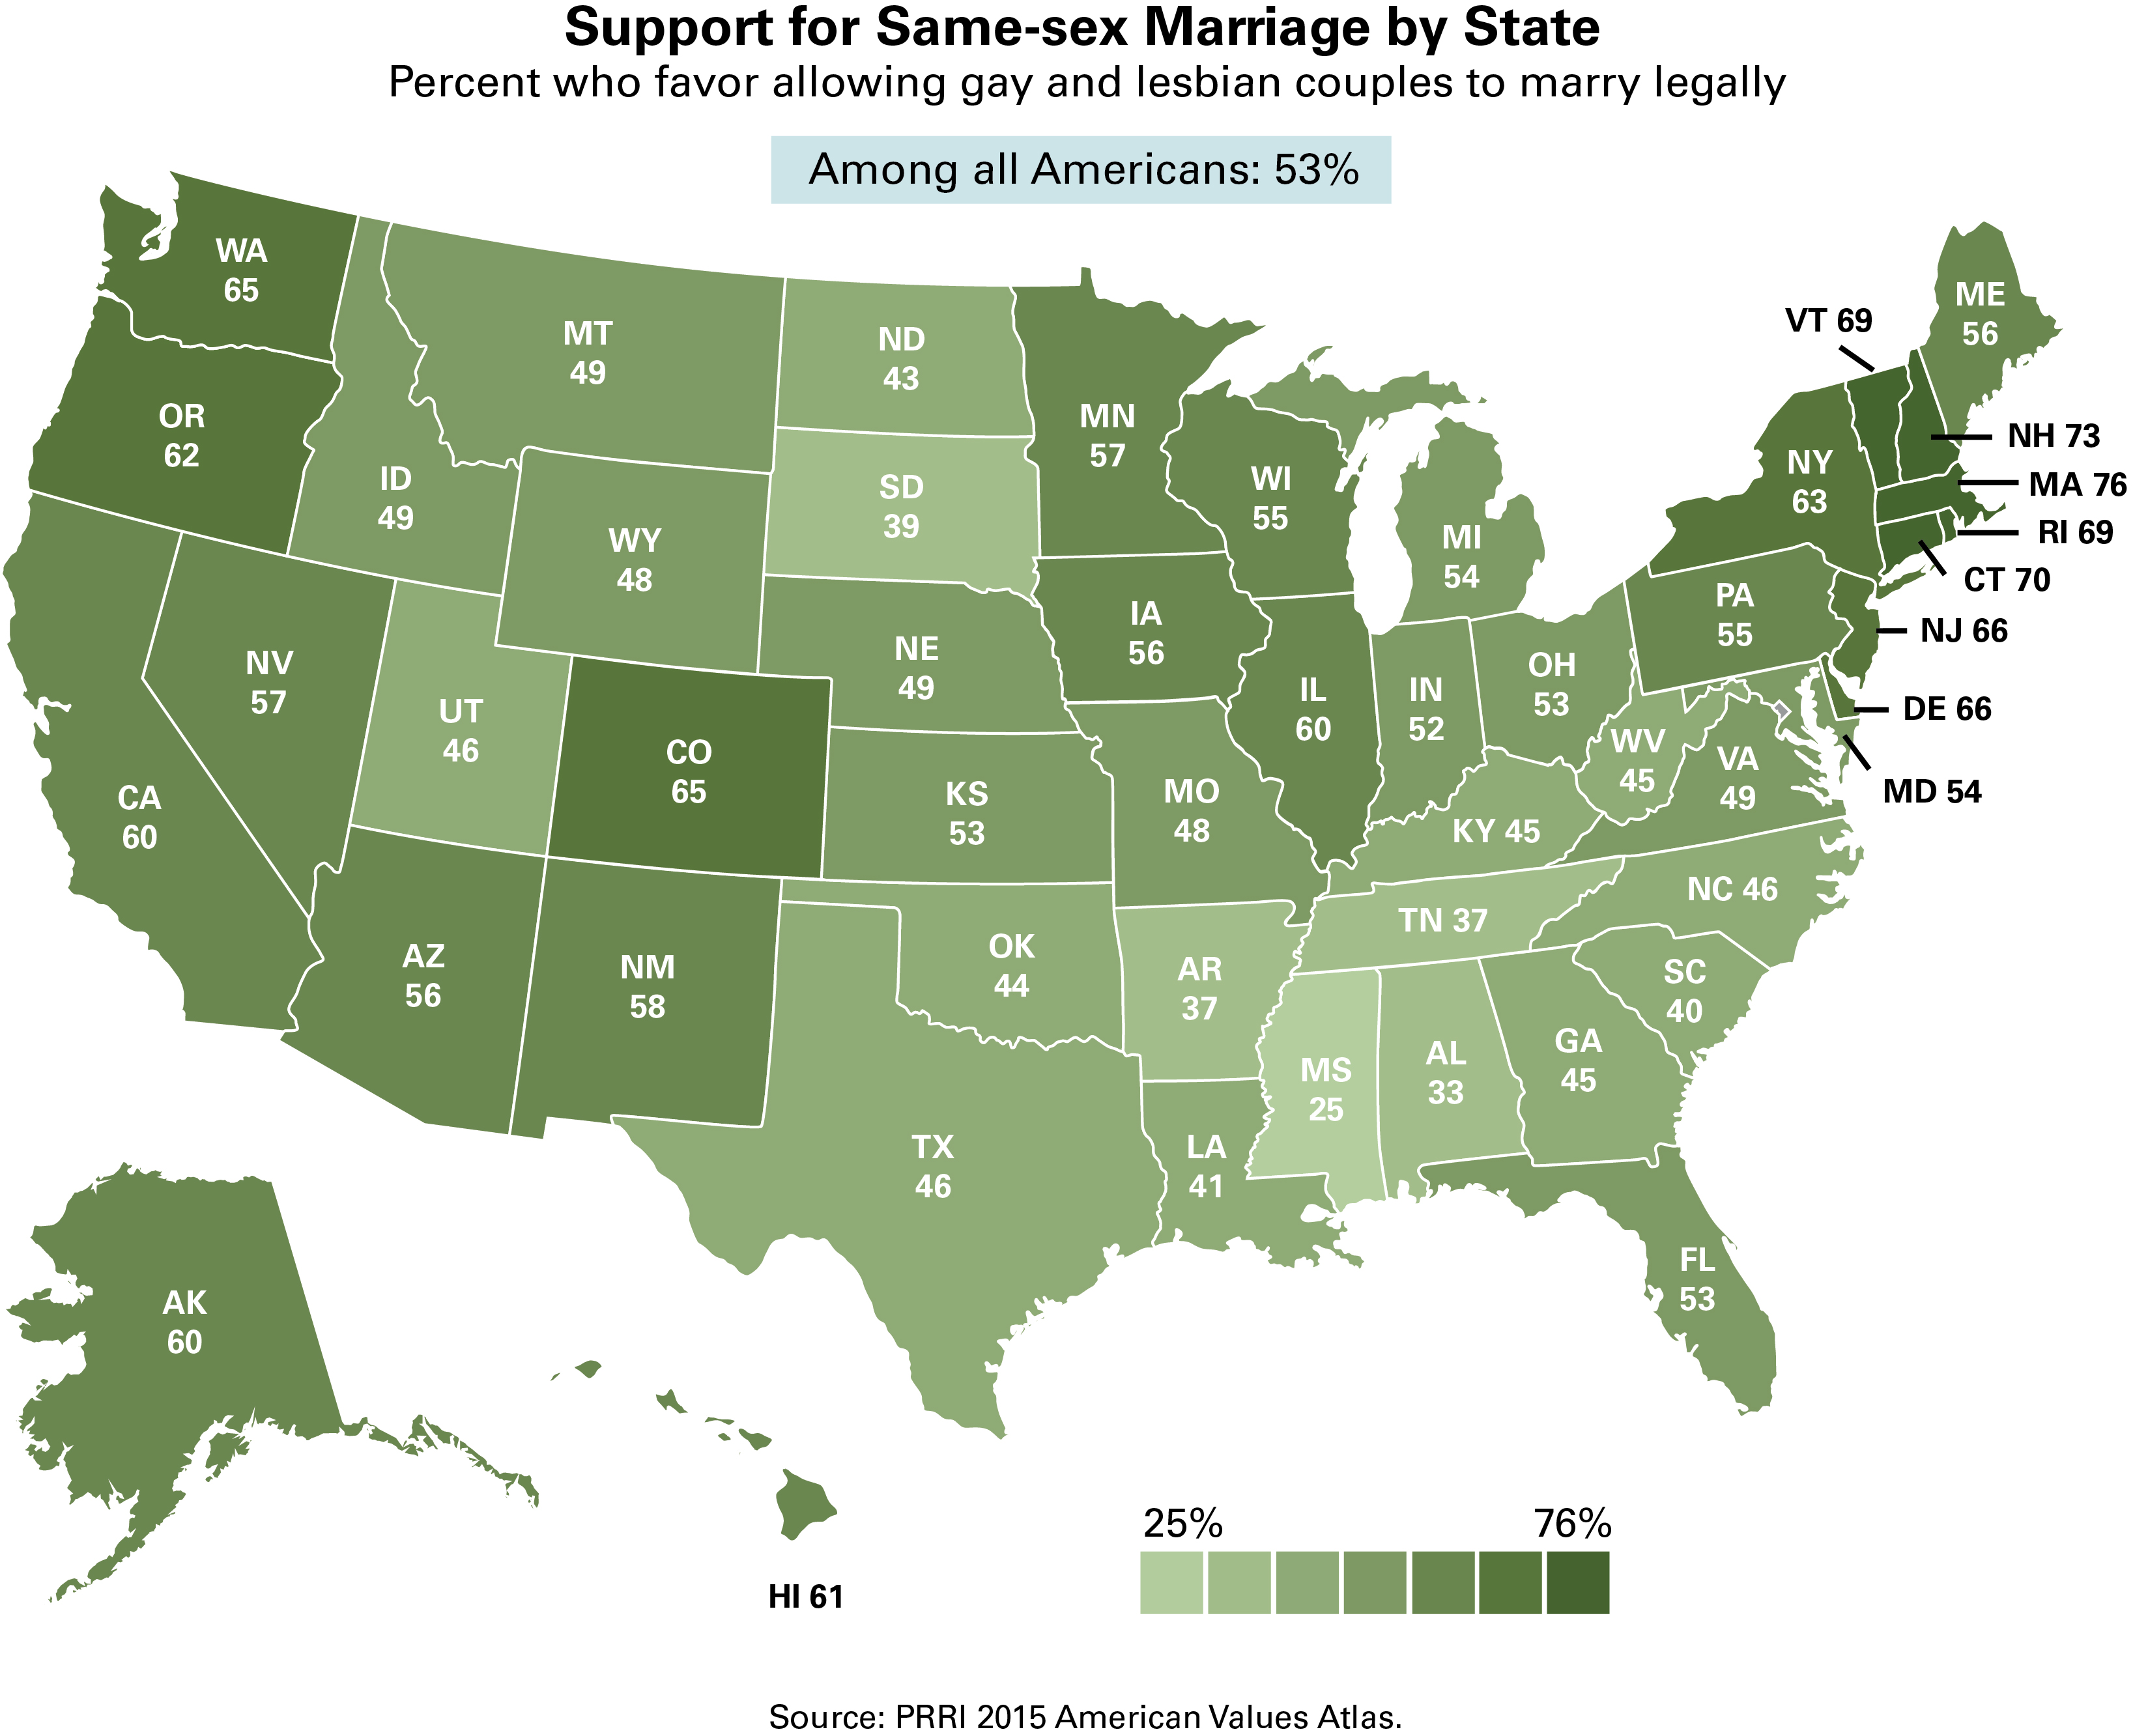
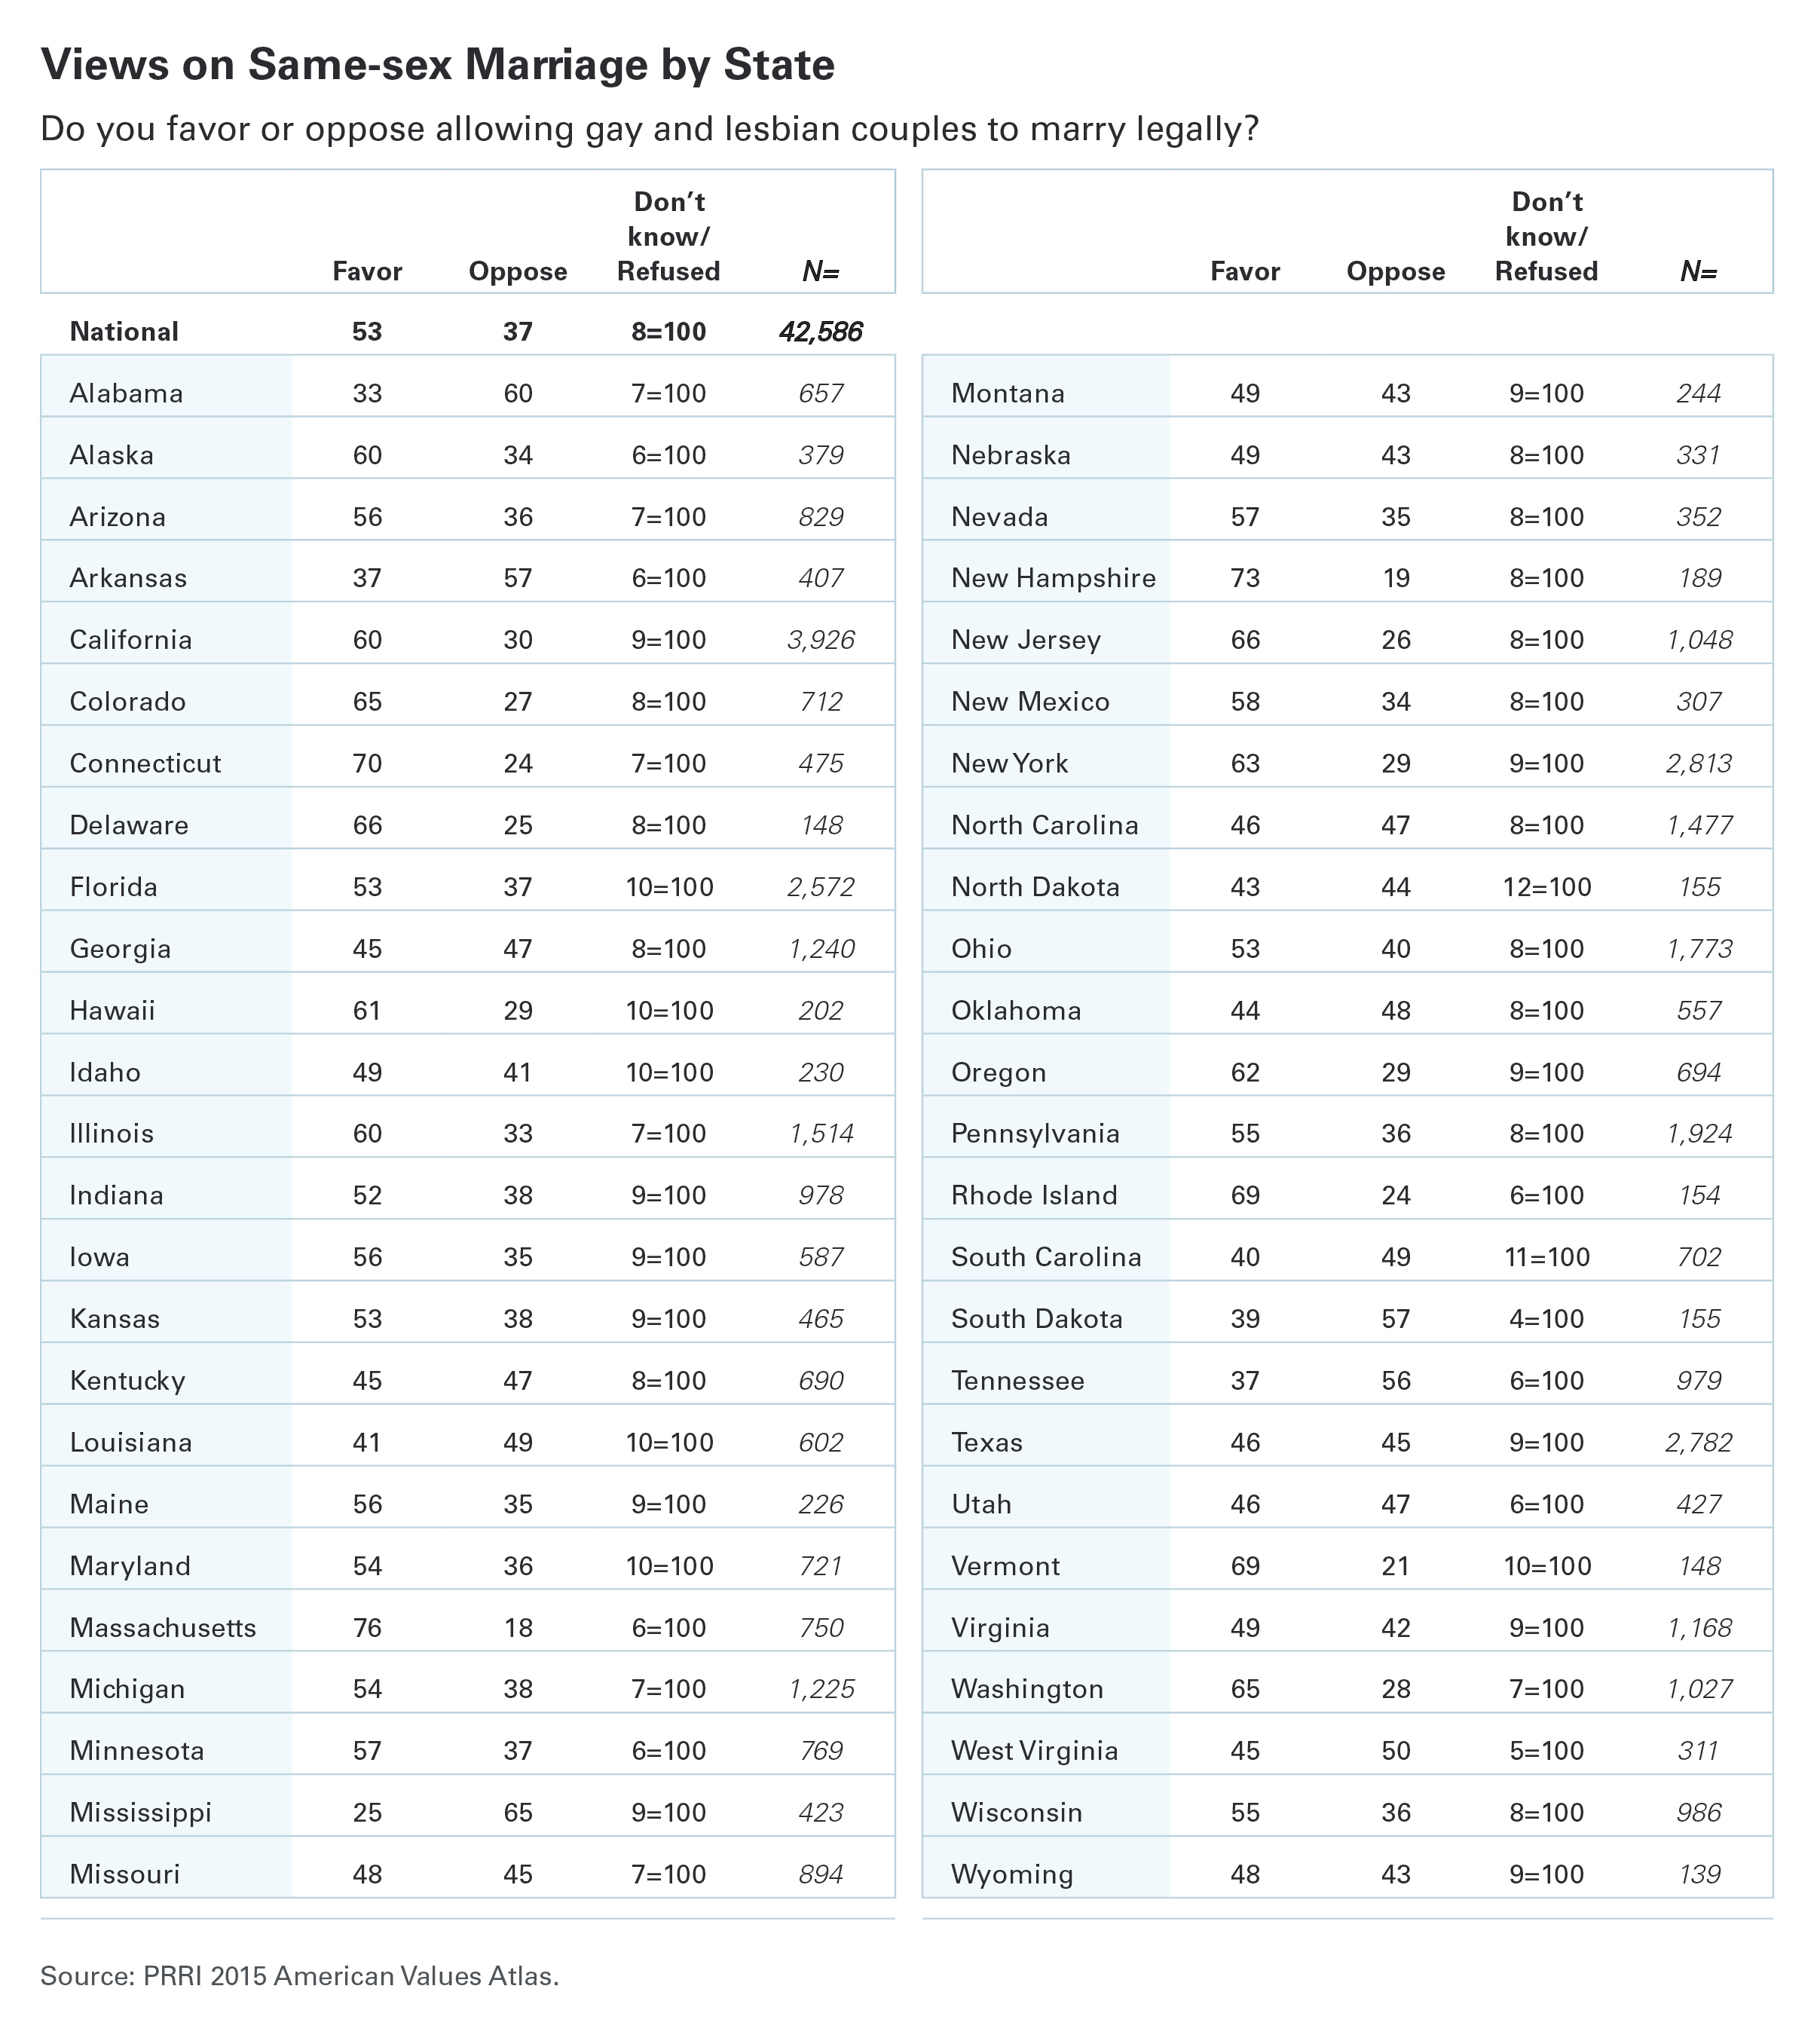
Unsurprisingly, the states with the highest support for same-sex marriage tend to be clustered in the Northeast, while the states with the lowest support can be found predominately in the South. Massachusetts—the first state in the nation to legalize same-sex marriage in 2004—registers the highest support for the policy today (76% favor). Support for same-sex marriage is robust across New England with approximately seven in ten residents of New Hampshire (73%), Connecticut (70%), Rhode Island (69%), and Vermont (69%) expressing support.
Notably, there are only five states in which a majority of residents oppose same-sex marriage. Support for same-sex marriage is lowest in the Deep South: just one-quarter (25%) of Mississippi residents and one-third (33%) of Alabama residents favor same-sex marriage. Sixty-five percent of Mississippi residents and 60% of Alabama residents oppose same-sex marriage. Opposition to same-sex marriage also reaches a majority in three other states: Arkansas (57%), South Dakota (57%), and Tennessee (56%).
II. Widespread Support For Laws Protecting Gay, Lesbian, and Transgender People From Discrimination
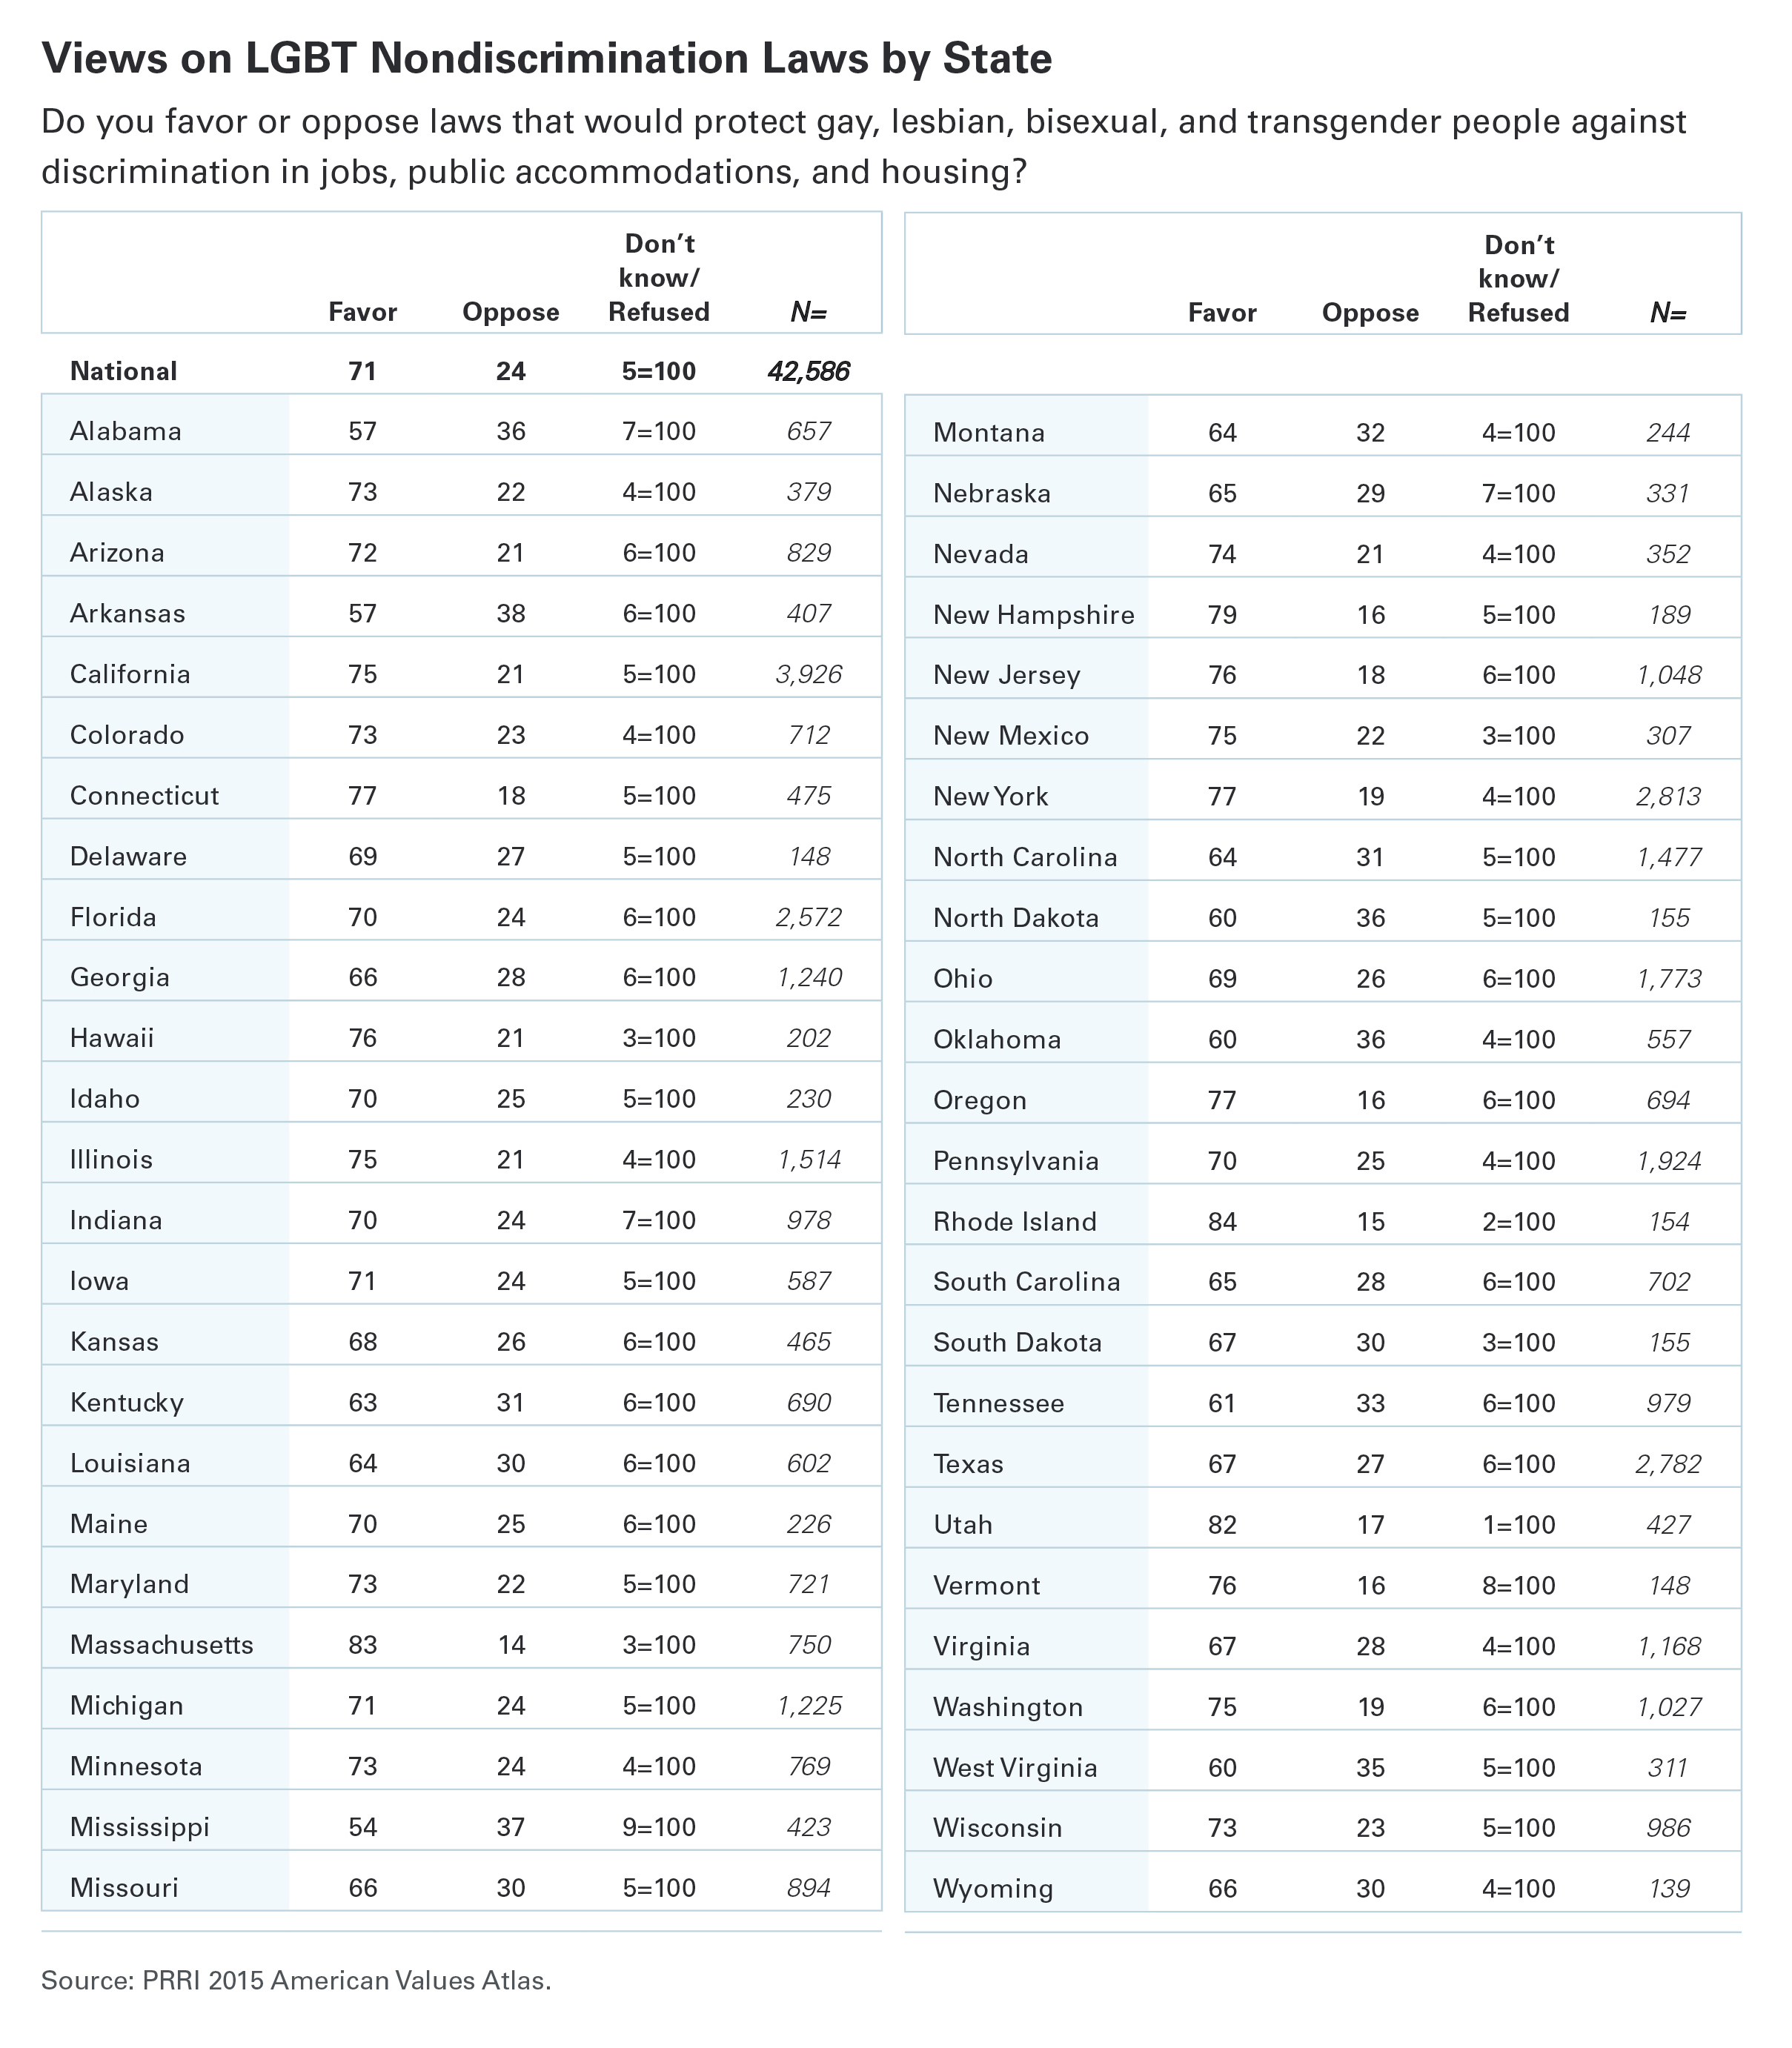
There is widespread support for laws that would protect gay, lesbian, bisexual, and transgender people from discrimination in jobs, housing, and public accommodations. Nationally, roughly seven in ten (71%) Americans support such laws, while roughly one-quarter (24%) oppose them. Majorities of all major demographic, religious, and political groups favor nondiscrimination laws for LGBT people.
LGBT Nondiscrimination Laws by Age, Race, and Ethnicity
Despite the strong support for nondiscrimination laws for LGBT people, there is some variation in the strength of support. Eight in ten (80%) young Americans (age 18 to 29) favor these nondiscrimination laws, compared to 61% of seniors (age 65 and older). Roughly three-quarters of Asian-Pacific Islanders (76%) and Hispanic Americans (74%) and about seven in ten (71%) white Americans support nondiscrimination laws, as do approximately two-thirds (65%) of black Americans.

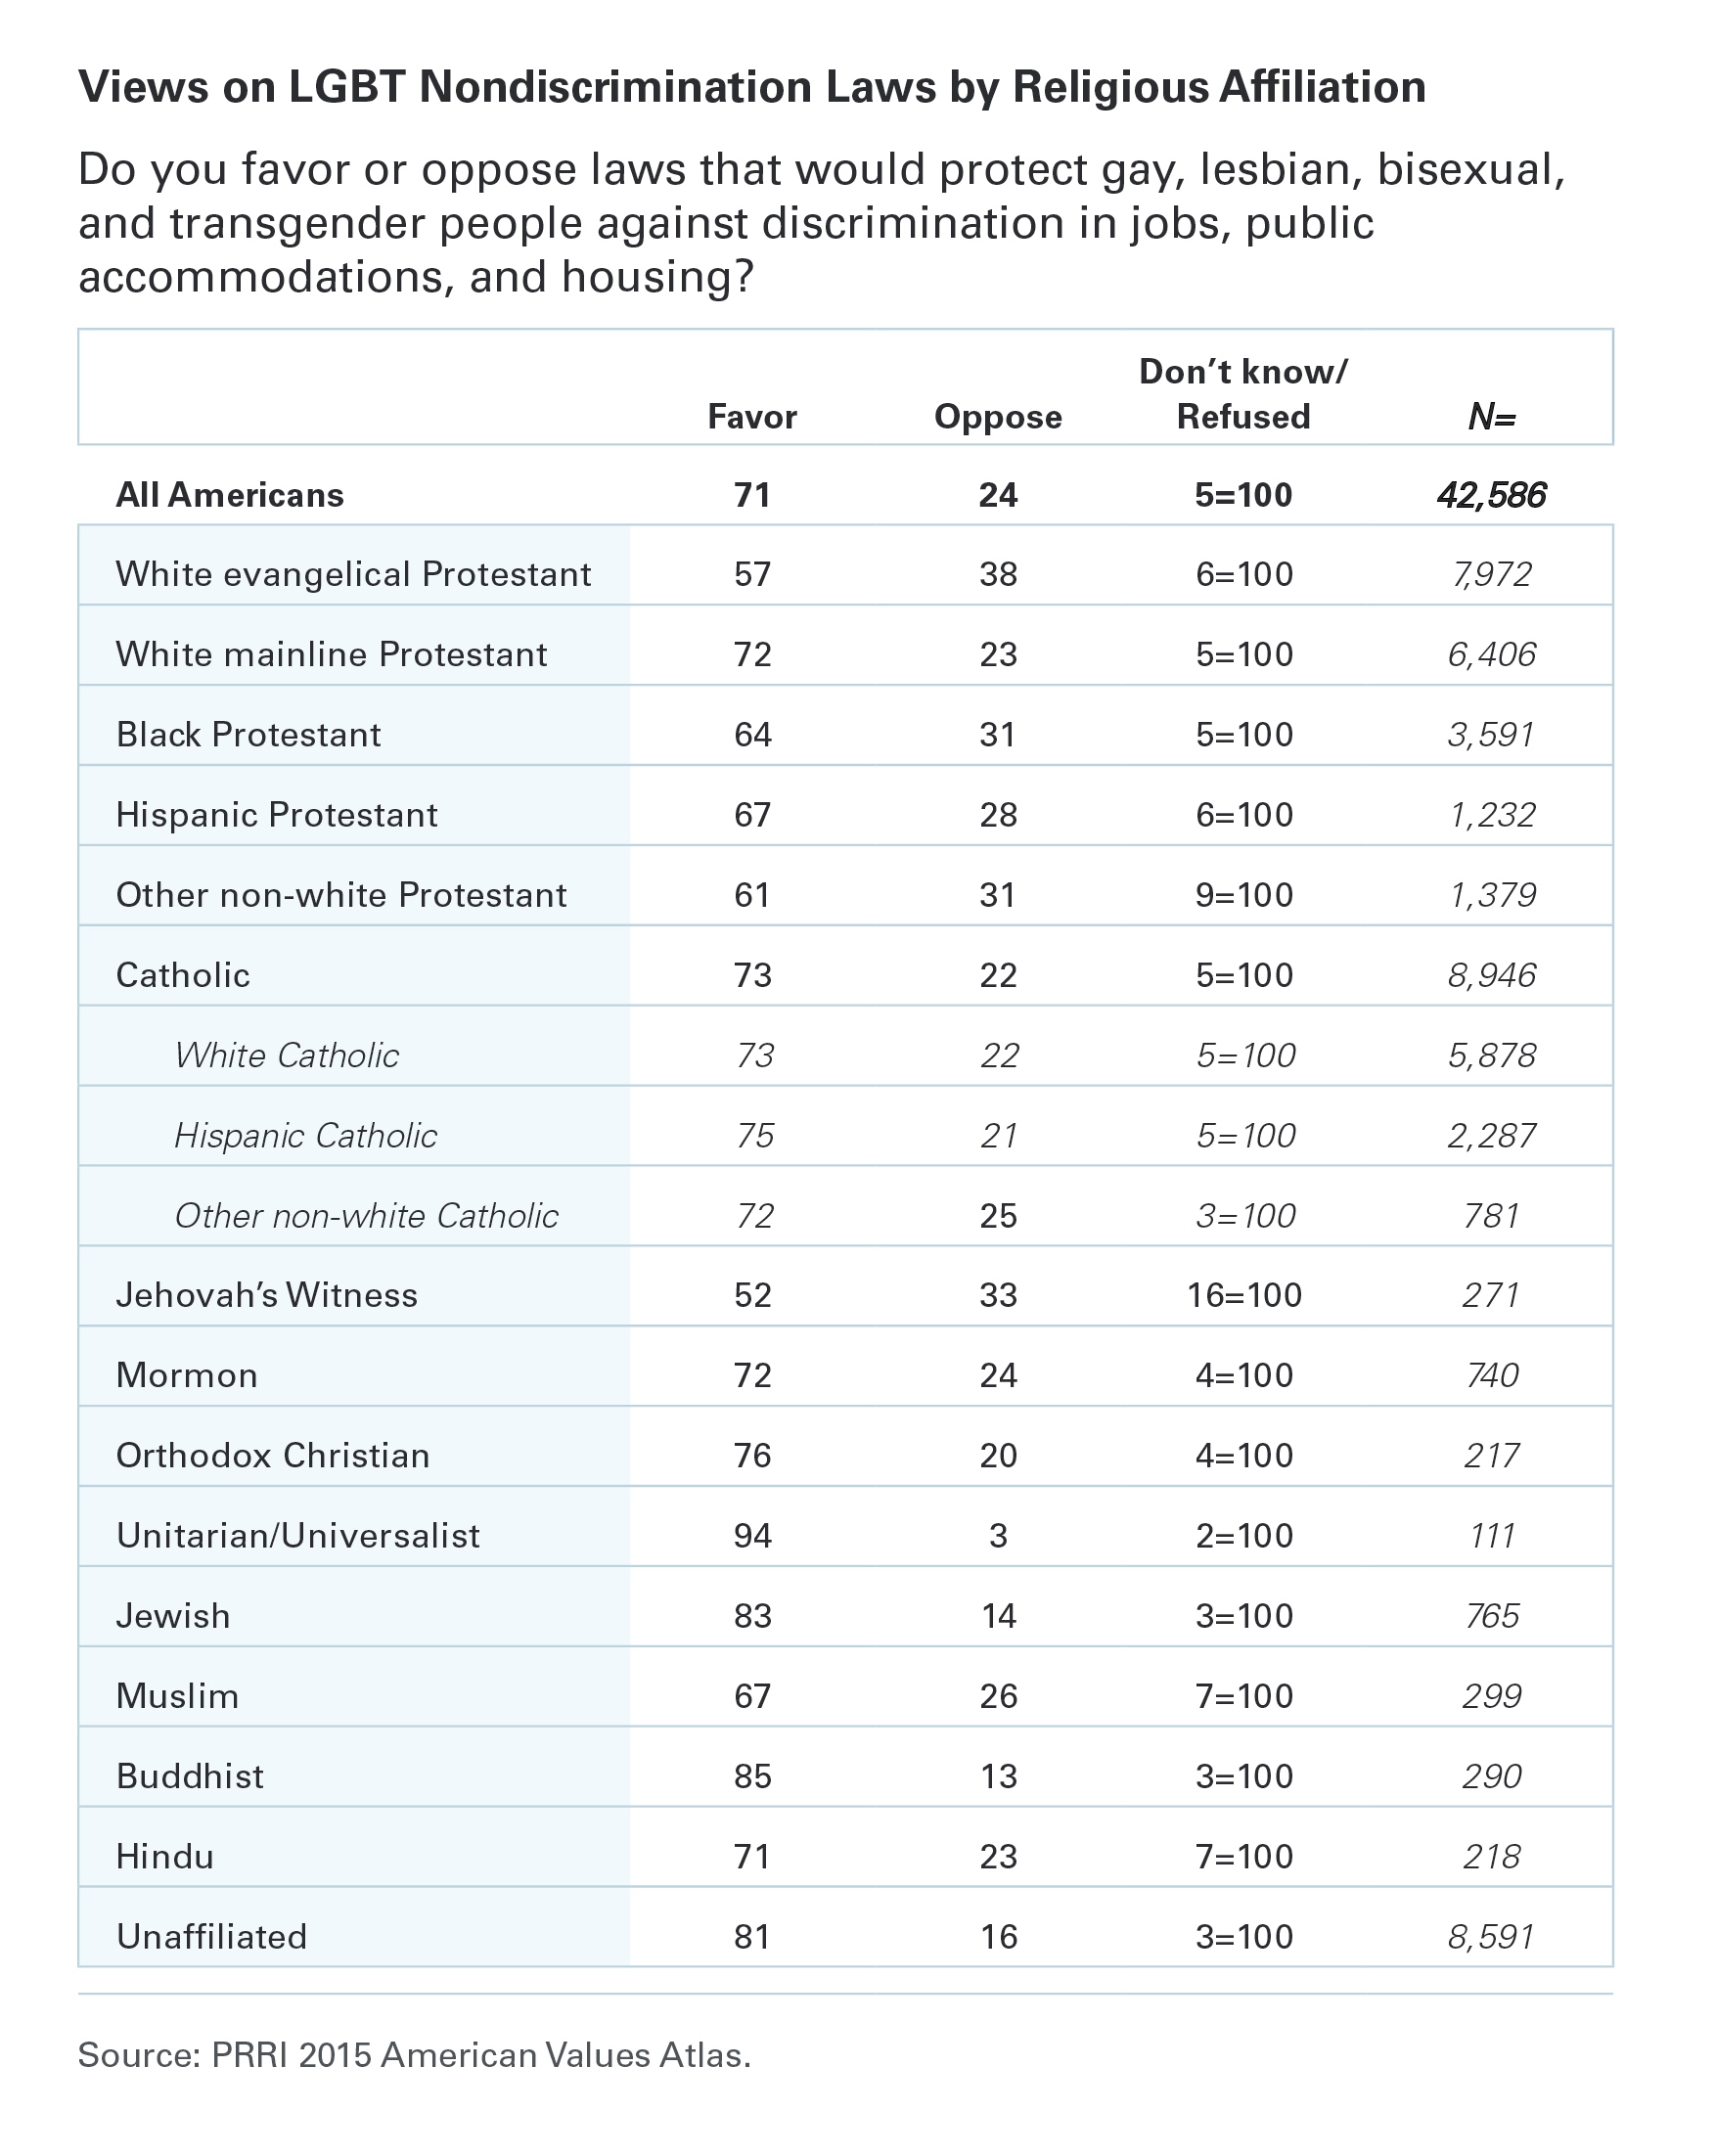
LGBT Nondiscrimination Laws by Religious and Political Affiliation
Majorities of all major religious groups favor passing nondiscrimination laws for LGBT people, although the degree of support varies. The religiously unaffiliated (81%) and members of many non-Christian religions, including Buddhists (85%) and Jewish Americans (83%), are the most supportive of these laws. A majority of white evangelical Protestants (57%) and Jehovah’s Witnesses (52%) also support nondiscrimination laws for LGBT people. However, a substantial number of white evangelical Protestants (38%) and Jehovah’s Witnesses (33%) oppose this policy. And while Mormons strongly oppose same-sex marriage, their support for nondiscrimination laws (72%) mirrors support among Americans overall.
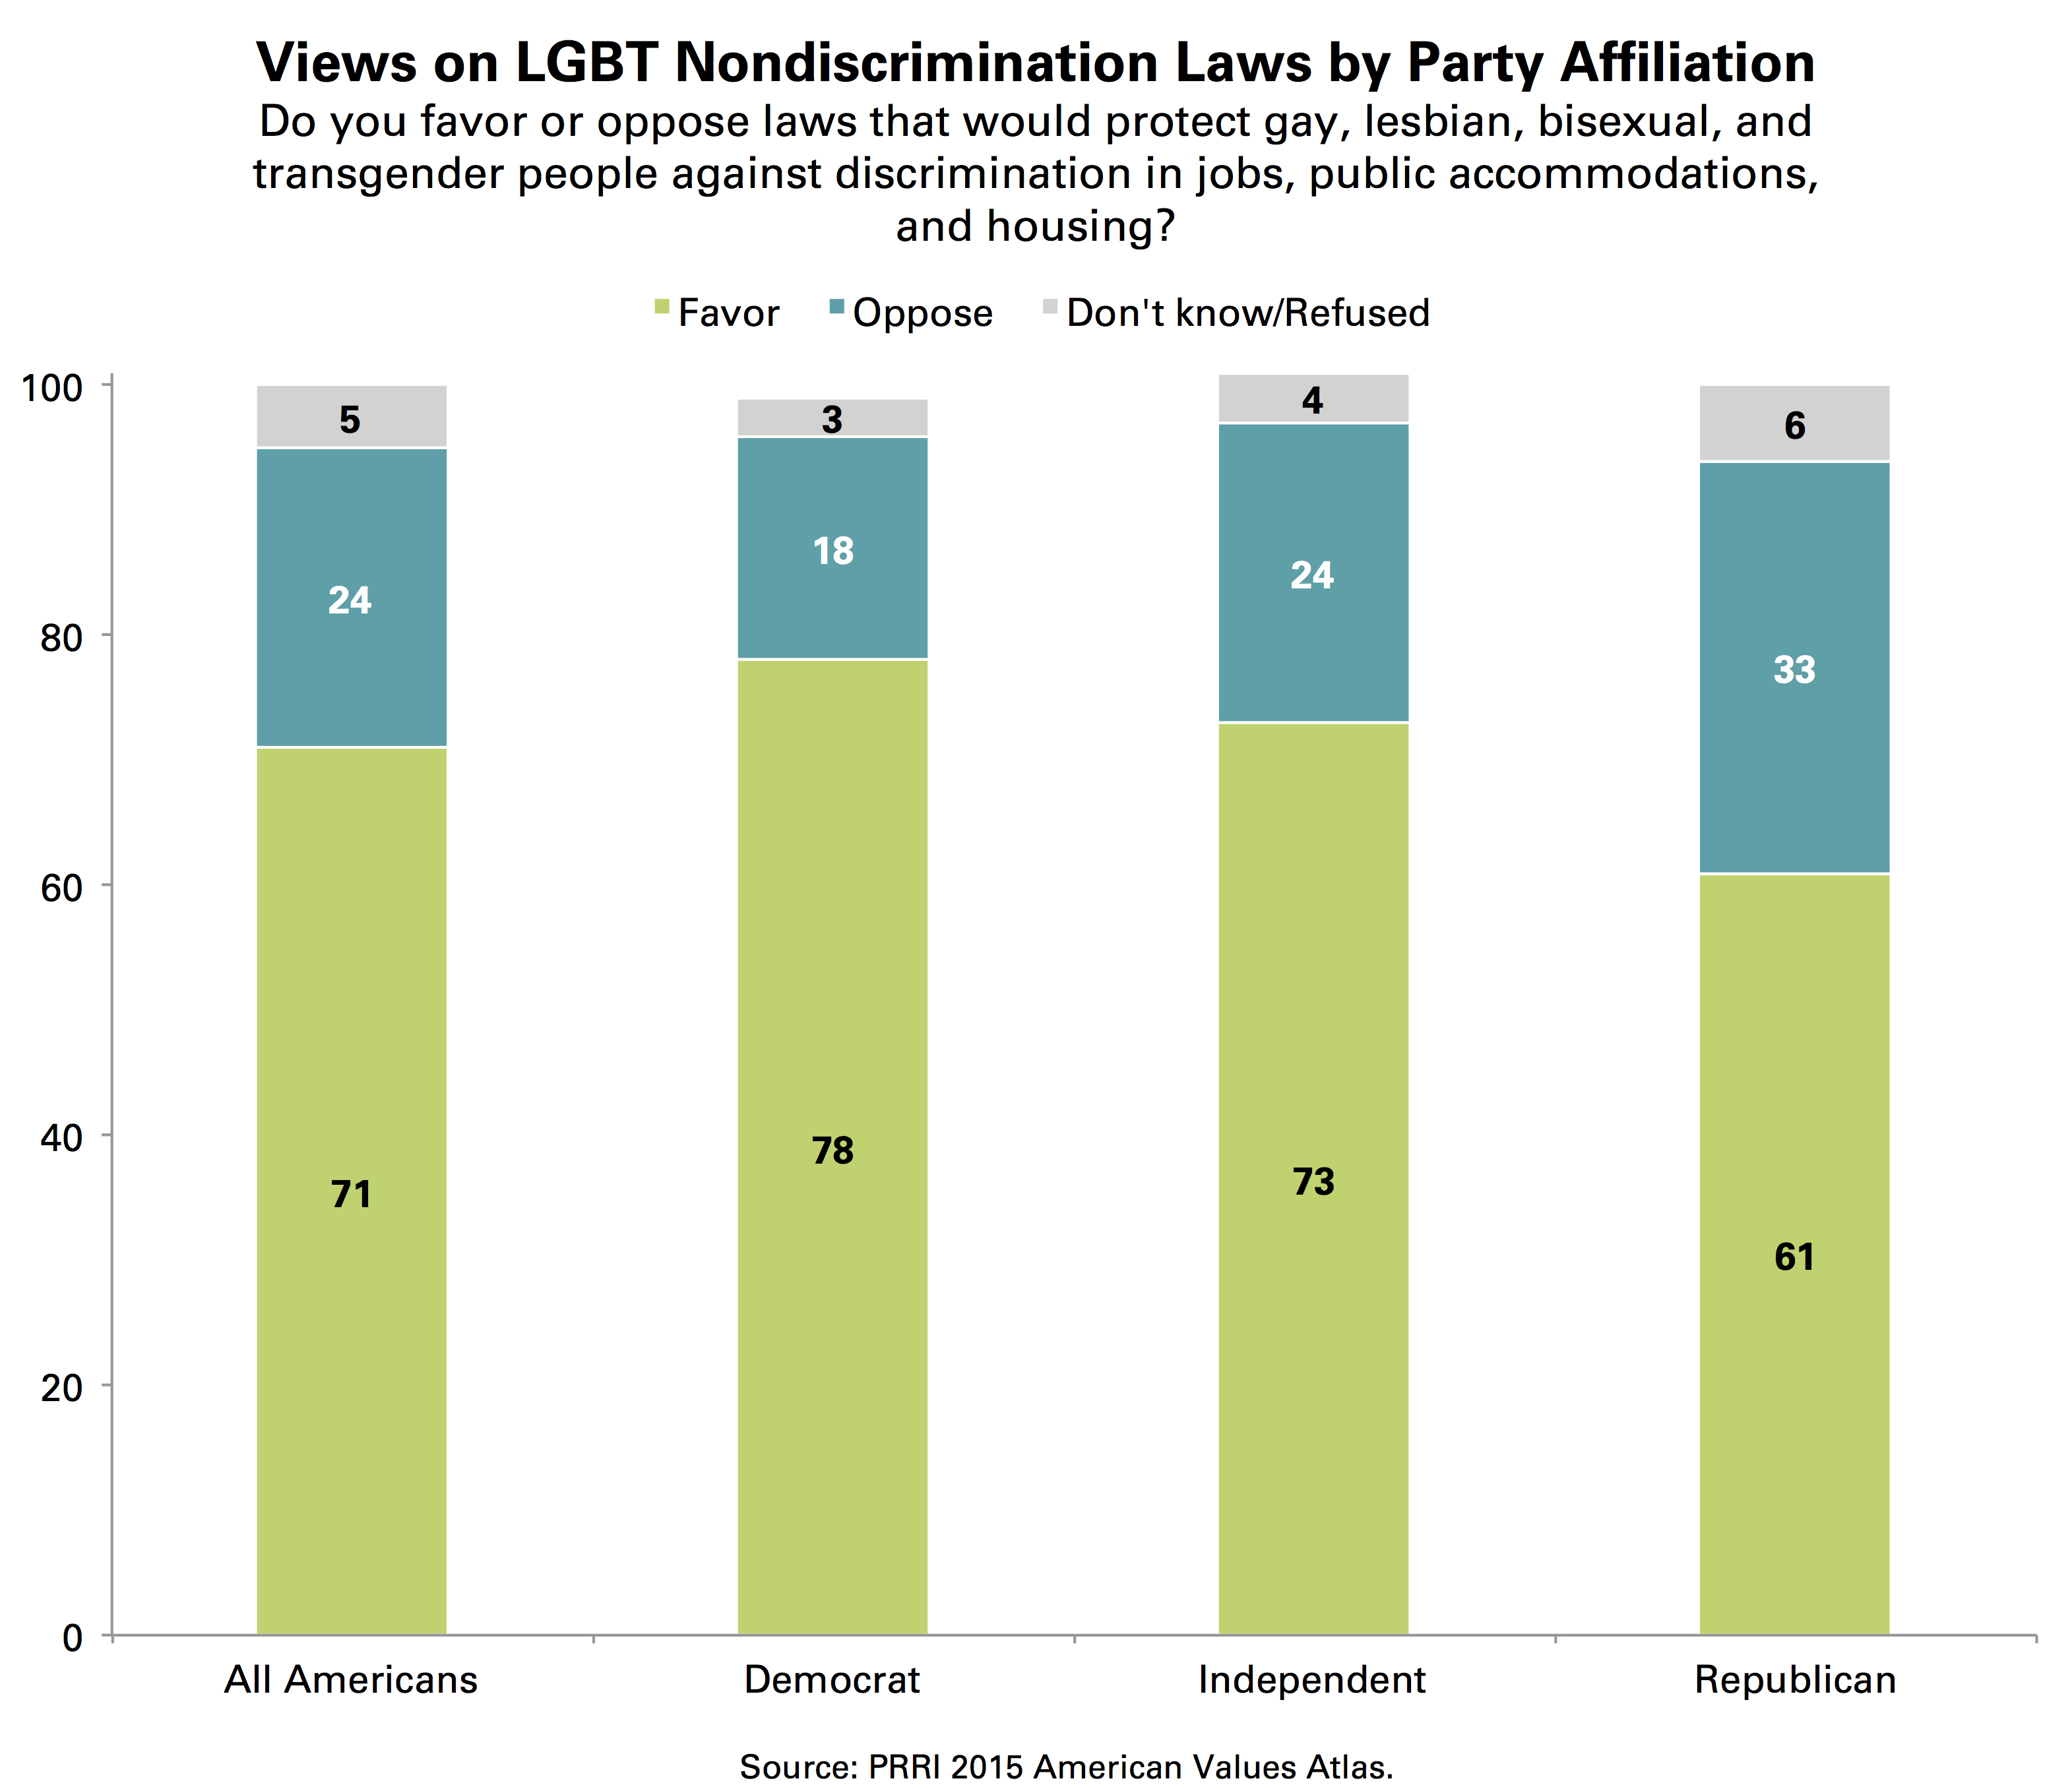
There is bipartisan support for nondiscrimination laws for LGBT people, with more than six in ten Republicans (61%), and more than seven in ten independents (73%) and Democrats (78%), in favor of such laws.
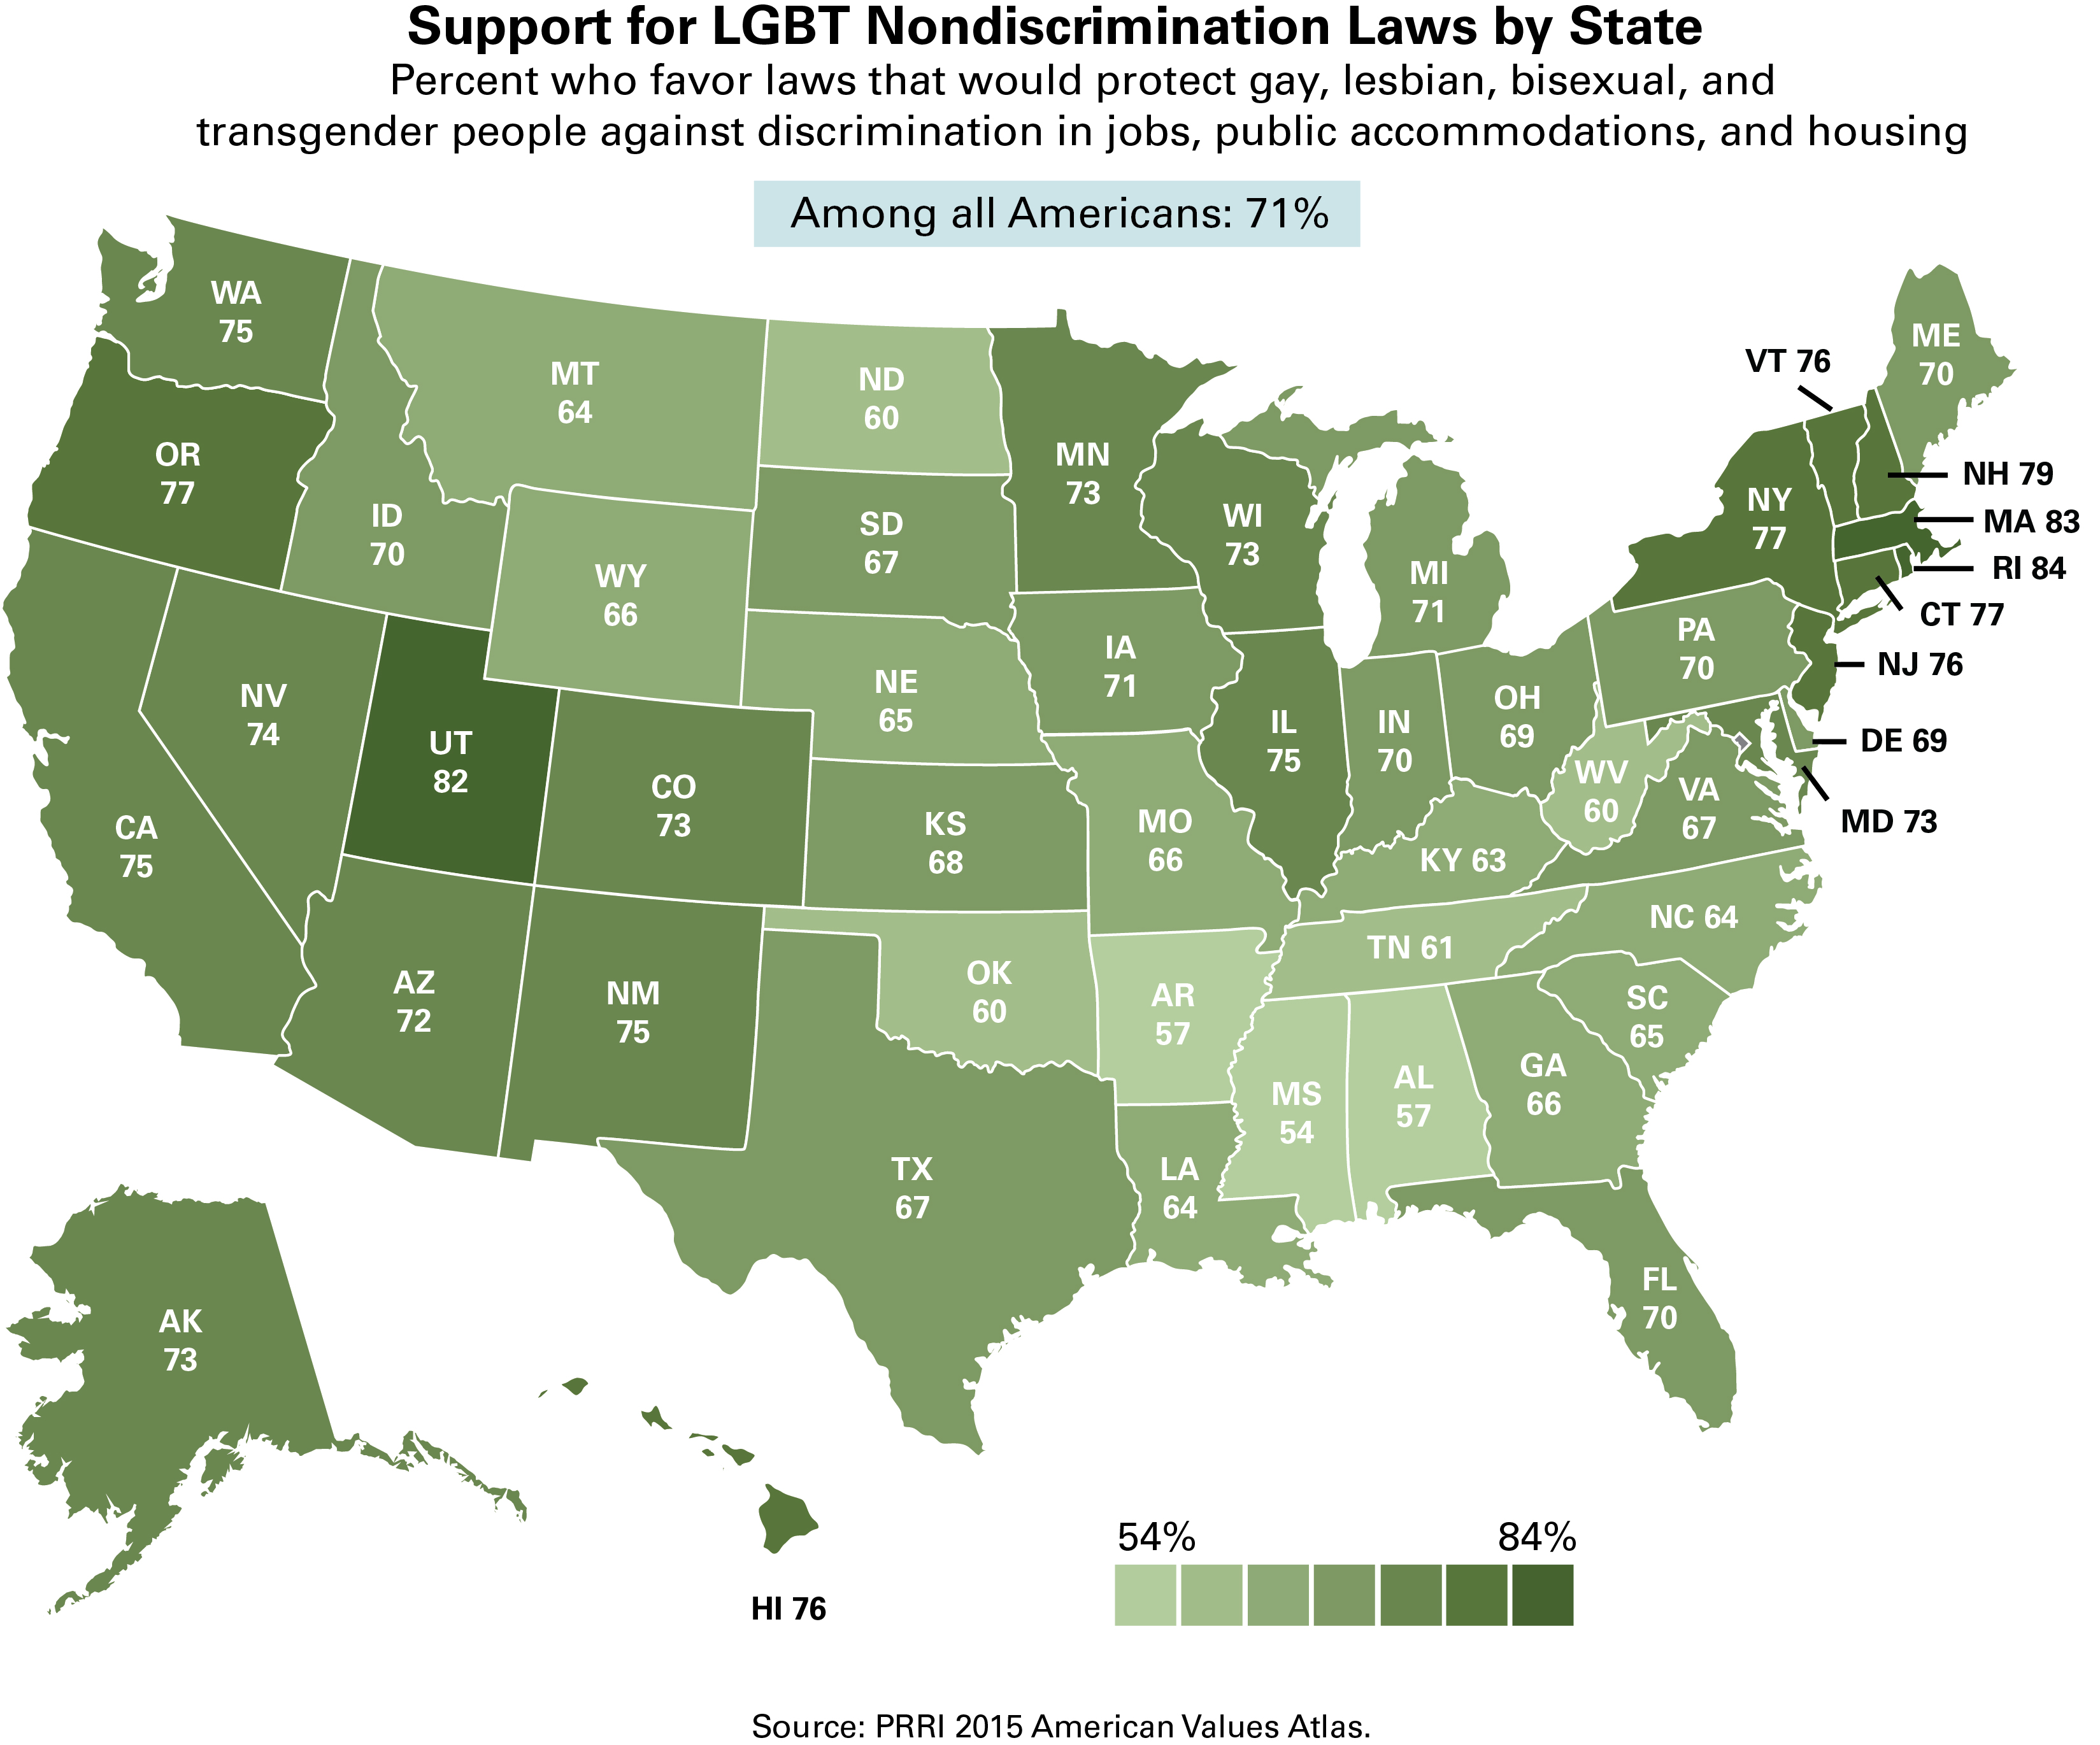
LGBT Nondiscrimination Laws by Geography
Majorities of Americans in every region and state express support for nondiscrimination laws, but there are modest differences in the degree of support around the country. Support is higher in the Northeast (76%) and West (75%), and lower in the South (66%) and Midwest (71%). Residents of New England states such as Rhode Island (84%) and Massachusetts (83%) are the most supportive of these laws, while residents of Deep South states, such as Mississippi (54%), Alabama (57%), and Arkansas (57%), are the least supportive.
Within metropolitan areas, Cincinnati, Ohio has the lowest levels of support for anti-discrimination laws (65%), while residents of San Francisco (81%) and Boston (83%) are the most supportive.
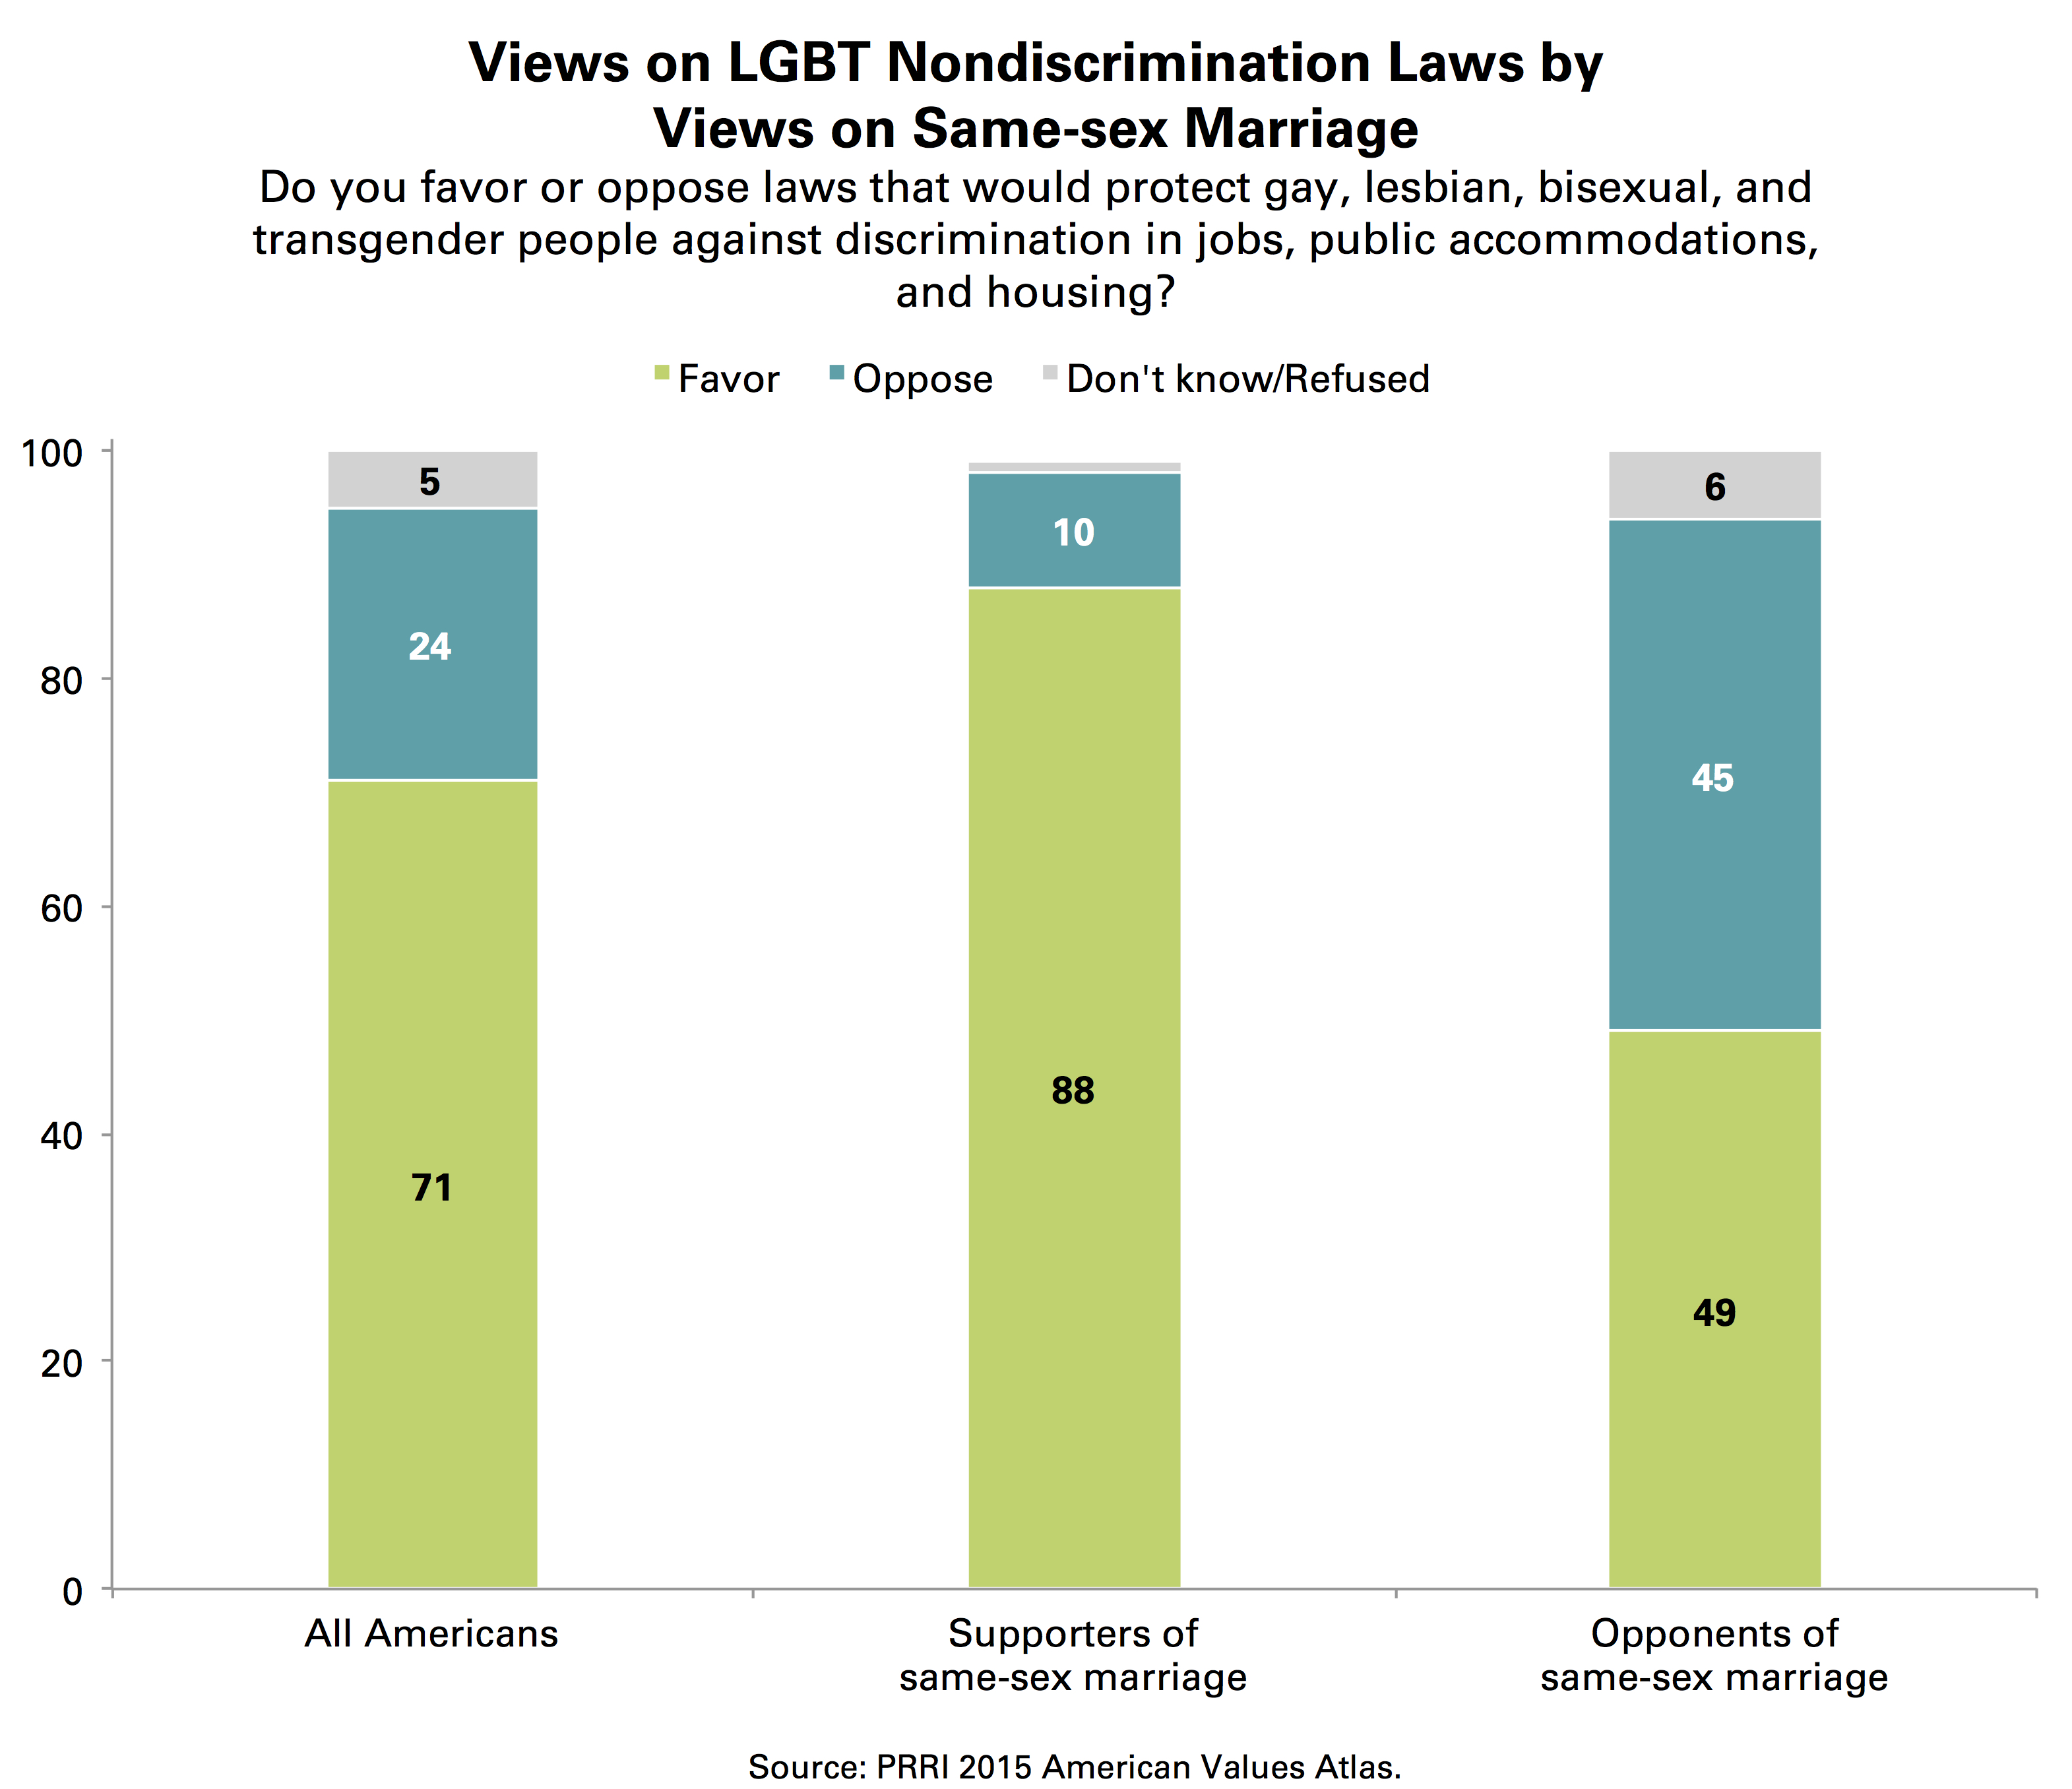
The Complex Relationship Between Support for Same-sex Marriage and Nondiscrimination Laws
Not surprisingly, nearly nine in ten (88%) Americans who support same-sex marriage also support nondiscrimination laws that would protect LGBT people. Notably, same-sex marriage opponents are not uniformly opposed to nondiscrimination laws. Americans who oppose same-sex marriage are divided over nondiscrimination laws for LGBT people (49% favor, 45% oppose).
Similarly, nearly three-quarters (74%) of Americans who reside in states where a majority of residents support same-sex marriage also support nondiscrimination laws for LGBT people. But notably, even among residents of states where a majority are opposed to same-sex marriage, nearly six in ten (58%) nonetheless favor nondiscrimination laws.
III. Most Americans Oppose Allowing Businesses to Refuse Service to LGBT People Based on Religious Beliefs
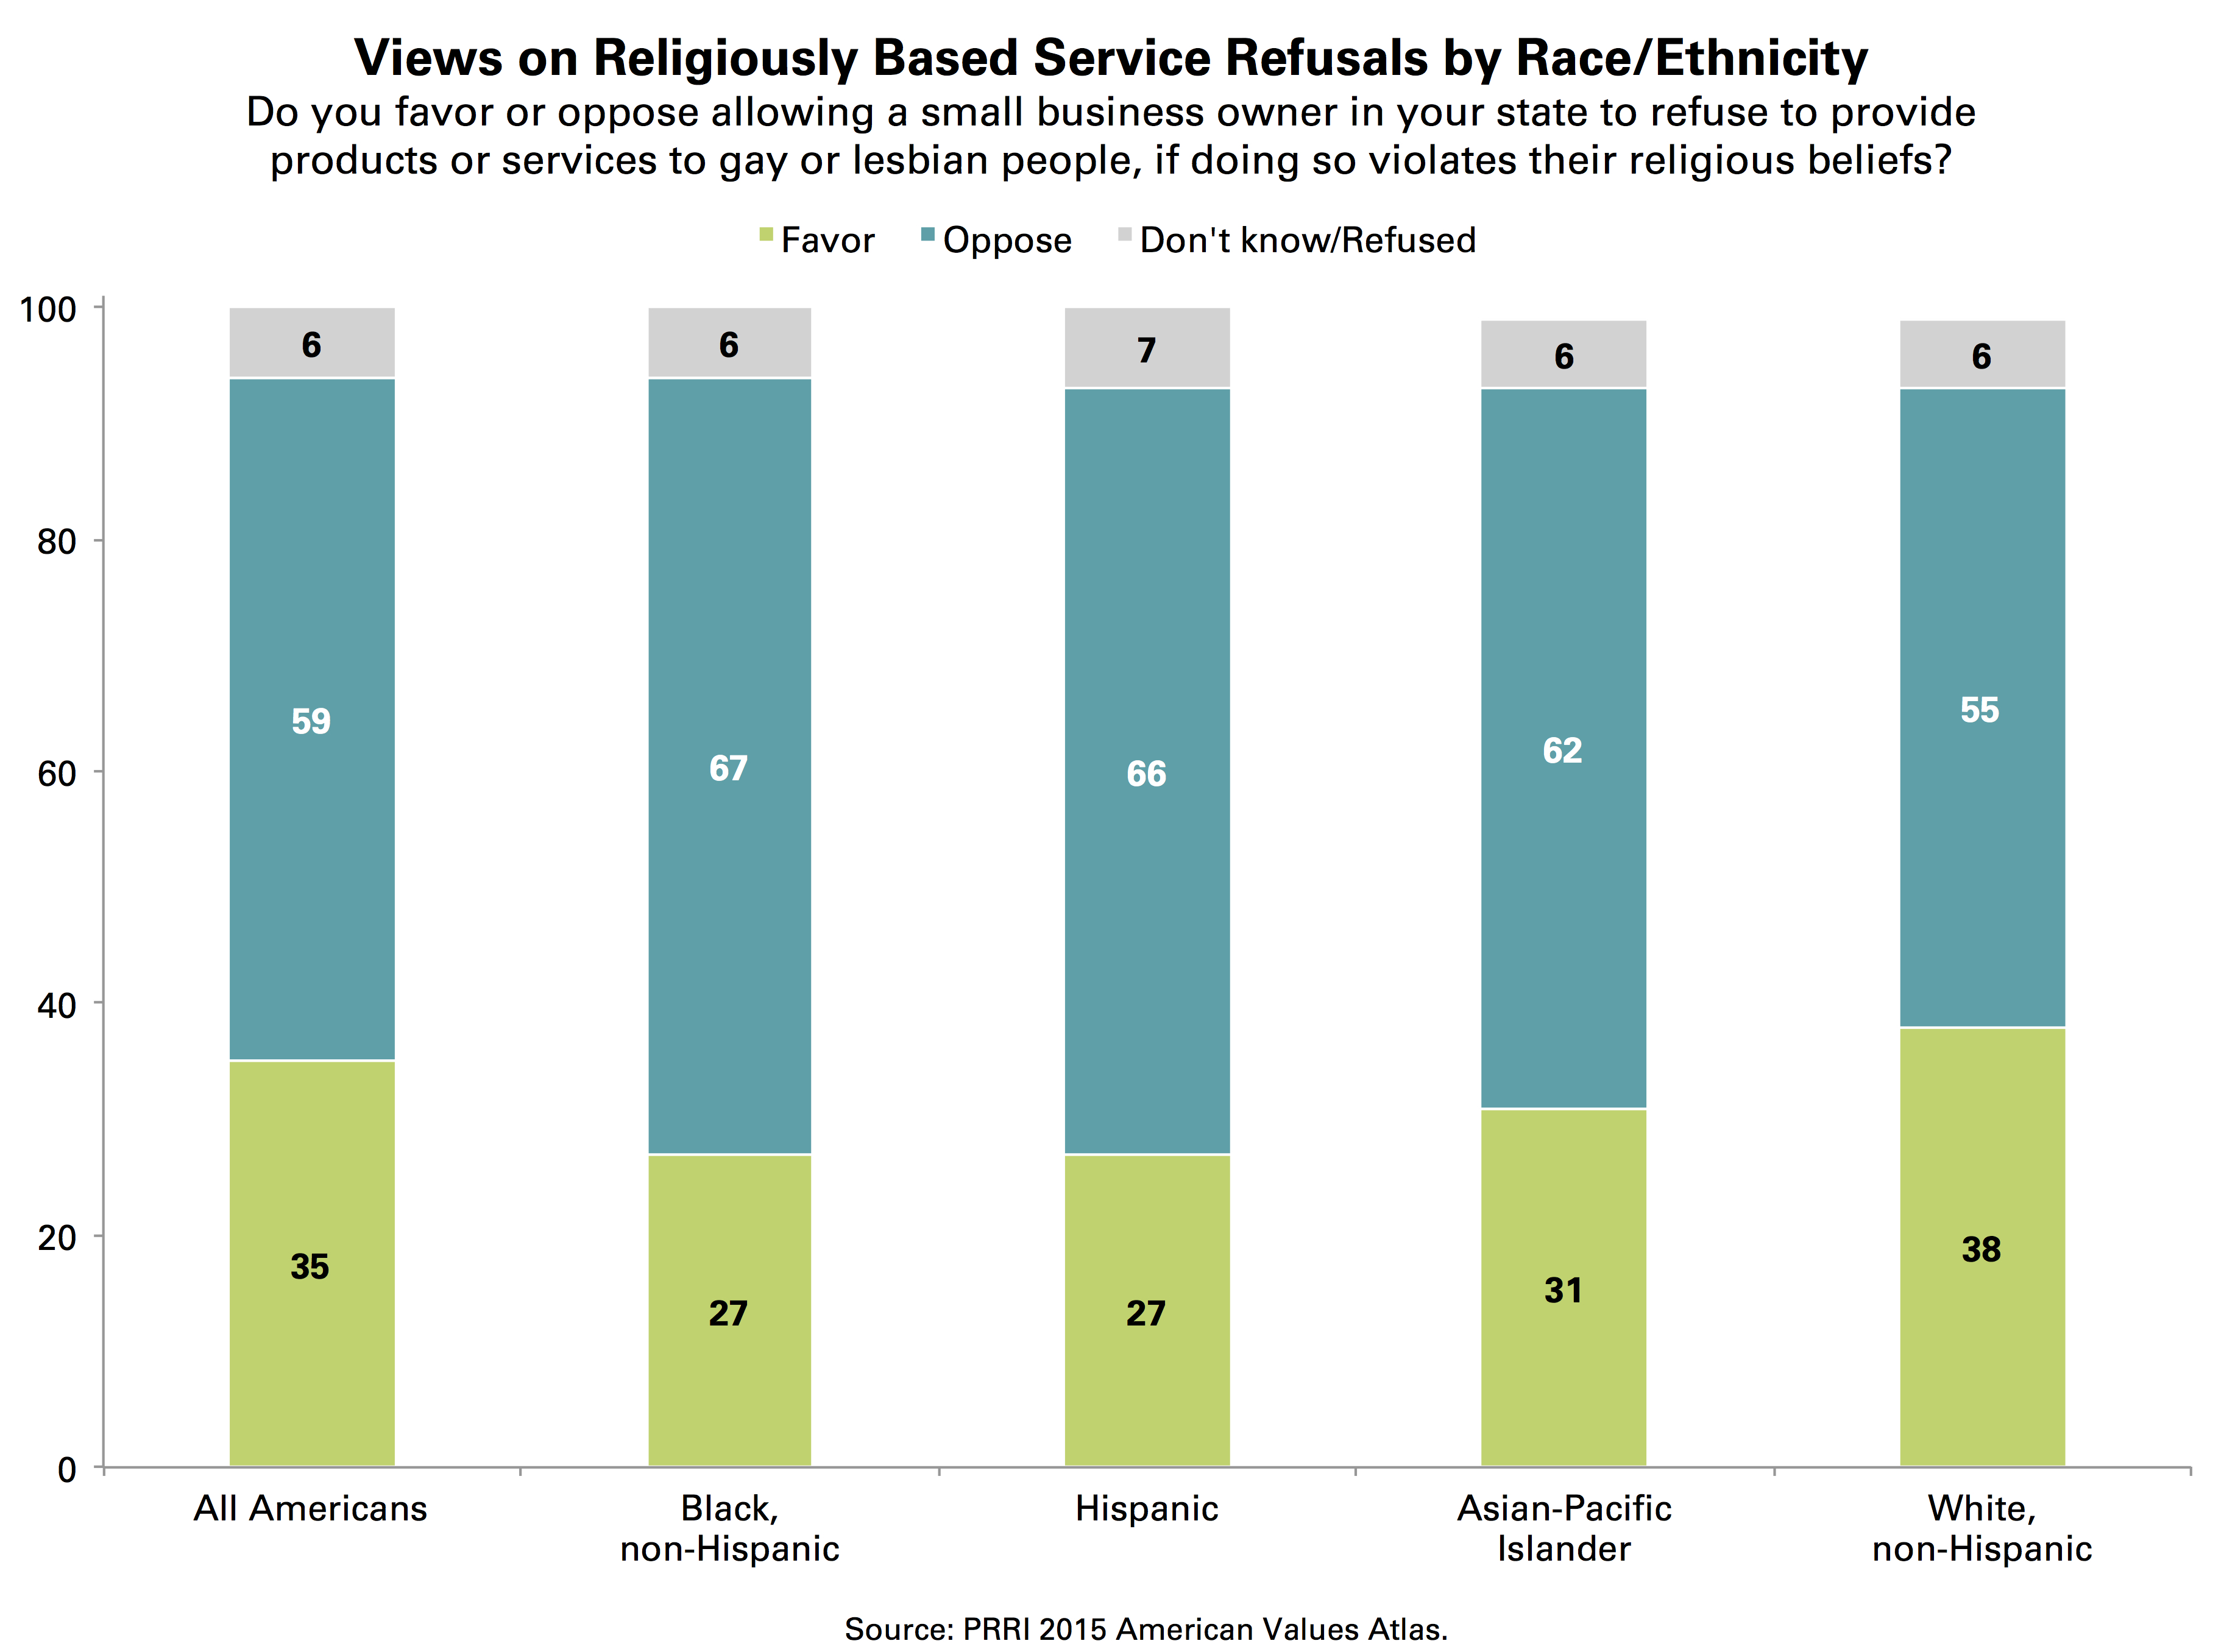
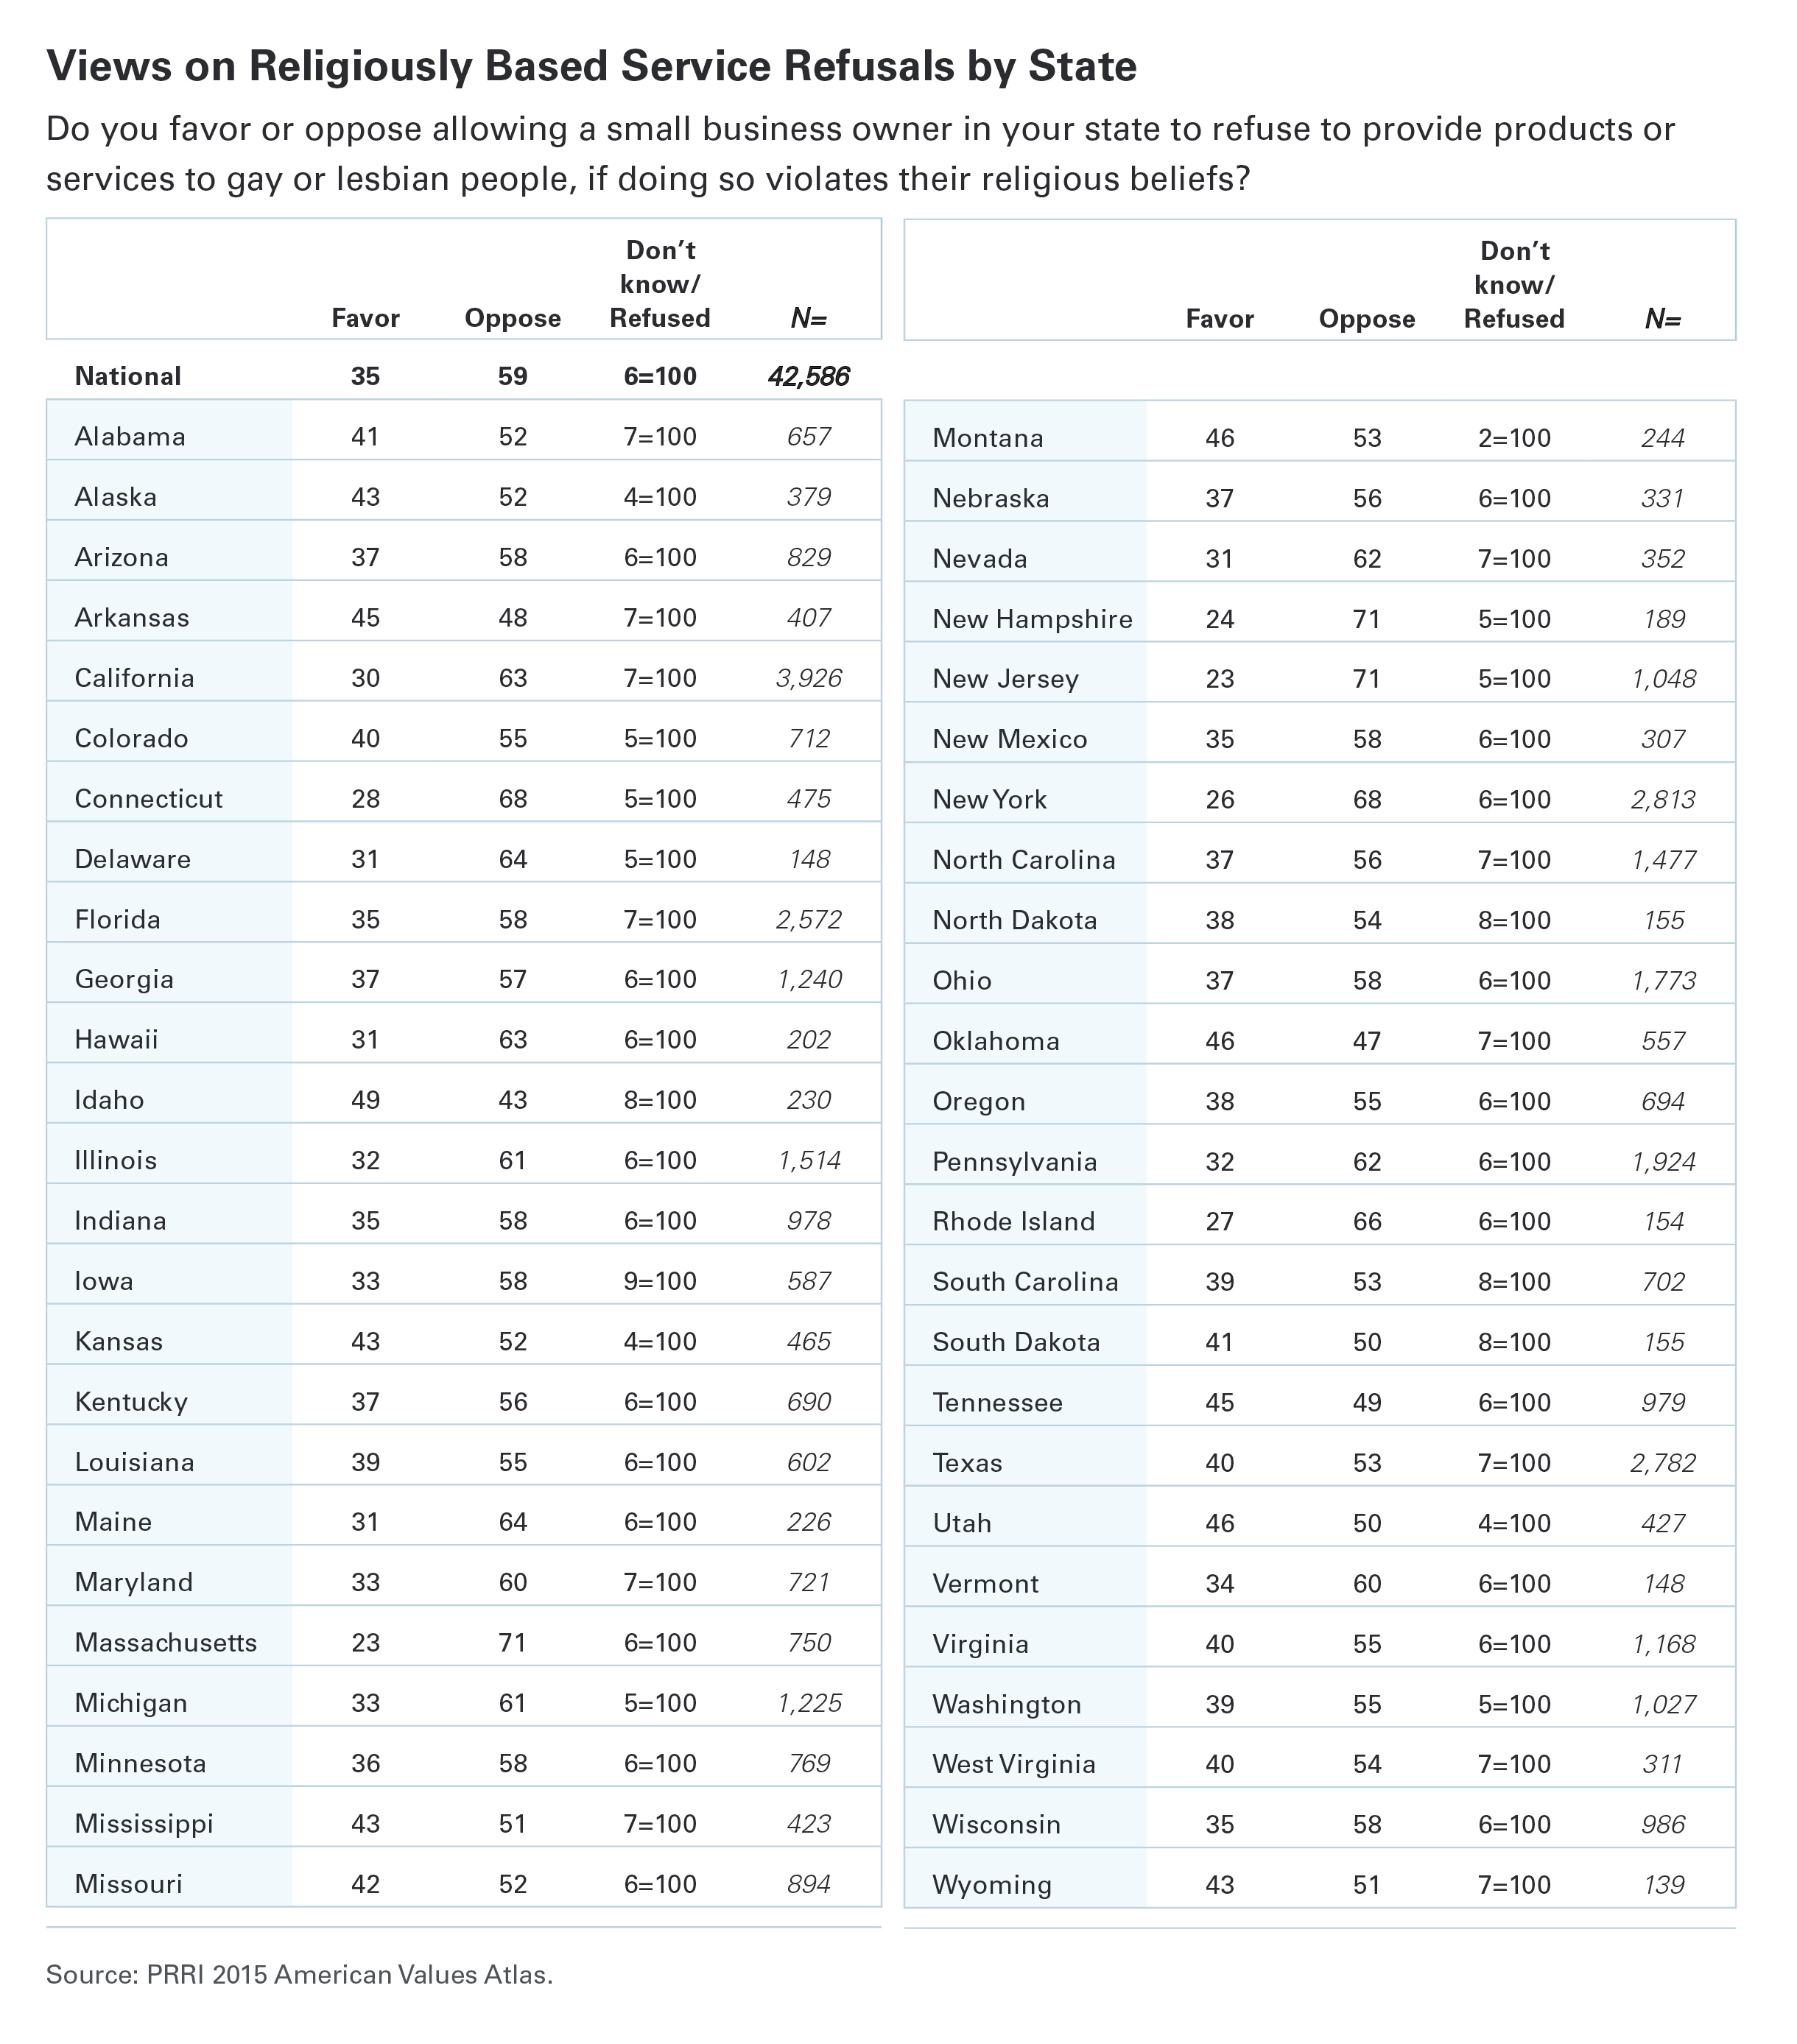
Americans are broadly opposed to allowing small business owners to refuse to provide products or services to gay or lesbian people if doing so violates their religious beliefs. Overall, nearly six in ten (59%) Americans oppose allowing these religiously based service refusals, while 35% favor them.
Service Refusals by Age
Although a majority of Americans from every generation oppose allowing a small business owner to refuse to provide products or services to gay or lesbian people on religious grounds, the degree of opposition varies somewhat by age. Young adults (age 18 to 29) express the highest level of opposition (67%), while seniors (age 65 and older) are somewhat more divided: a majority (53%) oppose allowing small business owners to deny service to gay and lesbian people on religious grounds, while approximately four in ten (39%) favor such a policy.
Service Refusals by Race and Ethnicity
The racial and ethnic division in views about service refusals of LGBT people differs markedly from views on same-sex marriage. Non-white Americans are more likely than their white counterparts to express opposition to religiously based service refusals, though majorities of every racial and ethnic group oppose such refusals. Black (67%) and Hispanic (66%) Americans express the most opposition to allowing small business owners to deny products or services to gay or lesbian people if doing so violates their religious beliefs, followed by Asian-Pacific Islander Americans (62%). A majority (55%) of white Americans also oppose allowing service refusals based on religious beliefs, while approximately four in ten (38%) white Americans favor such a policy.
Service Refusals by Religious Affiliation
Most religious traditions express opposition to allowing small business owners to deny service to gay or lesbian customers on religious grounds, with opposition highest among non-Christian religious groups and the religiously unaffiliated. More than seven in ten Unitarian Universalists (83%), Jewish Americans (72%), and unaffiliated Americans (71%) oppose allowing religiously based service refusals of gay or lesbian people, as do approximately two-thirds of Hispanic Catholics (68%), Buddhists (68%), black Protestants (67%), Orthodox Christians (66%), Muslims (65%), and Hindus (64%). Majorities of Hispanic Protestants (58%), white Catholics (58%), and white mainline Protestants (56%) also oppose religiously based service refusals of gay or lesbian people. About half of Jehovah’s Witnesses (50%) and other non-white Protestants (48%) oppose religiously based service refusals to gay or lesbian people.
There are only two major religious groups in which a majority favor allowing small business owners to refuse products or services to gay or lesbian people if doing so violates their religious beliefs: white evangelical Protestants (56%) and Mormons (58%). Notably, even majorities of younger white evangelical Protestants and younger Mormons favor religiously based service refusals (54% and 60%, respectively).

Service Refusals by Political Affiliation
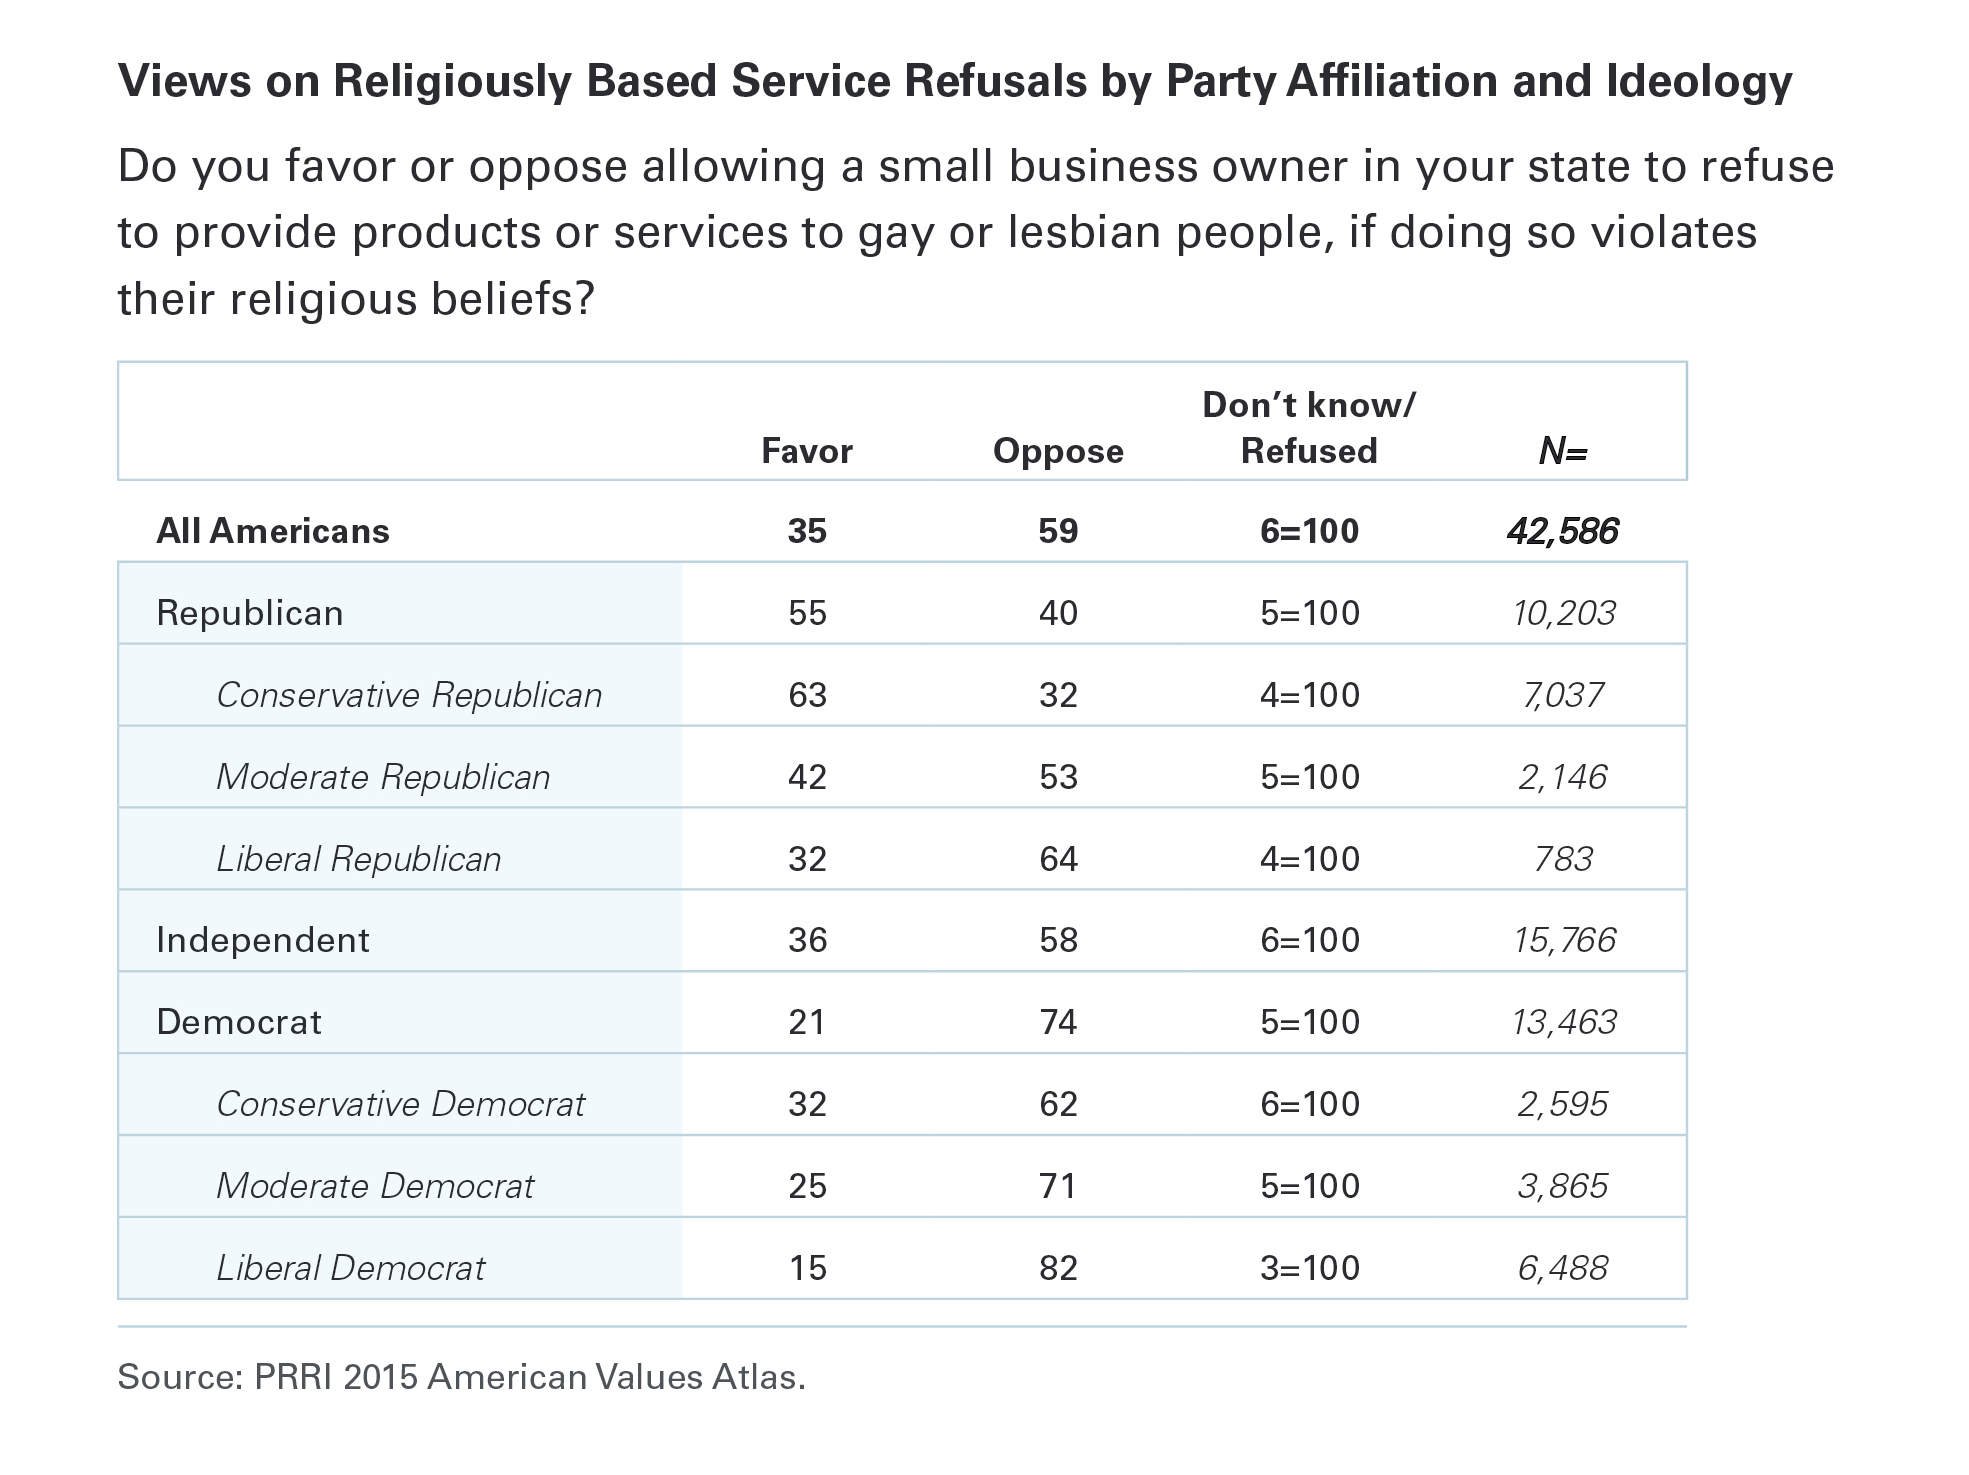
Unsurprisingly, Democrats are significantly more likely than Republicans to oppose allowing small business owners to refuse products or services to gay or lesbian people if doing so violates their religious beliefs. Nearly three-quarters (74%) of Democrats oppose allowing small business owners to refuse to provide products or services to gay or lesbian customers on religious grounds, compared to four in ten (40%) Republicans. A majority (55%) of Republicans favor allowing religiously based service refusals. Independents’ opinions more closely align with Democrats than Republicans on this issue, with nearly six in ten (58%) in opposition of allowing religiously based service refusals.
However, there are significant ideological and generational divisions on this issue between Democrats and Republicans. More than eight in ten (82%) liberal Democrats oppose allowing a small business owner with religious conflicts to deny service to a gay or lesbian customer, while a smaller number—though still a majority—of conservative Democrats (62%) express the same opinion. The ideological gap among Republicans is even larger. While more than six in ten (63%) conservative Republicans favor allowing small business owners to refuse service to gay or lesbian people on religious grounds, moderate and liberal Republicans disagree. A majority (53%) of moderate Republicans and nearly two-thirds (64%) of liberal Republicans oppose allowing religiously based service refusals.
There are also modest generational divisions among partisans, particularly among Republicans. While about half (49%) of younger Republicans oppose religiously based service refusals, fewer than four in ten (37%) Republican seniors express the same opinion.
Service Refusals by Geography
A majority of Americans in all four U.S. Census regions oppose allowing small business owners to refuse to provide products or services to gay or lesbian people on religious grounds, though the degree of opposition varies somewhat by region. Two-thirds (67%) of residents in the Northeast oppose allowing service refusals of LGBT people, as do nearly six in ten Americans living in the West (58%) and Midwest (58%). Opposition to religiously based service refusals is lowest in the South, where 55% oppose allowing small business owners to deny service to gay or lesbian customers if doing so violates their religious beliefs; 38% of Southerners favor such a policy. However, there are notable racial divisions among Southern residents. Fewer than half (49%) of white Southerners oppose allowing small business owners to deny service to gay and lesbian customers, while 45% are in favor of this. By contrast, 65% of black Southerners oppose religiously based refusals to serve gay and lesbian people.
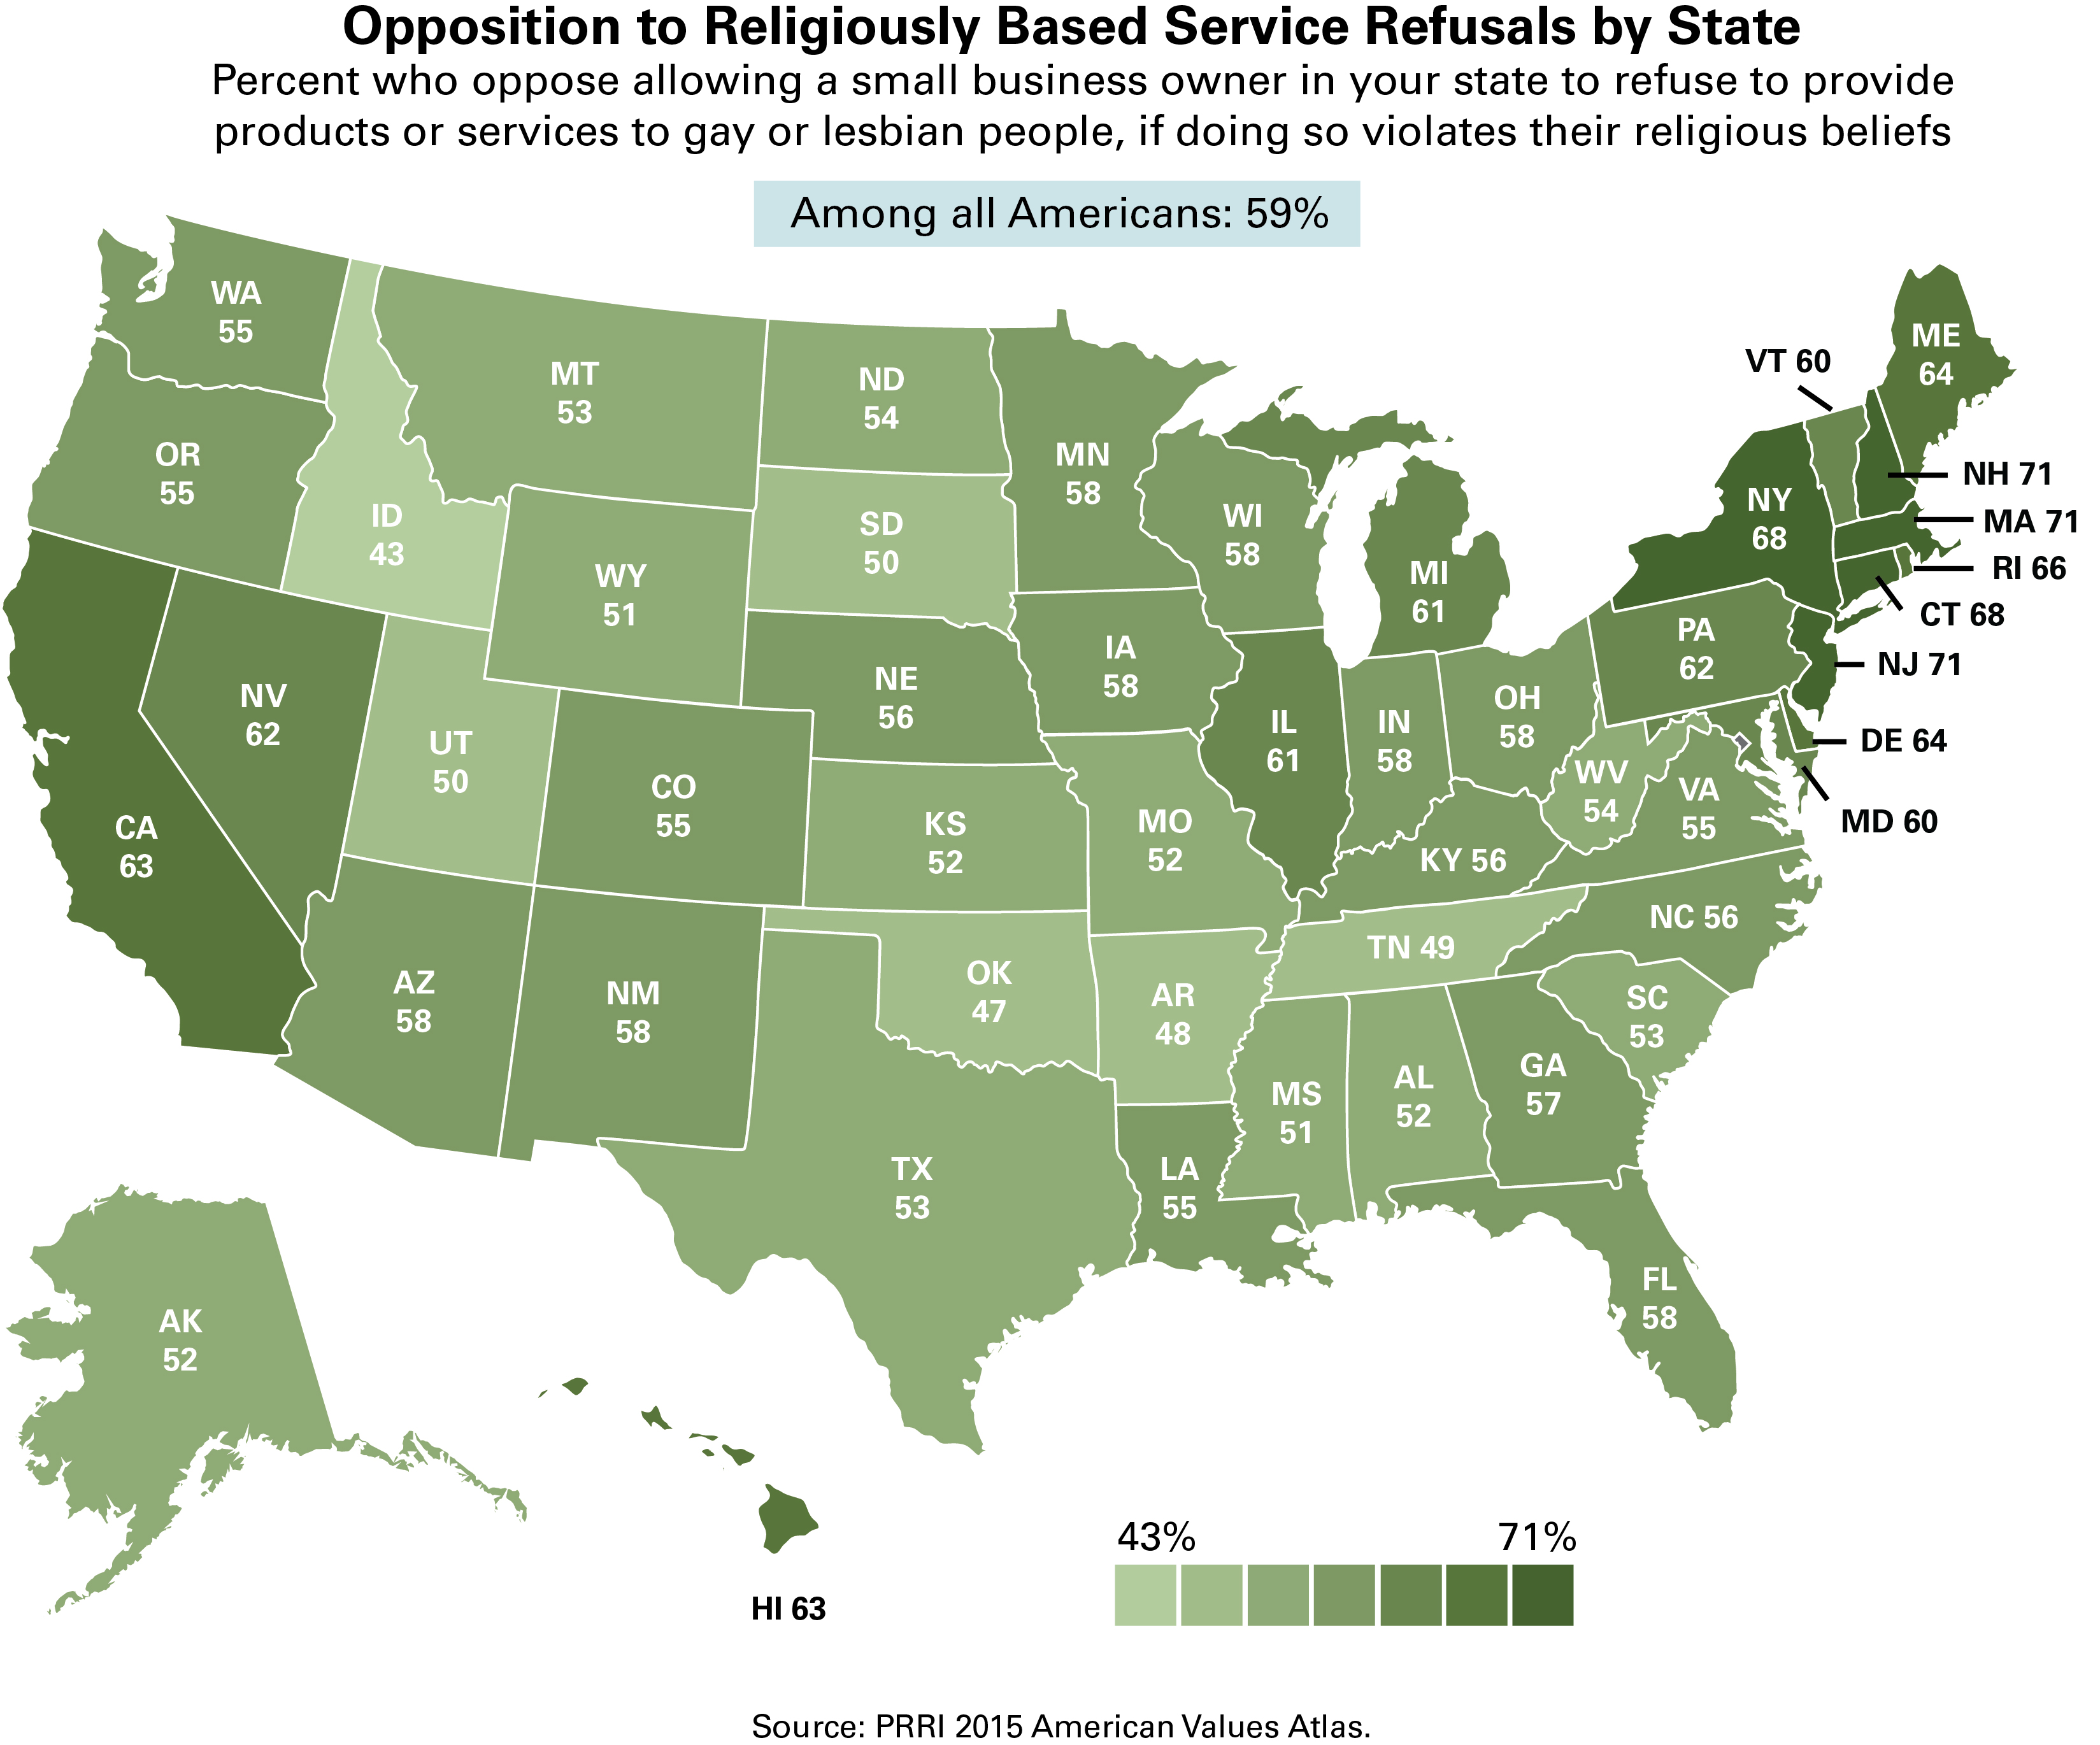
Views on religiously based service refusals also vary widely across the 50 states, although in no state is there a majority of support for allowing such a policy. States with the strongest opposition to allowing small business owners to deny service to gay or lesbian customers on religious grounds can be found predominately in the Northeast. Approximately seven in ten residents of New Jersey (71%), Massachusetts (71%), New Hampshire (71%), New York (68%), and Connecticut (68%) oppose religiously based service refusals of gay or lesbian people.
In contrast, Americans living in the South and parts of the West express greater support for allowing small business owners to deny services to gay and lesbian people. Nearly half of Idaho (49%), Oklahoma (46%), Utah (46%), Montana (46%), Arkansas (45%), and Tennessee (45%) residents favor allowing a small business owner to refuse products or services to gay or lesbian customers if doing so violates their religious beliefs.
Majorities of residents living in 30 major metro areas oppose allowing small business owners to refuse to provide products or services to gay or lesbian people on religious grounds. Opposition to religiously based service refusals is highest in Boston (73%), NewYork City (70%), and Chicago (69%), while opposition is lowest in Dallas (53%), Houston (53%), Portland, Ore. (53%), and Nashville, Tenn. (51%).
* In part, the gender differences may be the result of divergent personal experiences. Young women are much more likely to report having a close friend who is gay or lesbian than young men (78% vs. 61%, respectively) (PRRI 2014 LGBT Issues & Trends Survey).
Recommended citation:
Jones, Robert P., Daniel Cox, Betsy Cooper, and Rachel Lienesch. “Beyond Same-sex Marriage: Attitudes on LGBT Nondiscrimination Laws and Religious Exemptions.” PRRI. 2016. http://www.prri.org/research/poll-same-sex-gay-marriage-lgbt-nondiscrimination-religious-liberty/.