Executive Summary
 Voter Preferences and Outcome of the Midterm Election: The 2014 Vote
Early Voting
More Americans voted early in 2014 than in 2010. In 2010, 30% of midterm voters said they voted early, while 70% cast their ballot on Election Day. This year, 35% of Americans say they voted early, while 65% report voting on Election Day.
Non-white Americans and residents of the South and West were more likely to vote early than other Americans. More than 4-in-10 (41%) non-white Americans say they cast their ballot before Election Day, compared to only about one-third (32%) of white Americans. A majority (55%) of Westerners and 42% of Southerners report voting early compared to 22% of Midwesterners and 11% of Northeasterners.
There are no significant differences in early voting patterns between voters who supported Democratic candidates and those who supported Republican candidates.
The Timing of Voting Decisions
On average, voters supporting Republican candidates in the midterm election made their voting decisions much earlier than voters who supported Democratic candidates. A majority (52%) of Republican voters say they decided how they would vote in the six months before Election Day or even earlier, compared to 39% of Democratic voters. In contrast, roughly 1-in-3 (31%) Democratic voters say their voting decision was not made until a week before the election compared to 22% of Republican voters.
Voting Gaps: Age, Gender, Race, Class, and Economic Status
Voting preferences in the 2014 election were highly demographically stratified. Younger voters, female voters, non-white voters, and religiously unaffiliated voters were more likely to support Democratic candidates, while older voters, male voters, white voters, and white Protestant voters expressed stronger support for Republican candidates.
A majority (53%) of voters under the age of 40 report voting for a Democratic candidate in their election district, while a majority (56%) of senior voters (age 65 and over) cast ballots for the Republican candidate. There is also a gender gap. Female voters favored Democratic candidates (50%) over Republican candidates (42%), while male voters preferred Republican candidates (50%) to Democratic candidates (40%). A majority (55%) of white voters cast ballots for the Republican candidate, while nearly three-quarters (72%) of non-white voters supported the Democratic candidate.
There is also a substantial class division in voting preferences among white Americans. More than 6-in-10 (61%) white working-class voters supported the Republican candidate in their election district, while only about one-quarter (26%) supported the Democratic candidate. White college-educated voters split their vote nearly evenly between the Republican candidate (45%) and the Democratic candidate (48%). In 2012, Republican candidates had a significantly smaller advantage over Democrats among white working-class voters (55% vs. 35%).
Economic voting patterns can be seen clearly using PRRI’s Economic Insecurity Index. A slim majority (51%) of midterm voters who live in a high economic insecurity households supported the Democratic candidate, while 34% supported the Republican. By contrast, 41% of midterm voters who live in households with no reported economic insecurity supported the Democratic candidate, while 48% supported the Republican candidate.
The Religion Vote
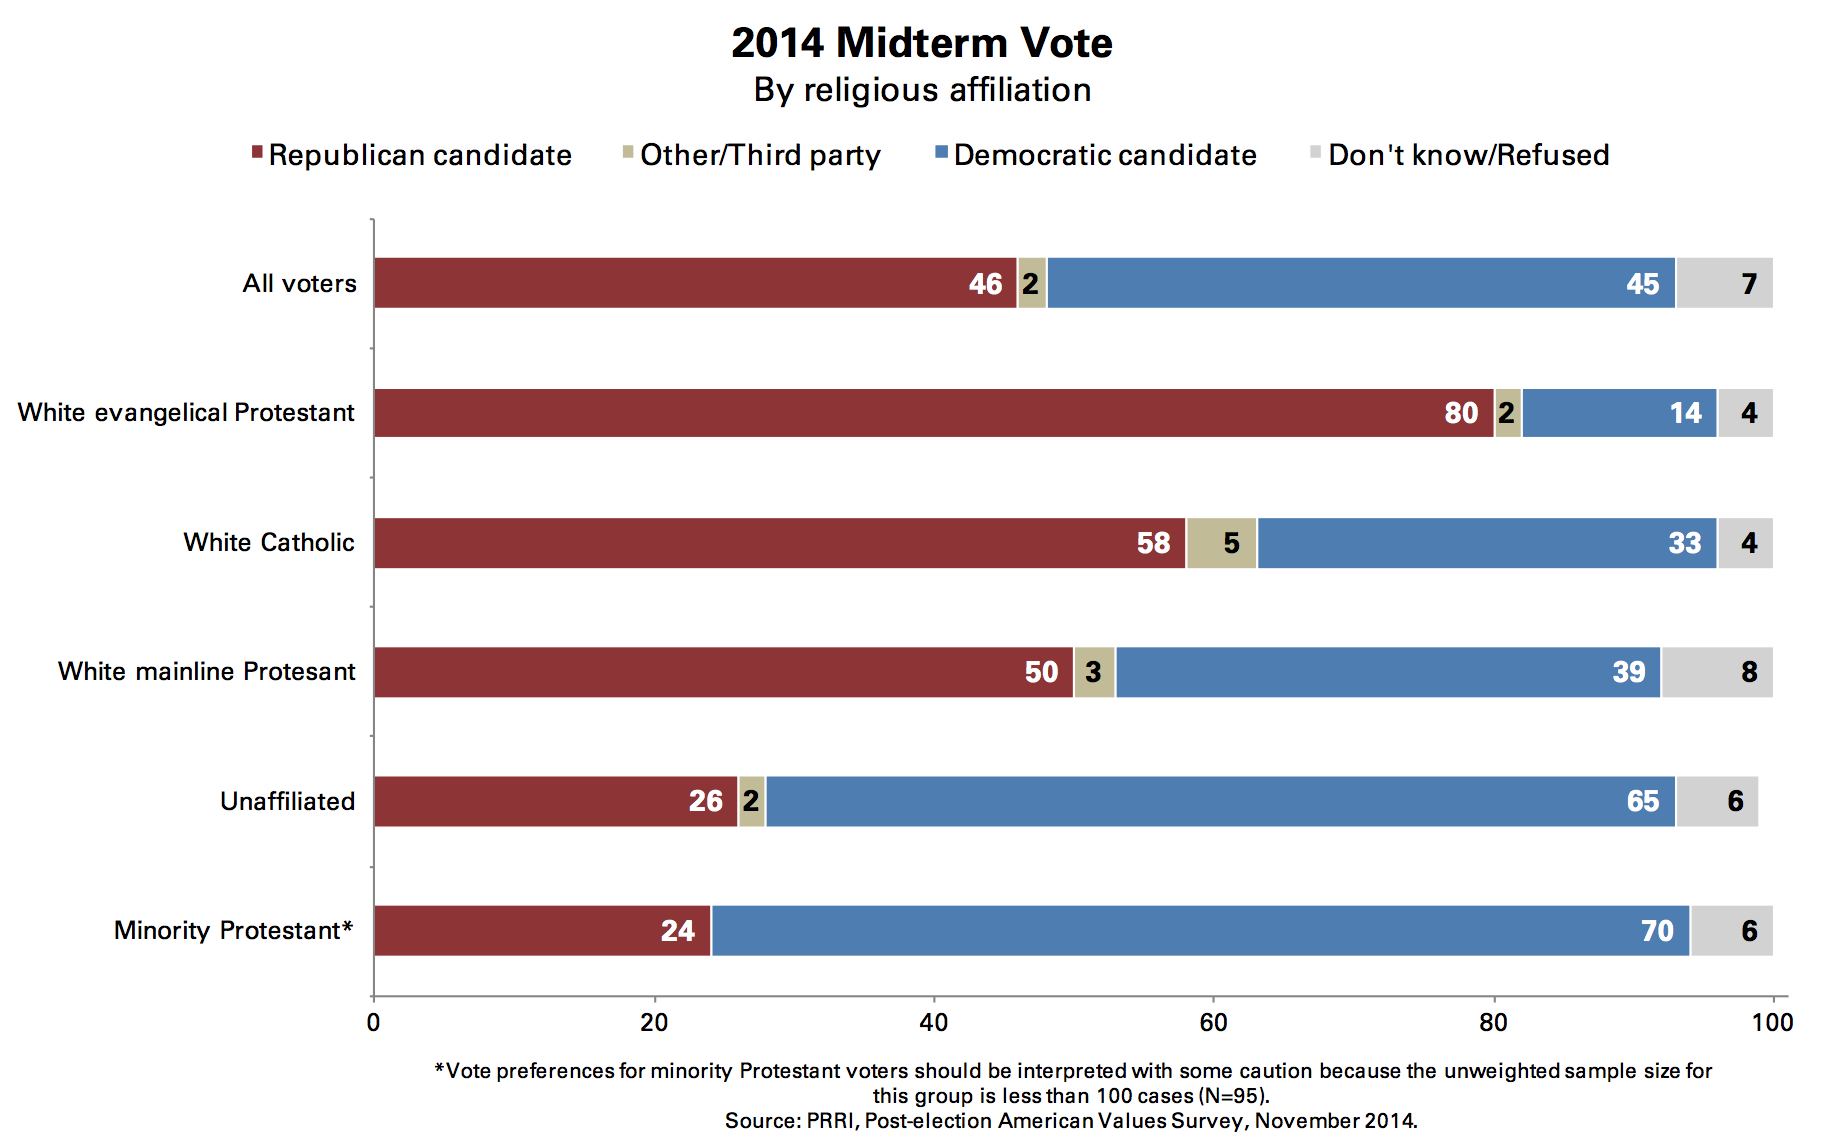
This year, religious Americans’ voting preferences did not depart substantially from the patterns seen in national elections over the past decade. Eight-in-ten (80%) white evangelical Protestant voters supported the Republican candidate in their district, while 14% supported the Democratic candidate. Half (50%) of white mainline Protestant voters supported the Republican candidate, while fewer than 4-in-10 (39%) said they voted for the Democratic candidate. Nearly 6-in-10 (58%) white Catholics report casting a vote for the Republican candidate in their district, while one-third (33%) supported the Democratic candidate. Catholics overall were more divided between the Democratic (46%) and Republican (47%) candidates. In contrast, religiously unaffiliated voters strongly favored Democratic candidates (65%) over Republicans (26%). Minority Protestant voters also strongly supported Democratic candidates (70%) over Republican candidates (24%).
In 2012, nearly 8-in-10 (79%) voters in Republican candidate Mitt Romney’s coalition were white Christians, compared to only 35% of Obama voters. This year, the religious composition of each party’s coalition remained largely the same. Nearly three-quarters (74%) of voters who supported Republican candidates are white Christian compared to 3-in-10 (30%) voters supporting Democratic candidates.
Examining the specific religious affiliations of the Republican and Democratic voting blocs also reveals familiar patterns. White evangelical Protestants make up more than one-third (36%) Republican voters in 2014, the single most important religious group in the GOP coalition. Religiously unaffiliated voters constitute only about 1-in-10 (12%) of Republican voters. Conversely, religiously unaffiliated voters constitute 3-in-10 (30%) Democratic voters, while white evangelical Protestants make up only seven percent of Democratic voters.
I. The 2014 Election: Context and Turnout
The 2014 Midterm Election Context
PRRI’s Pre-election American Values Survey, conducted a month before the 2014 midterm election, found the electorate in a gloomy mood despite a steady stream of positive indicators from official economic sources. According to PRRI’s Economic Insecurity Index, approximately 4-in-10 Americans currently live in households with high (15%) or moderate (26%) economic insecurity. A majority of Americans also reported that they are in fair (37%) or poor (20%) financial shape. Only 30% of Americans said that they think the economy has gotten better over the last two years, while 35% said it has gotten worse, and 33% said it has stayed about the same. Most significantly, more than 7-in-10 (72%) Americans said they believe the economy is still in a recession today.(1)
Direction of the Country, President Obama’s Job Approval
PRRI’s 2014 Post-election American Values Survey, conducted immediately following the 2014 election, finds that Americans took their economic concerns into the voting booth. More than 6-in-10 (62%) Americans say things in the U.S. have gotten seriously off track, while only 30% think things are heading in the right direction. Americans’ negative outlook on the state of the country has persisted since 2010 (2) with the exception of a modest dip in 2012 when 57% of Americans said that things were on the wrong track.(3)
Unsurprisingly, about 8-in-10 (82%) Republicans and 78% of Americans who identify with the Tea Party say things in the U.S. have gotten seriously off on the wrong track. However, this view is also shared by nearly 7-in-10 (68%) independents and more than 4-in-10 (42%) Democrats. Nearly half (48%) of Democrats say things in the country are going in the right direction.
President Obama’s job approval rating is significantly lower today than it was four years ago. Just before the 2010 midterm election, nearly half (49%) of Americans overall said they approved of Obama’s job performance, while 42% disapproved.(4) In 2014, the views are reversed: 43% approve of Obama’s job performance, while 50% disapprove. Among 2014 midterm voters, assessments of Obama’s job performance are even more negative: 42% approve of his work as president, while 52% disapprove.
Safety Concerns: Worries about Personal Harm from Terrorism and Ebola
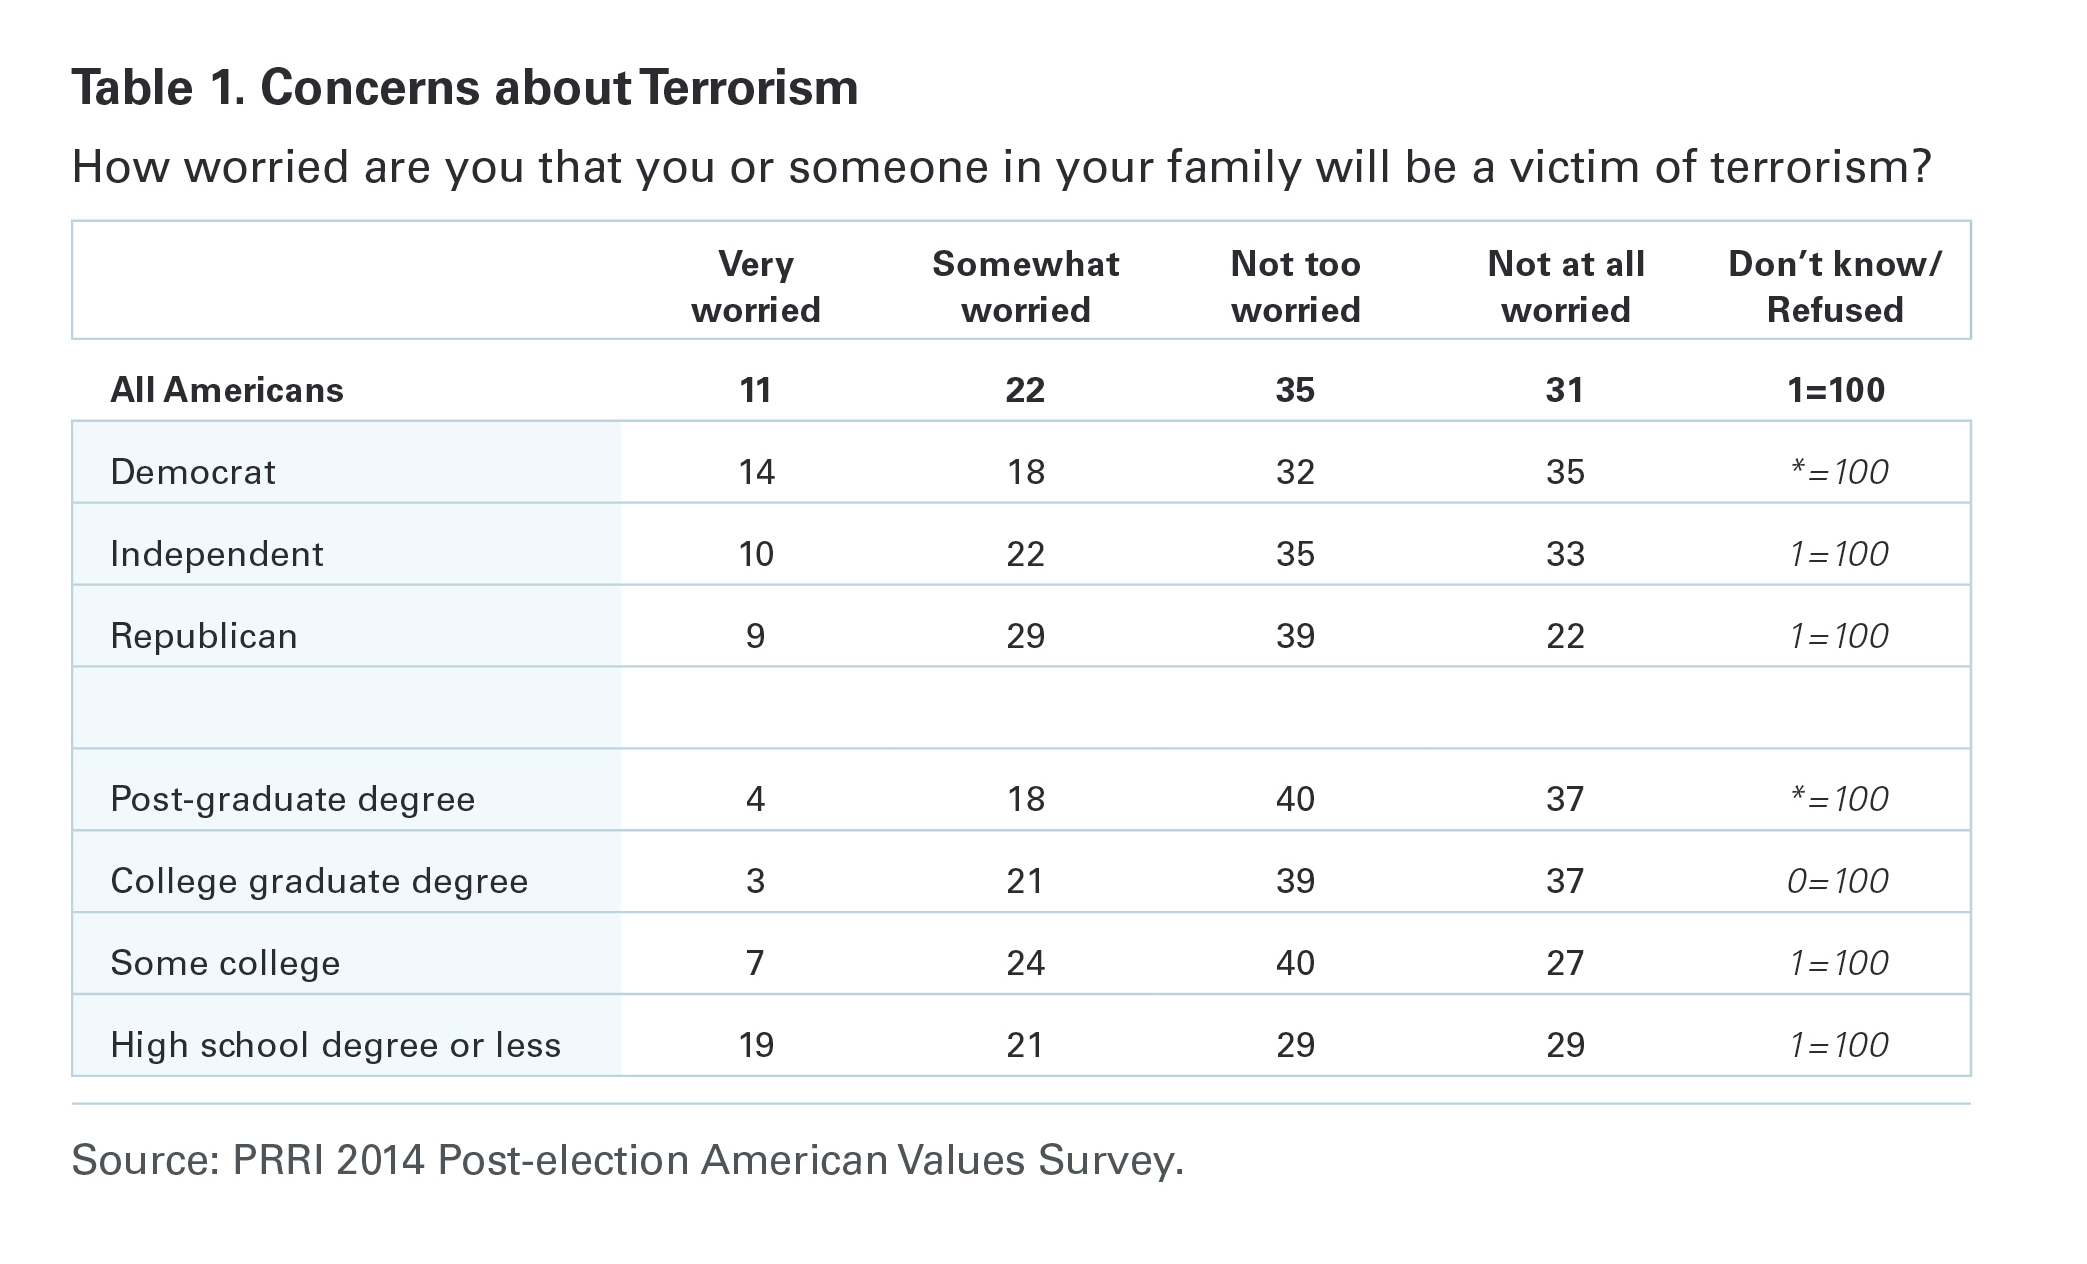
In addition to economic concerns, there is some indication that worries about terrorism and Ebola were on Americans’ minds during the election. One-third of Americans report that they are somewhat (22%) or very (11%) worried that they or someone in their family will be a victim of terrorism, while nearly two-thirds of Americans say they are not too worried (35%) or not at all worried (31%) about terrorism affecting their family. Among political groups, members of the Tea Party are most concerned about the threat of terrorism. More than 6-in-10 Americans who identify with the Tea Party are very (24%) or somewhat (37%) worried that they or their family members will be the victims of terrorism. By contrast, fewer than 4-in-10 Republicans are very (9%) or somewhat (29%) worried about terrorism affecting them or their families. Less than one-third of independents (10% and 22%, respectively) and Democrats (14% and 18%, respectively) are very or somewhat worried that they or someone in their family will be a victim of terrorism.
Despite the consistent media attention, Americans are less concerned about contracting Ebola, although a significant number of Americans worry about this possibility. More than 1-in-5 Americans say they are somewhat (15%) or very (7%) worried that they or someone in their family will get sick from Ebola, while nearly 8-in-10 Americans say they are not too worried (30%) or not at all worried (48%). Partisan differences about Ebola concerns are modest, although, once again, the Tea Party stands out. Nearly one-third of Tea Party members say they are very (14%) or somewhat (18%) worried that they or someone in their family will contract Ebola.
Voter Turnout and Problems Voting
Early estimates of voter turnout this year suggest that even fewer eligible voters participated in this election than during the last midterm election in 2010.(5) Because turnout tends to be lower during midterms than in presidential elections, the difference between the composition of the electorate and the general population is most pronounced during midterm election years.
A Profile of Voters and Nonvoters
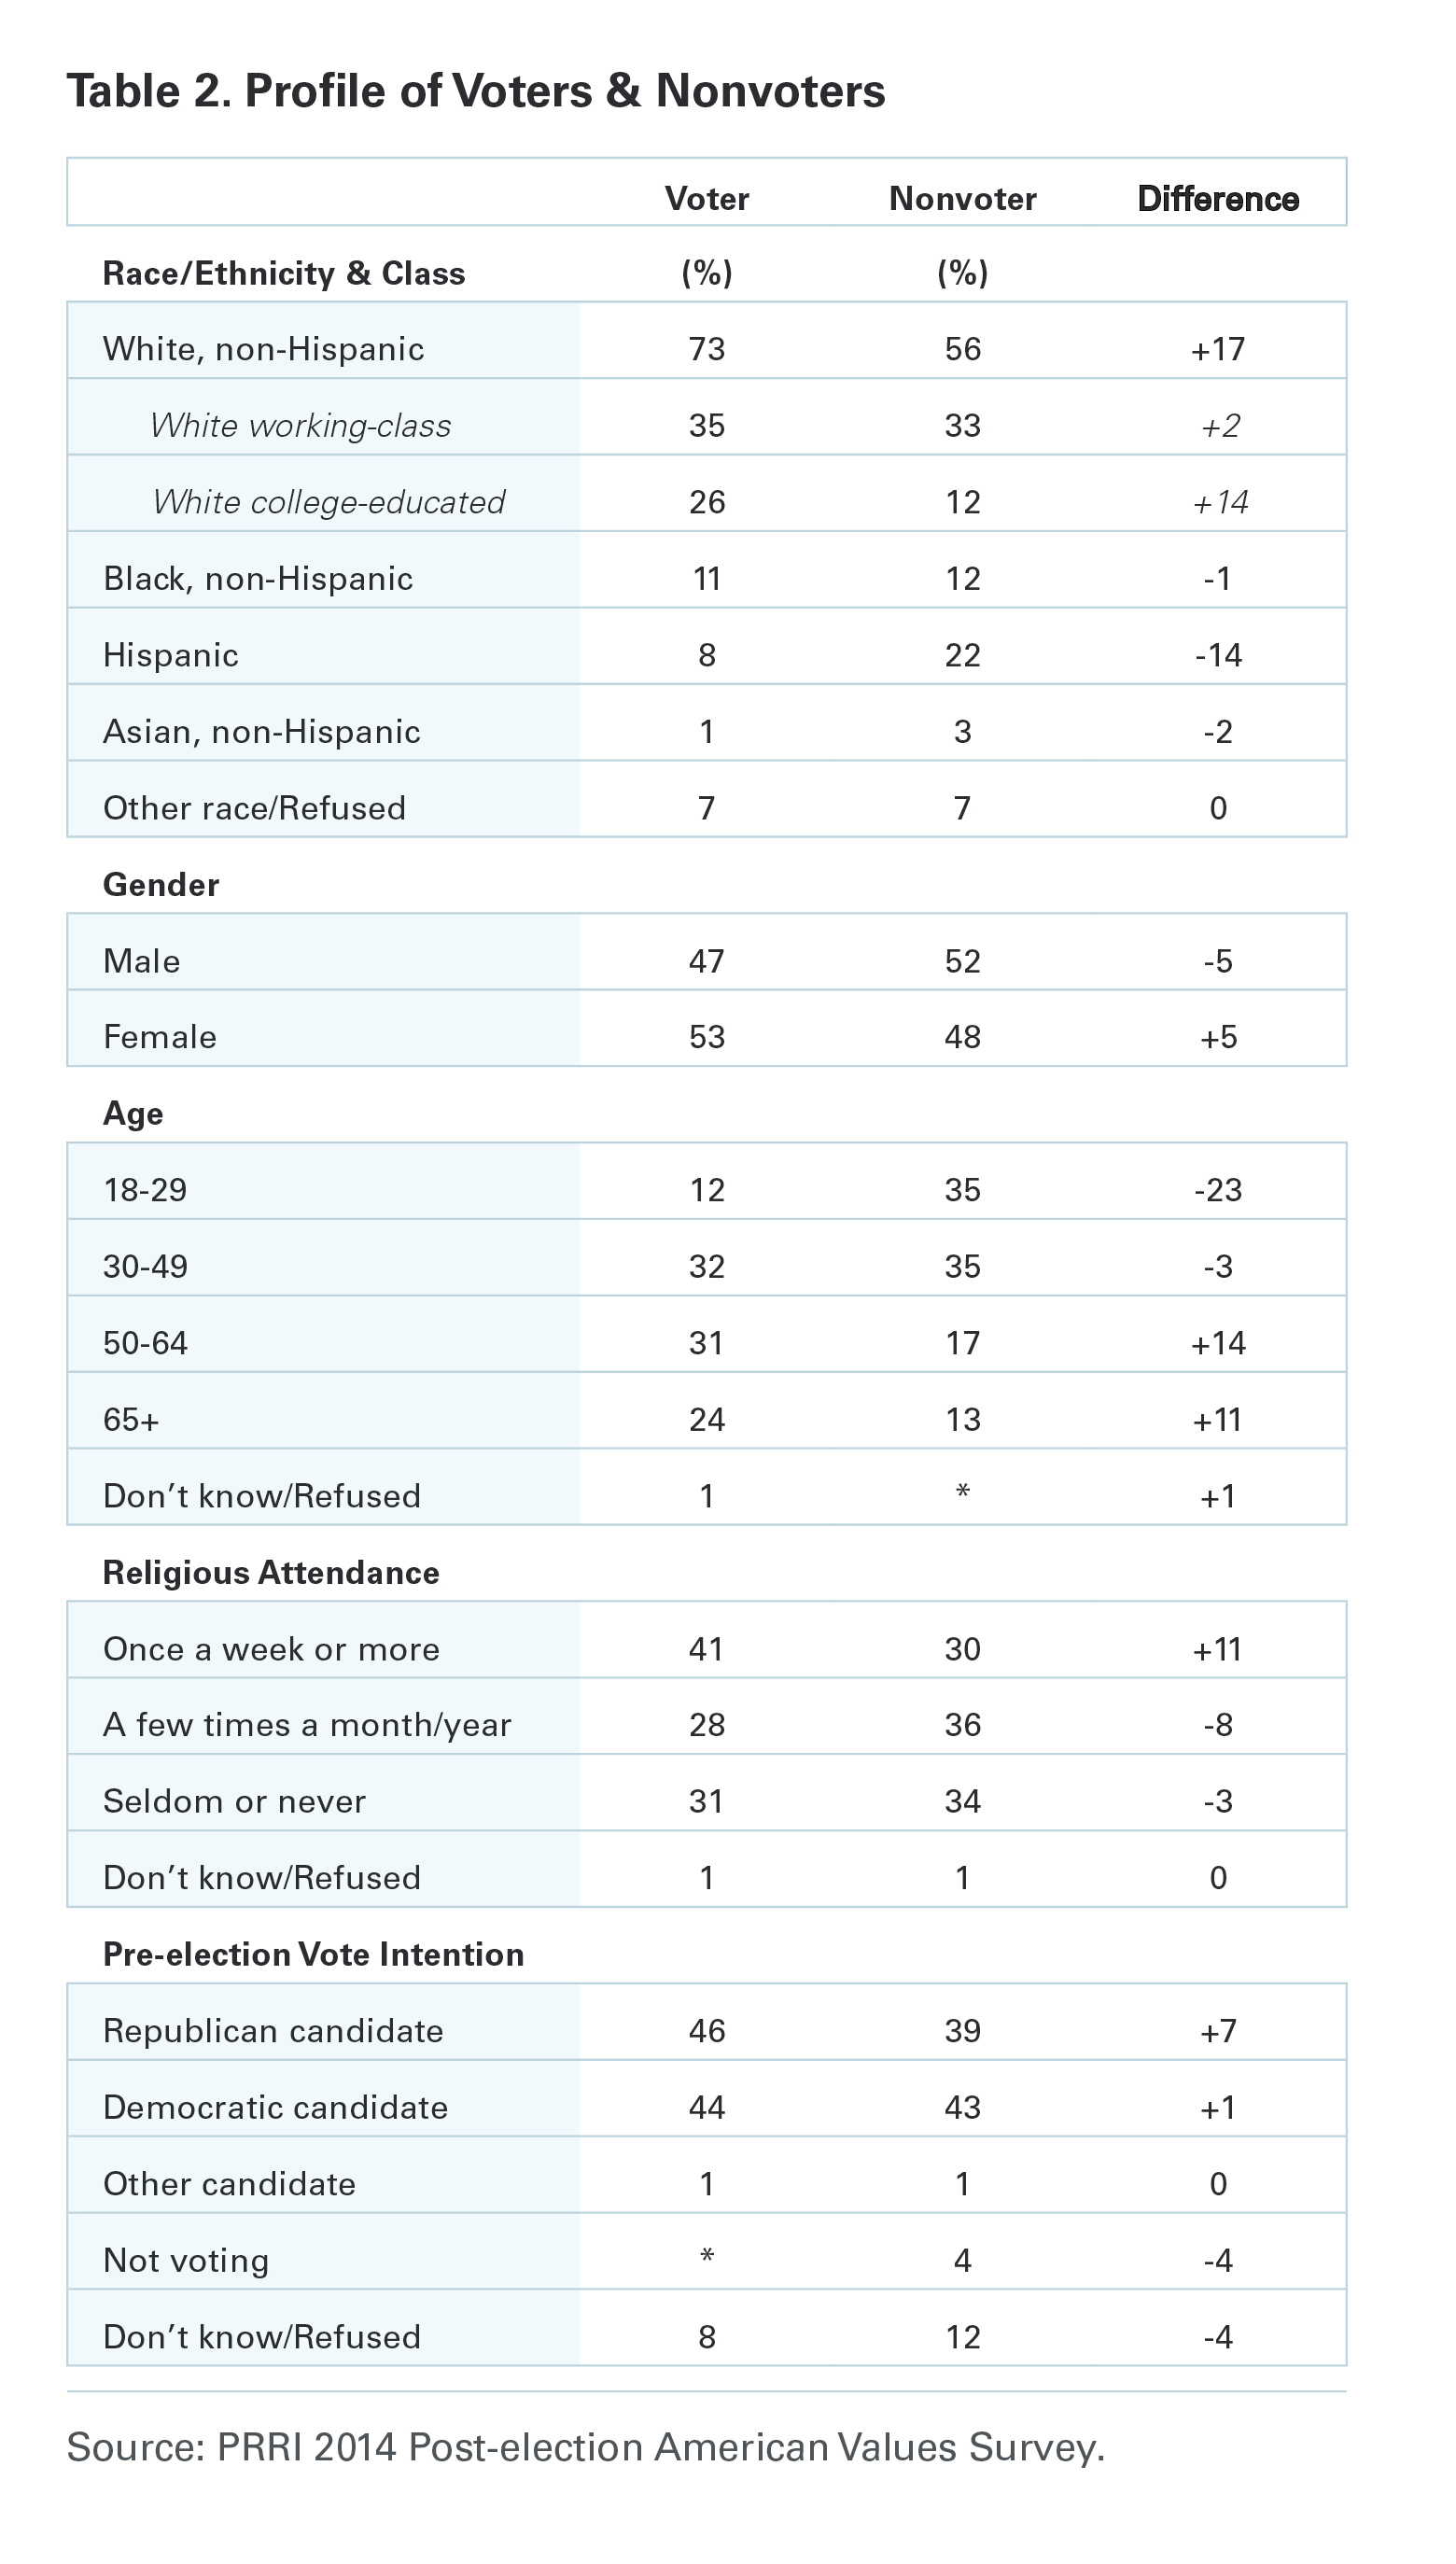
The Post-election American Values Survey found double-digit differences by race and ethnicity, age, and religious attendance between voters and nonvoters. In the 2014 election, white Americans comprised approximately three-quarters (73%) of midterm voters, but made up only 56% of nonvoters. Black Americans comprised roughly equal numbers of voters (11%) and nonvoters (12%). Hispanics constituted only eight percent of midterm voters, but made up 22% of nonvoters.
Young adults (age 18-29) are substantially more likely to be nonvoters: they made up only 12% of midterm voters, but comprised 35% of nonvoters. Meanwhile, higher levels of religious attendance positively correlate with voting. Americans who attend religious services at least once a week comprised 41% of midterm voters and 30% of nonvoters.
In the Pre-election American Values Survey, which was fielded in August 2014, Americans were asked who they intended to vote for in the midterm election. Notably, significantly more midterm voters than nonvoters reported an intention before the election to support Republican candidates (46% vs. 39%, respectively). Thus, the midterm voter pool includes more voters who intended months ahead of the election to support Republican candidates.
Accompanying Parents to the Voting Booth as Children
Americans who remember accompanying a parent to the voting booth on Election Day as children were more likely to report voting this year than those who did not. Nearly three-quarters (74%) of Americans who went with their parents to the voting booth as children say they voted this year compared to 62% of those who did not.
Americans who have higher levels of educational attainment are more likely to have had the childhood experience of accompanying a parent to vote. For example, 45% of Americans with a college degree report going with their parents to vote as a child, compared to only 25% of Americans with a high school education or less.
Voting Problems
Overall, approximately 1-in-10 (12%) Americans report that they had some difficulty voting this year. Only 2% of voters—but nearly one-third (32%) of nonvoters—report having some problems voting this year, suggesting that these issues are serious enough to prevent people from voting.
The most frequently cited voting-related problem is simply getting to the polling place. A majority of Americans who ran into voting obstacles report they either had difficulty finding or physically getting to their polling place (28%), or had trouble leaving work to vote (24%). About 1-in-5 (18%) say they had moved to an address outside their previous precinct or had problems using or acquiring an absentee ballot. Fewer than 1-in-10 cite difficulties at the polling place itself, such as not having the correct identification (5%), finding the ballot confusing (2%), or having to wait in long lines (2%).
Women, young adults, and non-white Americans are more likely than other Americans to report having difficulties voting. Fifteen percent of women say they had difficulty voting compared to nine percent of men. One-quarter (25%) of young adults say they ran into problems while trying to vote compared to seven percent of seniors. Nearly 1-in-5 (19%) non-white Americans say they encountered problems while voting compared to nine percent of white Americans. There are no significant differences in reported voting-related difficulties by level of educational attainment, region, or political affiliation.
Voter Fraud vs. Disenfranchisement
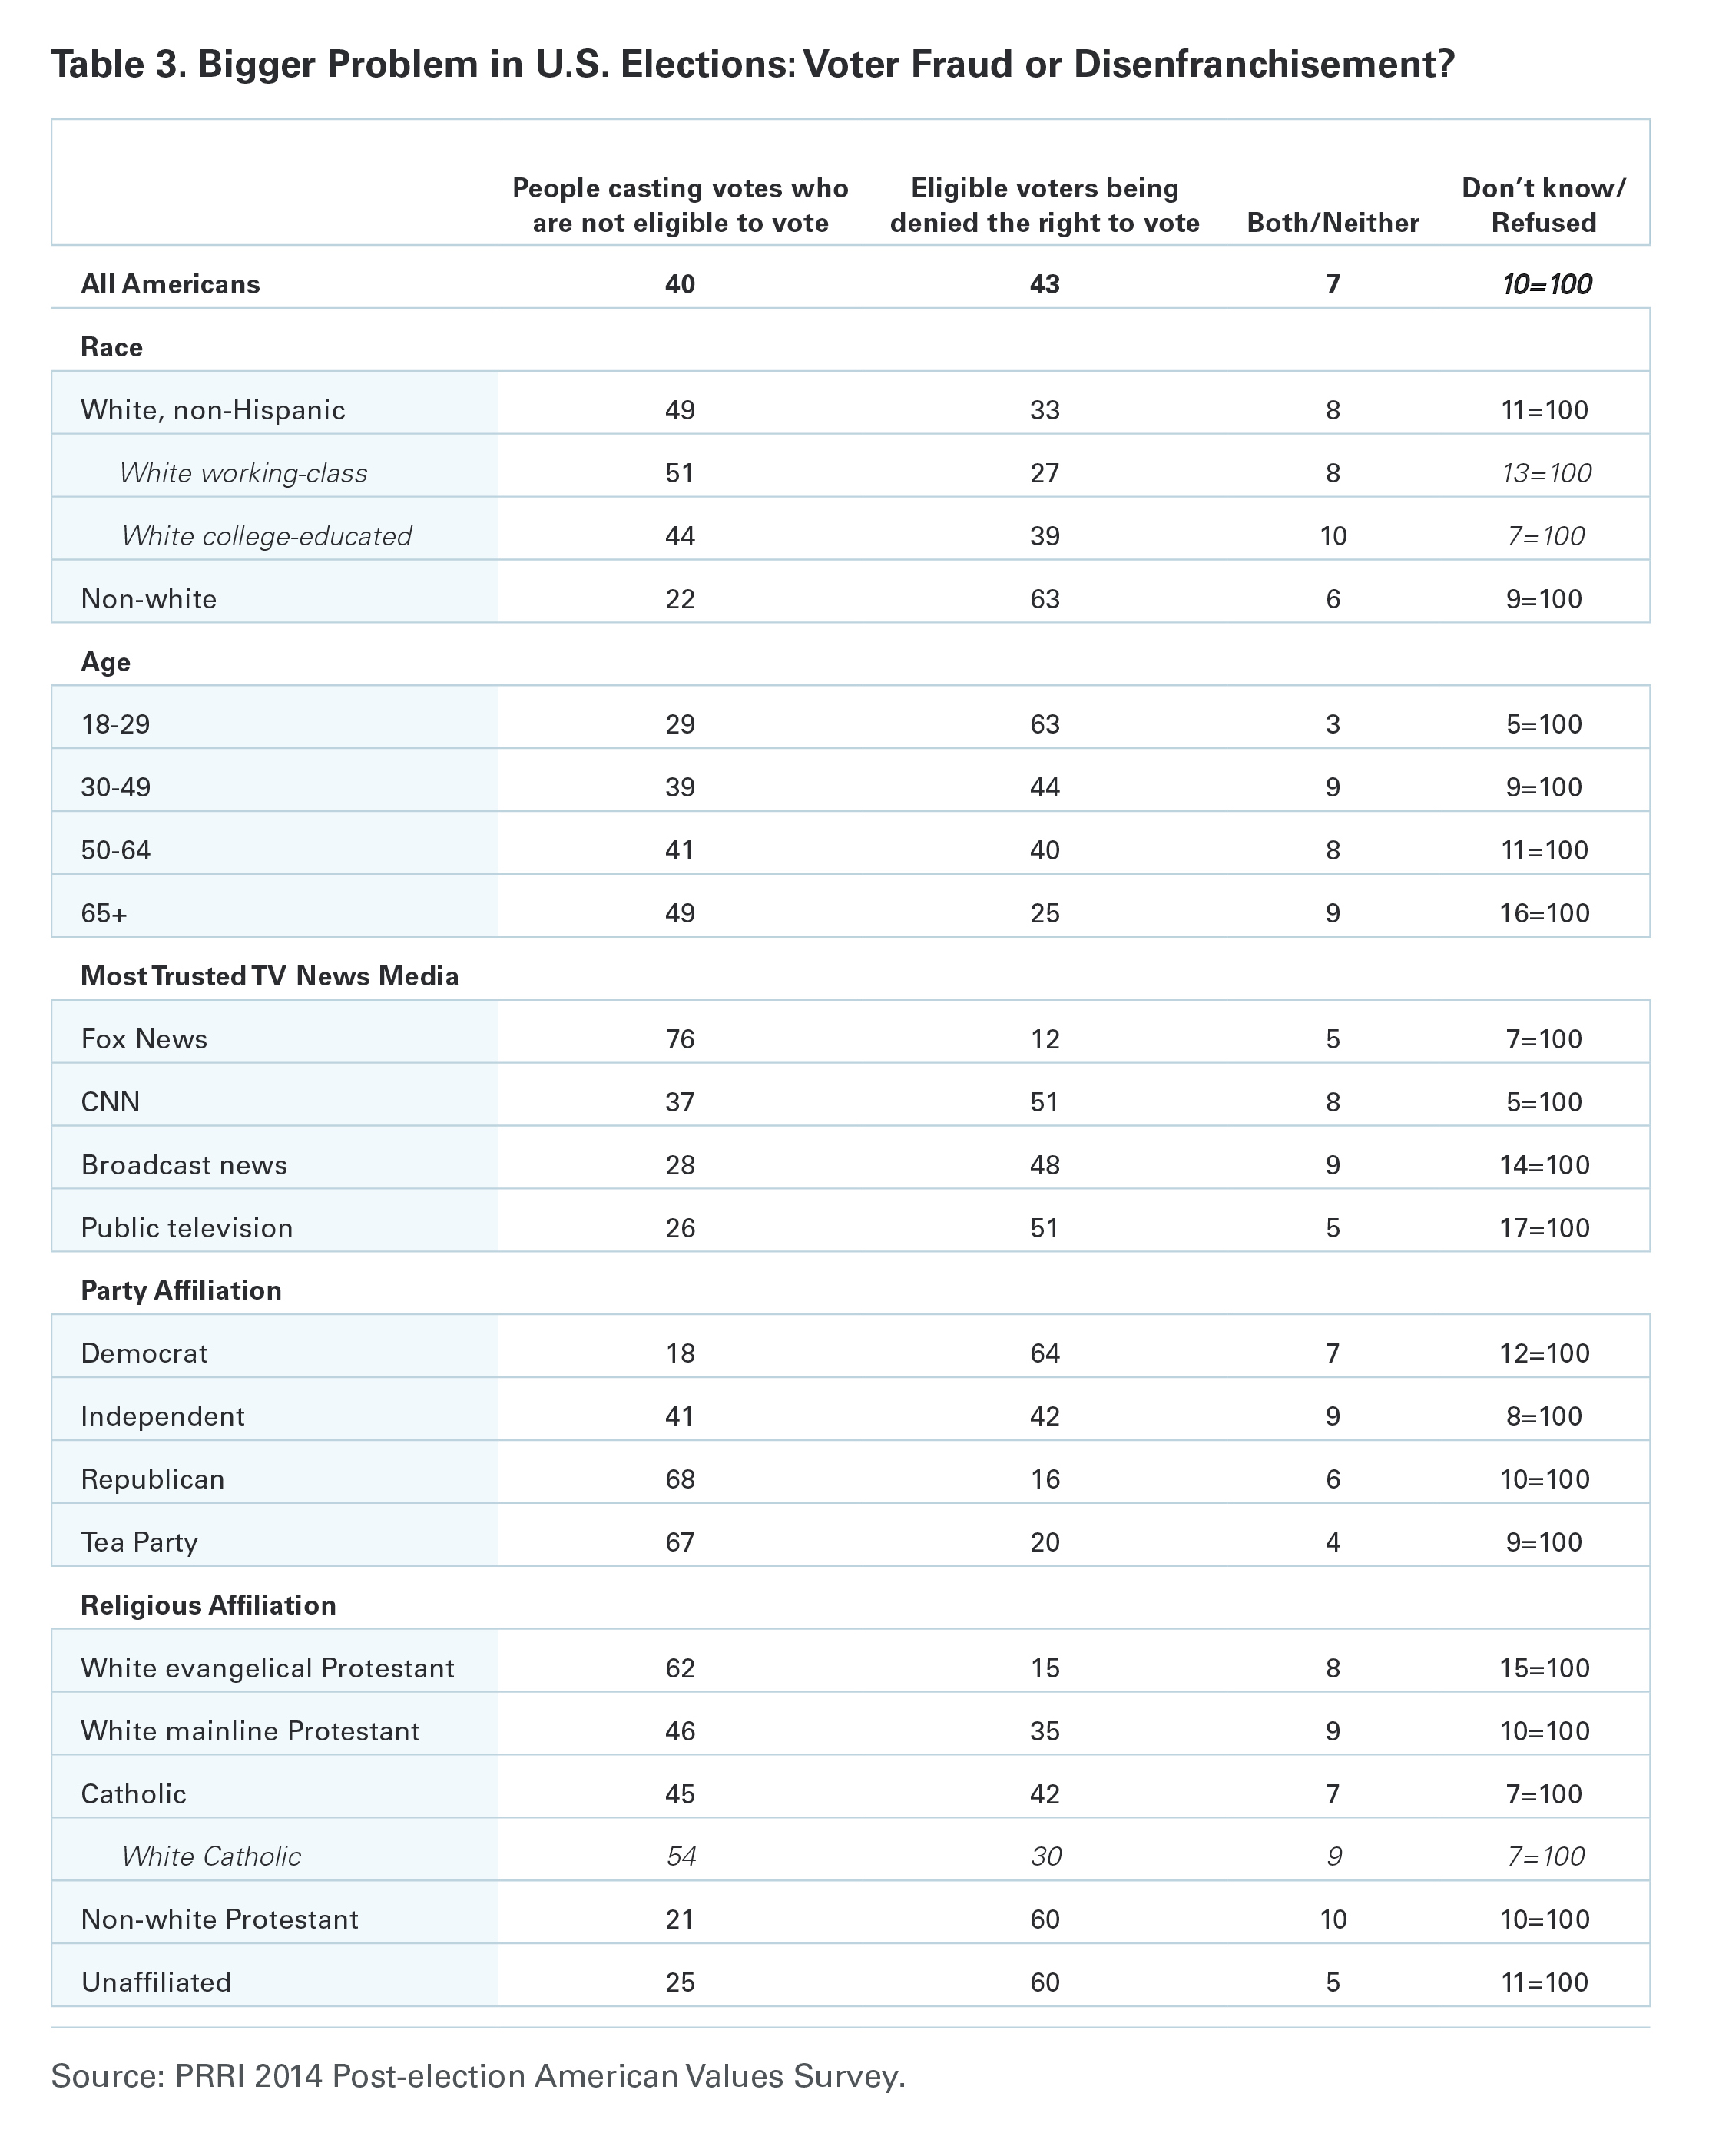
Americans are evenly divided over whether voter fraud or voter disenfranchisement is a bigger problem in U.S. elections today. Forty percent of Americans believe that people casting votes who are not eligible to vote is the bigger problem, while 43% of Americans say the bigger problem is eligible voters being denied the right to vote. Seven percent say that both or neither of these problems is the biggest issue in American elections today, and 10% have no opinion.
Views about the largest problem for American democracy diverge sharply by race, social class, party affiliation, age, most-trusted media source, and religion. Nearly half (49%) of white Americans say the bigger problem in elections is people casting votes who are not eligible to vote, while 33% say the bigger problem is that eligible voters are being prevented from voting. Conversely, about 1-in-5 (22%) non-white Americans say that fraud is the larger issue, while more than 6-in-10 (63%) say the bigger problem is voter disenfranchisement. There is also a class divide among white Americans: a majority (51%) of white working-class Americans say the bigger problem is voter fraud, while fewer than 3-in-10 (27%) point to voter disenfranchisement. White college-educated Americans, on the other hand, are more divided with 44% identifying voter fraud as the bigger problem, while 39% cite voter disenfranchisement.
Fewer than 3-in-10 (29%) young adults point to voter fraud as the bigger problem for U.S. elections, while more than 6-in-10 (63%) say that voter disenfranchisement is the larger issue. By contrast, nearly half (49%) of seniors see voter fraud as the bigger problem, while one-quarter (25%) point to voter disenfranchisement as the larger issue.
Americans who most trust Fox News to give them accurate information about current events and politics have a different perspective on this question than Americans who most trust any other media source. More than three-quarters (76%) of Fox News viewers say the bigger problem in U.S. elections is that people who are ineligible to vote are casting votes, while 12% say the bigger problem is that eligible voters are being kept from voting. Majorities or pluralities of Americans who most trust any other media source disagree, saying that voter disenfranchisement is a bigger problem than voter fraud.
There are substantial partisan divides on this question. Approximately two-thirds (68%) of Republicans say the bigger problem for U.S. elections is voter fraud, while a nearly identical number (64%) of Democrats disagree, saying that the bigger problem is voter disenfranchisement.
There are also sizeable differences among religious groups. More than 6-in-10 (62%) white evangelical Protestants say that the bigger problem in U.S. elections is voter fraud rather than voter disenfranchisement (15%). White mainline Protestants and Catholics are divided, while minority Protestants and religiously unaffiliated Americans are more likely to identify voter disenfranchisement as the bigger problem (60% and 60%, respectively) rather than voter fraud (21% and 25%, respectively).
II. Voter Preferences and Outcome of the Midterm Election
The 2014 Vote
Early Voting
More Americans voted early in 2014 than in 2010. In 2010, 30% of midterm voters said they voted early, while 70% cast their ballot on Election Day.(6) This year, 35% of Americans say they voted early, while 65% report voting on Election Day.
Non-white Americans and residents of the South and West were more likely to vote early than other Americans. More than 4-in-10 (41%) non-white Americans say they cast their ballot before Election Day, compared to only about one-third (32%) of white Americans. A majority (55%) of Westerners and 42% of Southerners report voting early compared to 22% of Midwesterners and 11% of Northeasterners.
There are no significant differences in early voting patterns between voters who supported Democratic candidates and those who supported Republican candidates.
The Timing of Voting Decisions
On average, voters supporting Republican candidates in the midterm election made their voting decisions much earlier than voters who supported Democratic candidates.(7) A majority (52%) of Republican voters say they decided how they would vote in the six months before Election Day or even earlier, compared to 39% of Democratic voters. In contrast, roughly 1-in-3 (31%) Democratic voters say their voting decision was not made until a week before the election compared to 22% of Republican voters.
Voting Gaps: Age, Gender, Race, Class, and Economic Status
Voting preferences in the 2014 election were highly demographically stratified.(8) Younger voters, female voters, non-white voters, and religiously unaffiliated voters were more likely to support Democratic candidates, while older voters, male voters, white voters, and white Protestant voters expressed stronger support for Republican candidates.
A majority (53%) of voters under the age of 40 report voting for a Democratic candidate in their election district, while a majority (56%) of senior voters (age 65 and over) cast ballots for the Republican candidate. There is also a gender gap. Female voters favored Democratic candidates (50%) over Republican candidates (42%), while male voters preferred Republican candidates (50%) to Democratic candidates (40%). A majority (55%) of white voters cast ballots for the Republican candidate, while nearly three-quarters (72%) of non-white voters supported the Democratic candidate.
There is also a substantial class division in voting preferences among white Americans. More than 6-in-10 (61%) white working-class voters supported the Republican candidate in their election district, while only about one-quarter (26%) supported the Democratic candidate. White college-educated voters split their vote nearly evenly between the Republican candidate (45%) and the Democratic candidate (48%). In 2012, Republican candidates had a significantly smaller advantage over Democrats among white working-class voters (55% vs. 35%).(9)
Economic voting patterns can be seen clearly using PRRI’s Economic Insecurity Index. A slim majority (51%) of midterm voters who live in a high economic insecurity households supported the Democratic candidate, while 34% supported the Republican. By contrast, 41% of midterm voters who live in households with no reported economic insecurity supported the Democratic candidate, while 48% supported the Republican candidate.
The Religion Vote
This year, religious Americans’ voting preferences did not depart substantially from the patterns seen in national elections over the past decade. Eight-in-ten (80%) white evangelical Protestant voters supported the Republican candidate in their district, while 14% supported the Democratic candidate. Half (50%) of white mainline Protestant voters supported the Republican candidate, while fewer than 4-in-10 (39%) said they voted for the Democratic candidate. Nearly 6-in-10 (58%) white Catholics report casting a vote for the Republican candidate in their district, while one-third (33%) supported the Democratic candidate. Catholics overall were more divided between the Democratic (46%) and Republican (47%) candidates. In contrast, religiously unaffiliated voters strongly favored Democratic candidates (65%) over Republicans (26%). Minority Protestant voters also strongly supported Democratic candidates (70%) over Republican candidates (24%).(10)

In 2012, nearly 8-in-10 (79%) voters in Republican candidate Mitt Romney’s coalition were white Christians, compared to only 35% of Obama voters.(11) This year, the religious composition of each party’s coalition remained largely the same. Nearly three-quarters (74%) of voters who supported Republican candidates are white Christian compared to 3-in-10 (30%) voters supporting Democratic candidates.
Examining the specific religious affiliations of the Republican and Democratic voting blocs also reveals familiar patterns. White evangelical Protestants make up more than one-third (36%) Republican voters in 2014, the single most important religious group in the GOP coalition. Religiously unaffiliated voters constitute only about 1-in-10 (12%) of Republican voters. Conversely, religiously unaffiliated voters constitute 3-in-10 (30%) Democratic voters, while white evangelical Protestants make up only seven percent of Democratic voters.
Reassessing the 2012 Coalitions and Vote
Voters who supported Romney in 2012 were somewhat more likely to report voting in the 2014 midterm election than Obama voters (86% vs. 80%, respectively). Additionally, Romney voters expressed stronger support for Republican candidates this year (90%) than Obama voters did for Democratic candidates (84%). Eight percent of Obama voters supported a Republican candidate in this year’s election, while only half as many Romney voters (4%) switched allegiances to support Democratic candidates.
When asked to reassess their 2012 voting decision for president, midterm voters are divided in their voting preferences. If the 2012 presidential election were held today, equal numbers of voters say they would cast their ballot for Romney (46%) and Obama (46%).
Reasons for Voting
Voting to Express Negative or Positive Sentiments
Republican voters are about as likely to say that their vote for Congress was as much of an effort to help the Republican Party (27%) as it was an attempt to express opposition to President Obama (26%). Fourteen percent of Republican voters say they cast their ballot to express discontent with Washington in general. One-in-five (20%) Republican voters say their vote was primarily about local issues.
By contrast, nearly 4-in-10 (38%) Democratic voters say they cast their ballot to assist the Democratic Party in general, while 19% say they were voting against the Republican Party. Only six percent say they were voting against Washington, and nearly one-third (31%) say they were voting on local issues.
Voting Preferences by Issue Priorities
Voters who indicated in the Pre-election American Values Survey that health care was the most important issue affecting their vote ended up supporting the Democratic candidate in their district (65%) over the Republican (26%) by a wide margin.(12) Voters who reported that the economy was the most important issue when determining how to vote were slightly more likely to favor Democratic candidates (50%) over Republican candidates (43%). In contrast, voters who said immigration or national security were the most important issues for their vote strongly favored Republican candidates over Democrats (62% vs. 28% and 65% vs. 27%, respectively).
Security, Safety, and the Election
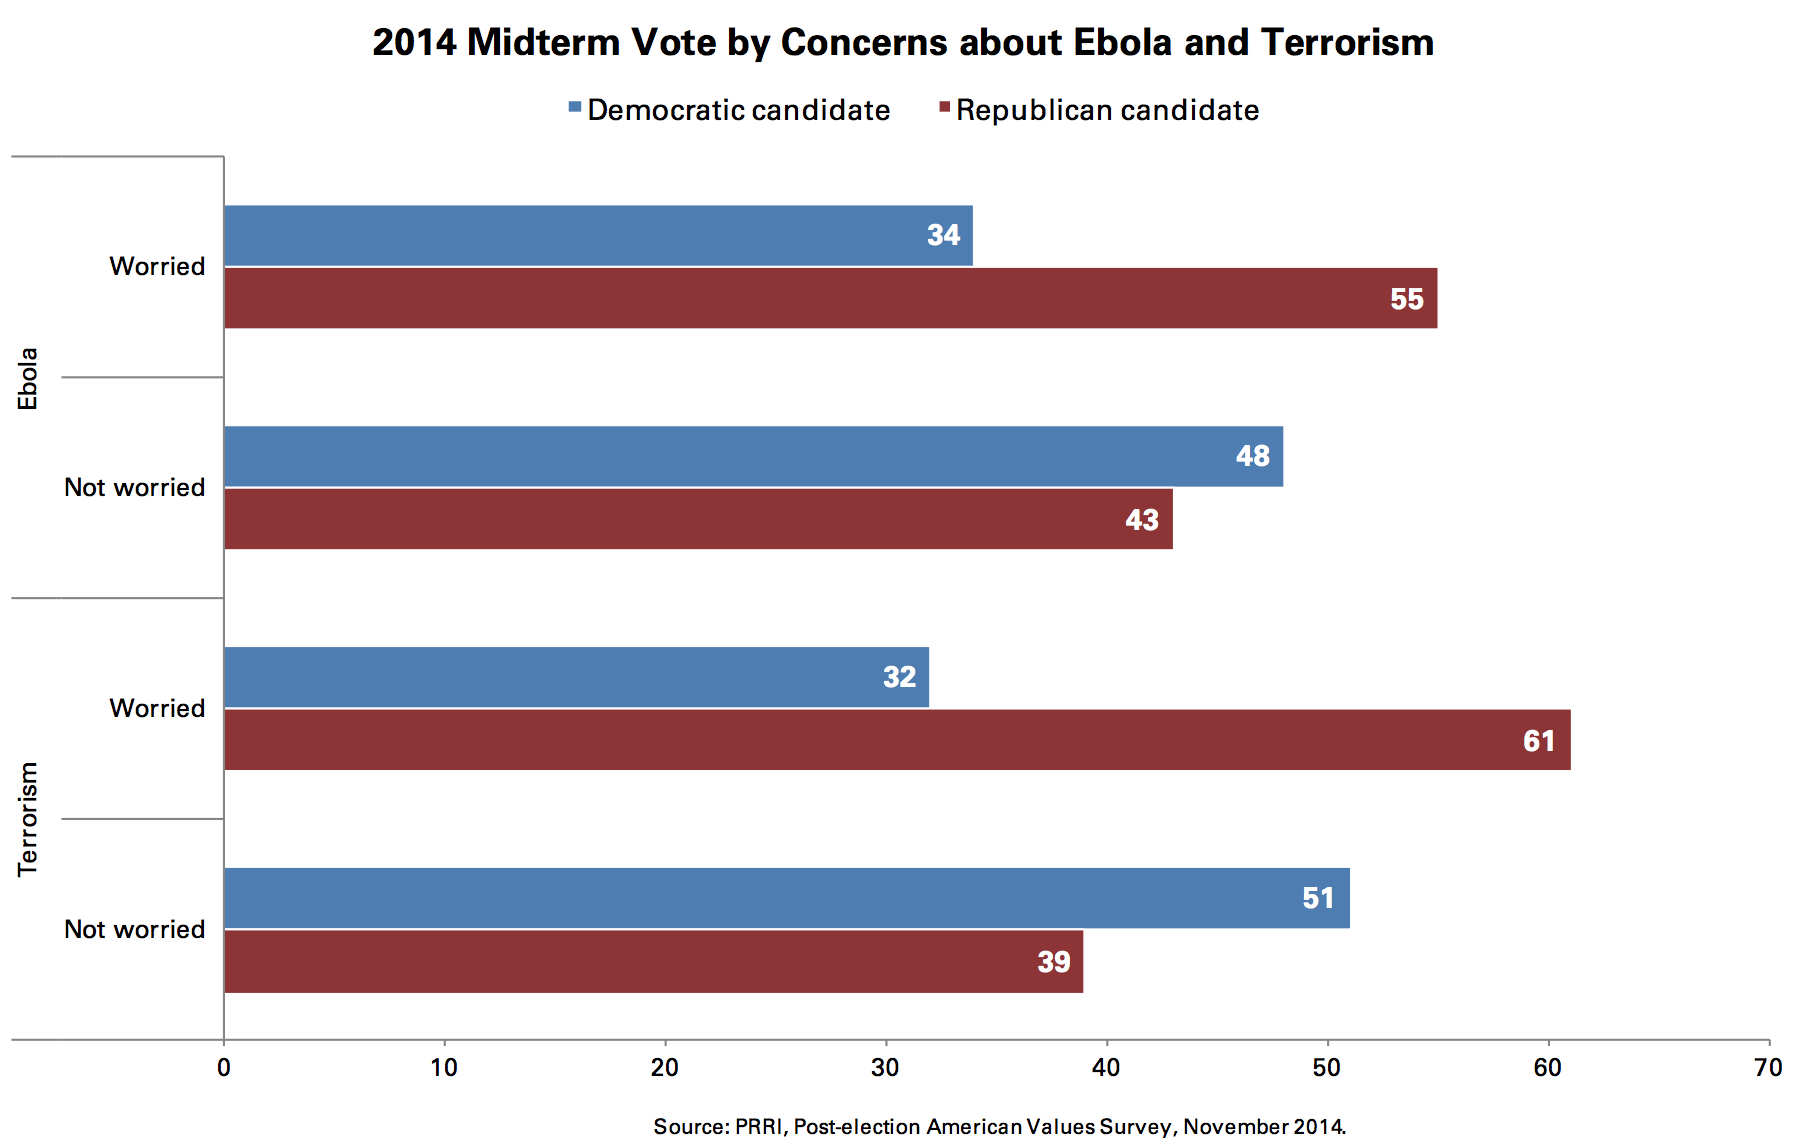
Voters who express personal concerns about either Ebola or terrorism were much more likely to support Republican candidates. A majority (55%) of voters who say they are very or somewhat worried that they or someone in their family would get sick from Ebola voted for the Republican candidate in their district, while 34% supported the Democrat. The gap was even larger among voters who express concerns about terrorism. More than 6-in-10 (61%) voters who say they are worried that they or their family member would be the victim of terrorism supported the Republican candidate in their district, while fewer than one-third (32%) voted for the Democratic candidate.
Feelings about the Election
Americans generally perceive the tone of 2014 election to be consistent with past races. Nearly half (46%) say the tone of the 2014 election was no different from past elections. More than 3-in-10 (31%) say it was more negative than in past years, and 16% say it was more positive. Perceptions of the 2010 election were slightly more downbeat: in that year, more than 4-in-10 (41%) Americans said the election was more negative than previous elections, while 31% said it was no different, and 22% said they thought it was more positive than previous elections.(13)
Americans are divided in their feelings about the outcome of the 2014 election. More than 4-in-10 Americans say they feel satisfied (34%) or excited (10%) about the outcome of the election. A similar number of Americans report being disappointed (23%) or worried (20%) about the election’s outcome, while two percent of Americans say they are angry.
Members of different political parties and movements diverge in their feelings about the election’s outcome. Eight-in-ten Republicans say they are satisfied (54%) or excited (26%) about the election results. Americans who identify with the Tea Party movement also have positive feelings about the election: 44% say they are satisfied and 34% say they are excited. In contrast, 7-in-10 Democrats say they are either disappointed (39%) or worried (31%) about the outcome.
III. Looking Ahead to 2016
Most Important Priority for Republicans and Democrats
Americans who identify as Republicans or supported Republican candidates in the 2014 election are divided about what the GOP’s top priority in Congress should be. Roughly equal numbers of Republicans and Republican voters say the GOP’s first priority should be to balance the budget (34%) or repeal the health care reform law (31%). Substantially fewer say Republican members of Congress should investigate wrongdoing by the Obama administration (12%), cut taxes for all Americans regardless of income (9%), or cut social services (5%).
There is also disagreement among Democrats and voters who supported Democratic candidates about the most important priorities for Democratic members of Congress and President Obama. Close to 3-in-10 (28%) Democrats and Democratic voters say the party’s most important priority should be to increase spending on education and infrastructure projects. Roughly one-quarter (24%) say raising the minimum wage should be the most important priority, while 1-in-5 (20%) want to ensure the health care law is fully funded. Fewer Democrats and Democratic voters say that passing comprehensive immigration reform (13%) or climate change legislation (9%) should be the most important priority for Democratic legislators and President Obama.
Views of the Political Parties
Positive Attributes: Shares Your Values, Keeps America Safe, Cares About People Like You
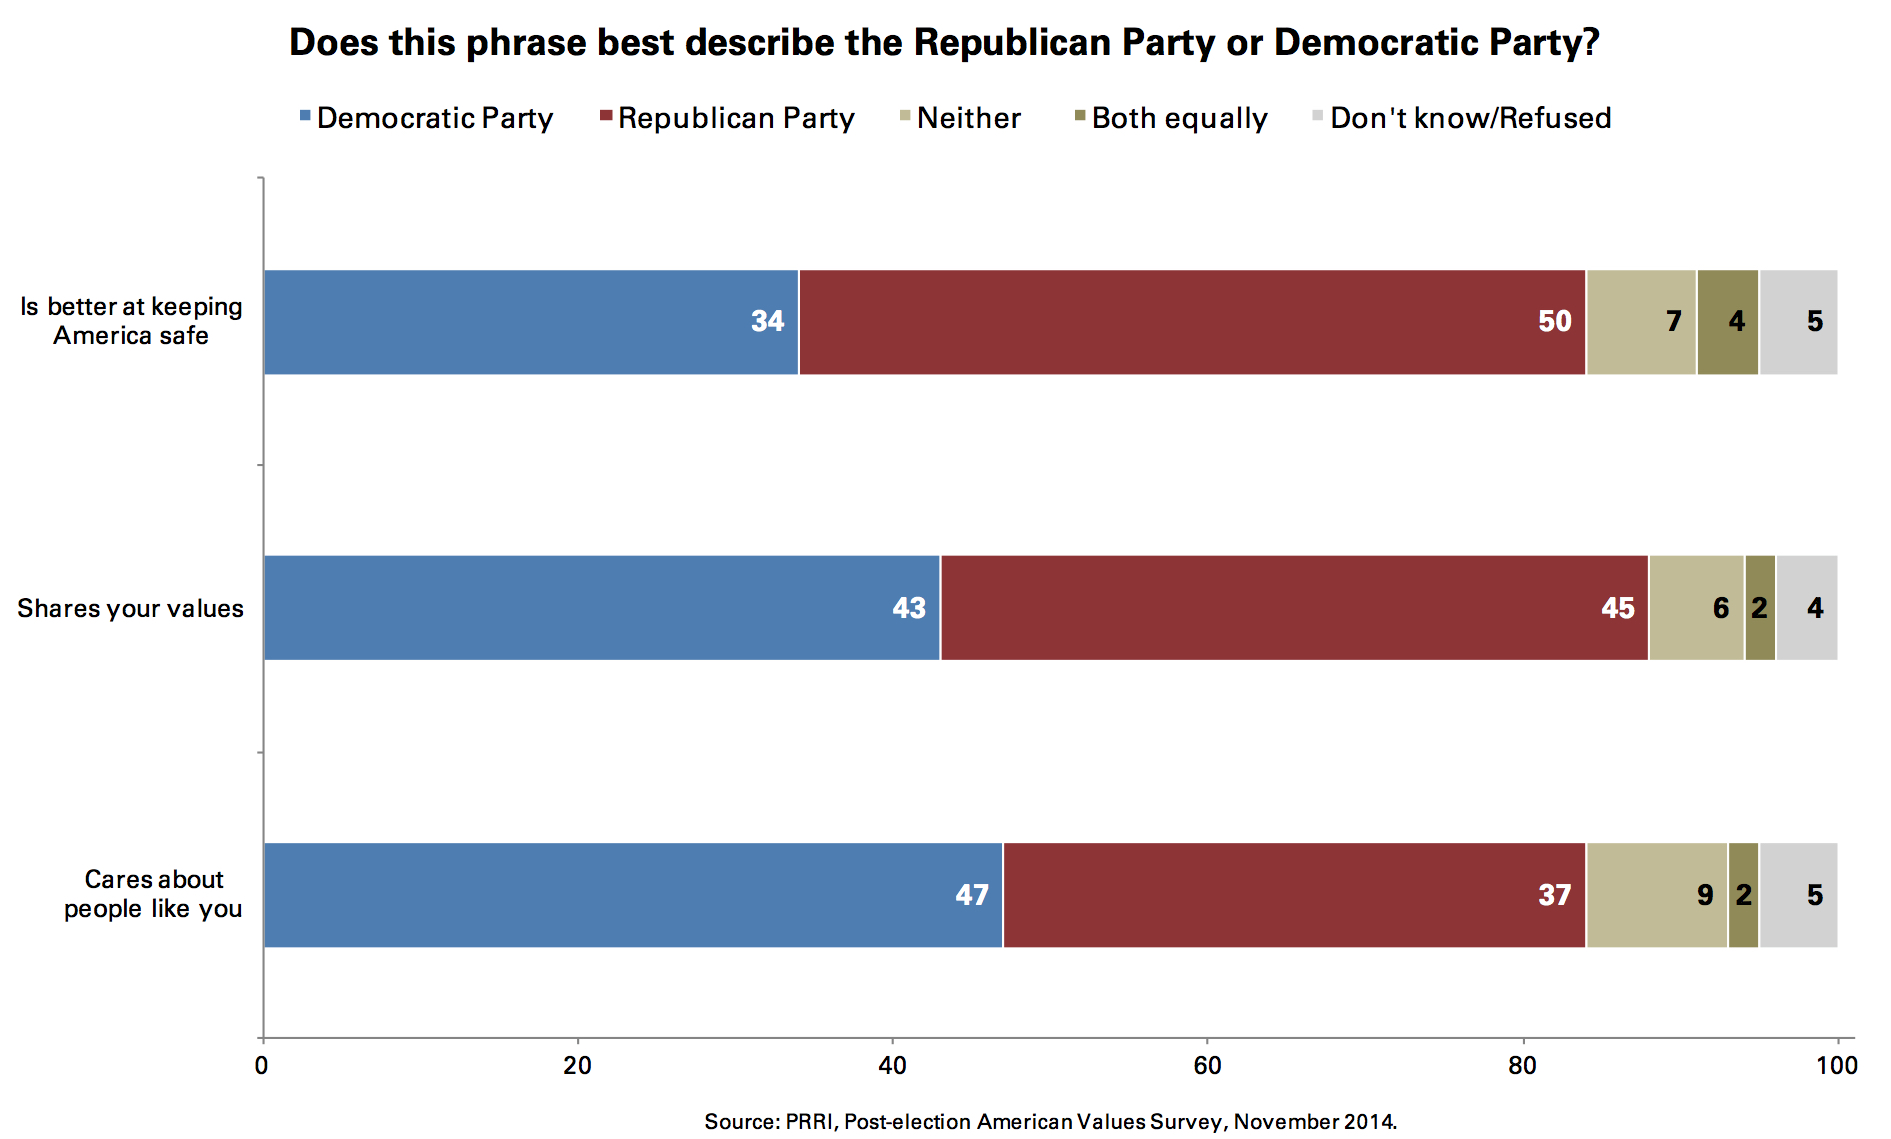
Americans are nearly equally divided on whether the phrase “shares your values” better describes the Democratic Party (43%) or the Republican Party (45%). Six percent of Americans say that the phrase applies to neither party.
There are substantial differences on this question by gender, race, social class, and religion. Half of women (50%) say the Democratic Party more than the Republican Party (40%) shares their values. In contrast, a slim majority (51%) of men say the Republican Party more than the Democratic Party (36%) shares their values.
Fifty-two percent of white Americans believe the Republican Party shares their values, while only 35% say the same about the Democratic Party. Conversely, 6-in-10 (60%) non-white Americans— including 72% of black Americans—say the Democratic Party shares their values, while 31% say the Republican Party shares their values. There are also divisions among white Americans by social class. Nearly 6-in-10 (57%) white working-class Americans believe the Republican Party shares their values, while 29% say the same of the Democratic Party. White college-educated Americans are nearly evenly divided over whether the Democratic Party (48%) or the Republican Party (44%) shares their values.
White evangelical Protestants stand out for the degree to which they believe the GOP, rather than the Democratic Party, shares their values. Nearly three-quarters (73%) of white evangelical Protestants say the GOP shares their values, compared to 19% who say this better describes the Democratic Party. Half (50%) of white mainline Protestants say the Republican Party shares their values, while 40% say the Democratic Party shares their values. Catholics are more divided about whether the Democratic Party (47%) or the Republican Party (42%) most shares their values. Majorities of religiously unaffiliated Americans (53%) and minority Protestants (59%) say the Democratic Party shares their values.
Americans are, however, substantially more likely to say that the Democratic Party cares about people like them (47%) compared to the GOP (37%). Roughly 1-in-10 (9%) Americans say that “cares about people like you” does not accurately describe either party. Some of the largest divisions on this question are by age: a majority (54%) of young adults (age 18-29) say the Democratic Party cares more about people like them, while 29% say the same of the Republicans. Opposingly, nearly half (46%) of seniors (age 65 and older) say the GOP cares more about people like them compared to the Democratic Party (38%).
However, the GOP has an advantage in the public’s perception about which party is “better able to keep America safe.” Half (50%) of Americans say that the Republican Party is better able to keep America safe, while about one-third (34%) say the same about the Democratic Party. Views about which party is better able to keep America safe are divided by gender. Nearly 6-in-10 (57%) men say the Republican Party is better able to keep America safe, while 30% say the same of the Democrats. Women, by contrast, are nearly evenly divided: 43% say the GOP is better able to keep America safe, while 38% say the same of the Democratic Party.
Negative Attributes: More Extreme, Influenced by Special Interests, Desire to Radically Transform Society
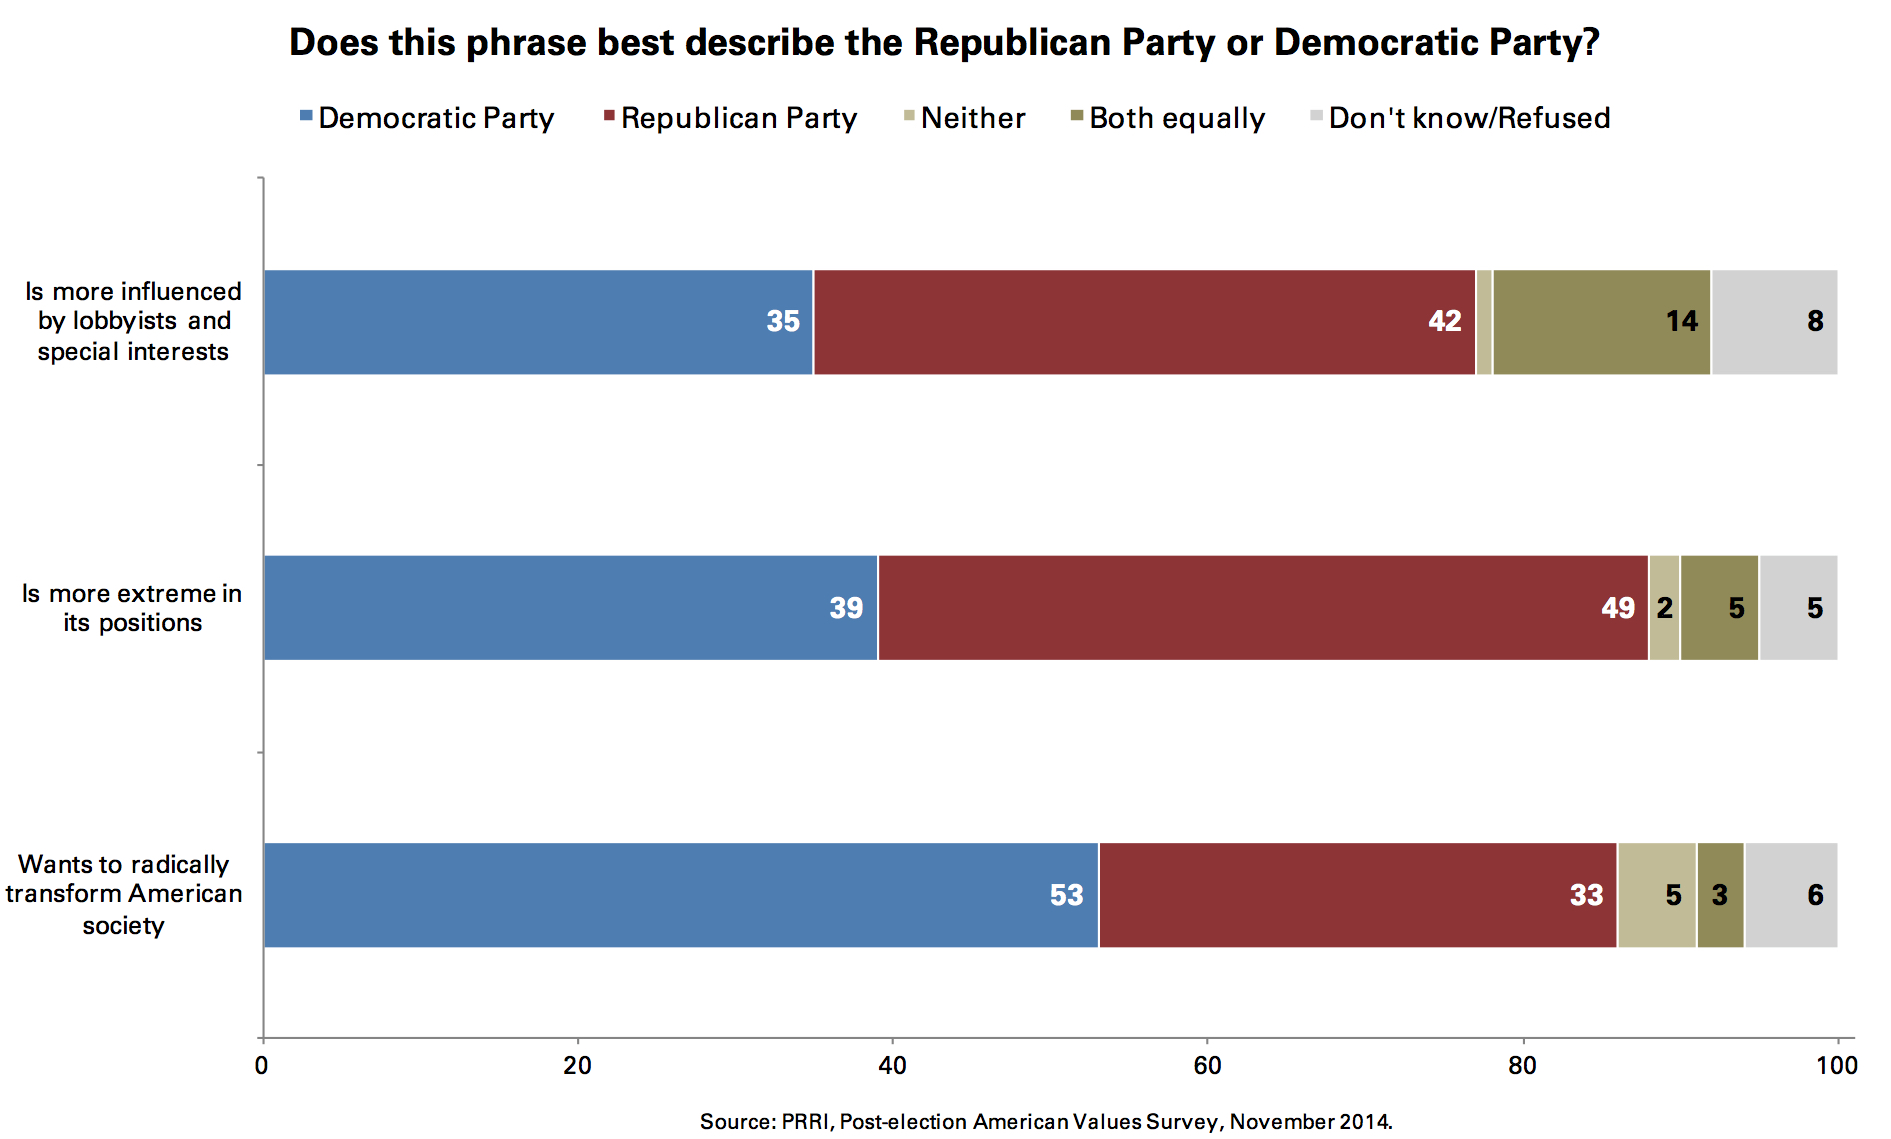
Americans are slightly more likely to say that the Republican Party is “more influenced by lobbyists and special interests” than the Democratic Party (42% vs. 35%, respectively). However, more than 1-in-10 (14%) Americans say that this characterization describes both parties equally.
Nearly half (49%) of Americans believe the GOP is the party that is “more extreme in its positions,” while nearly 4-in-10 (39%) say this better describes Democrats. Some groups are more likely than others to say Republicans are more extreme than Democrats. More than 7-in-10 liberals (78%), Democrats (76%) and black Americans (71%), and approximately 6-in-10 Americans with at least a four-year college degree (62%) and young adults (59%), say a willingness to adopt extreme positions is a characteristic that describes the Republican Party better than the Democratic Party.
Conversely, a majority (53%) of Americans say that Democrats are the party that “wants to radically transform American society,” while only one-third (33%) say this characterization better describes Republicans. Some groups are likelier than others to say Democrats want to radically transform American society. More than 8-in-10 (84%) Tea Party members, more than 7-in-10 Republicans (74%) and conservatives (71%), and approximately two-thirds (64%) of white evangelical Protestants say Democrats want to radically transform American society.
Perceptions of the Political Ideology of Parties and Leaders
Political Leaders
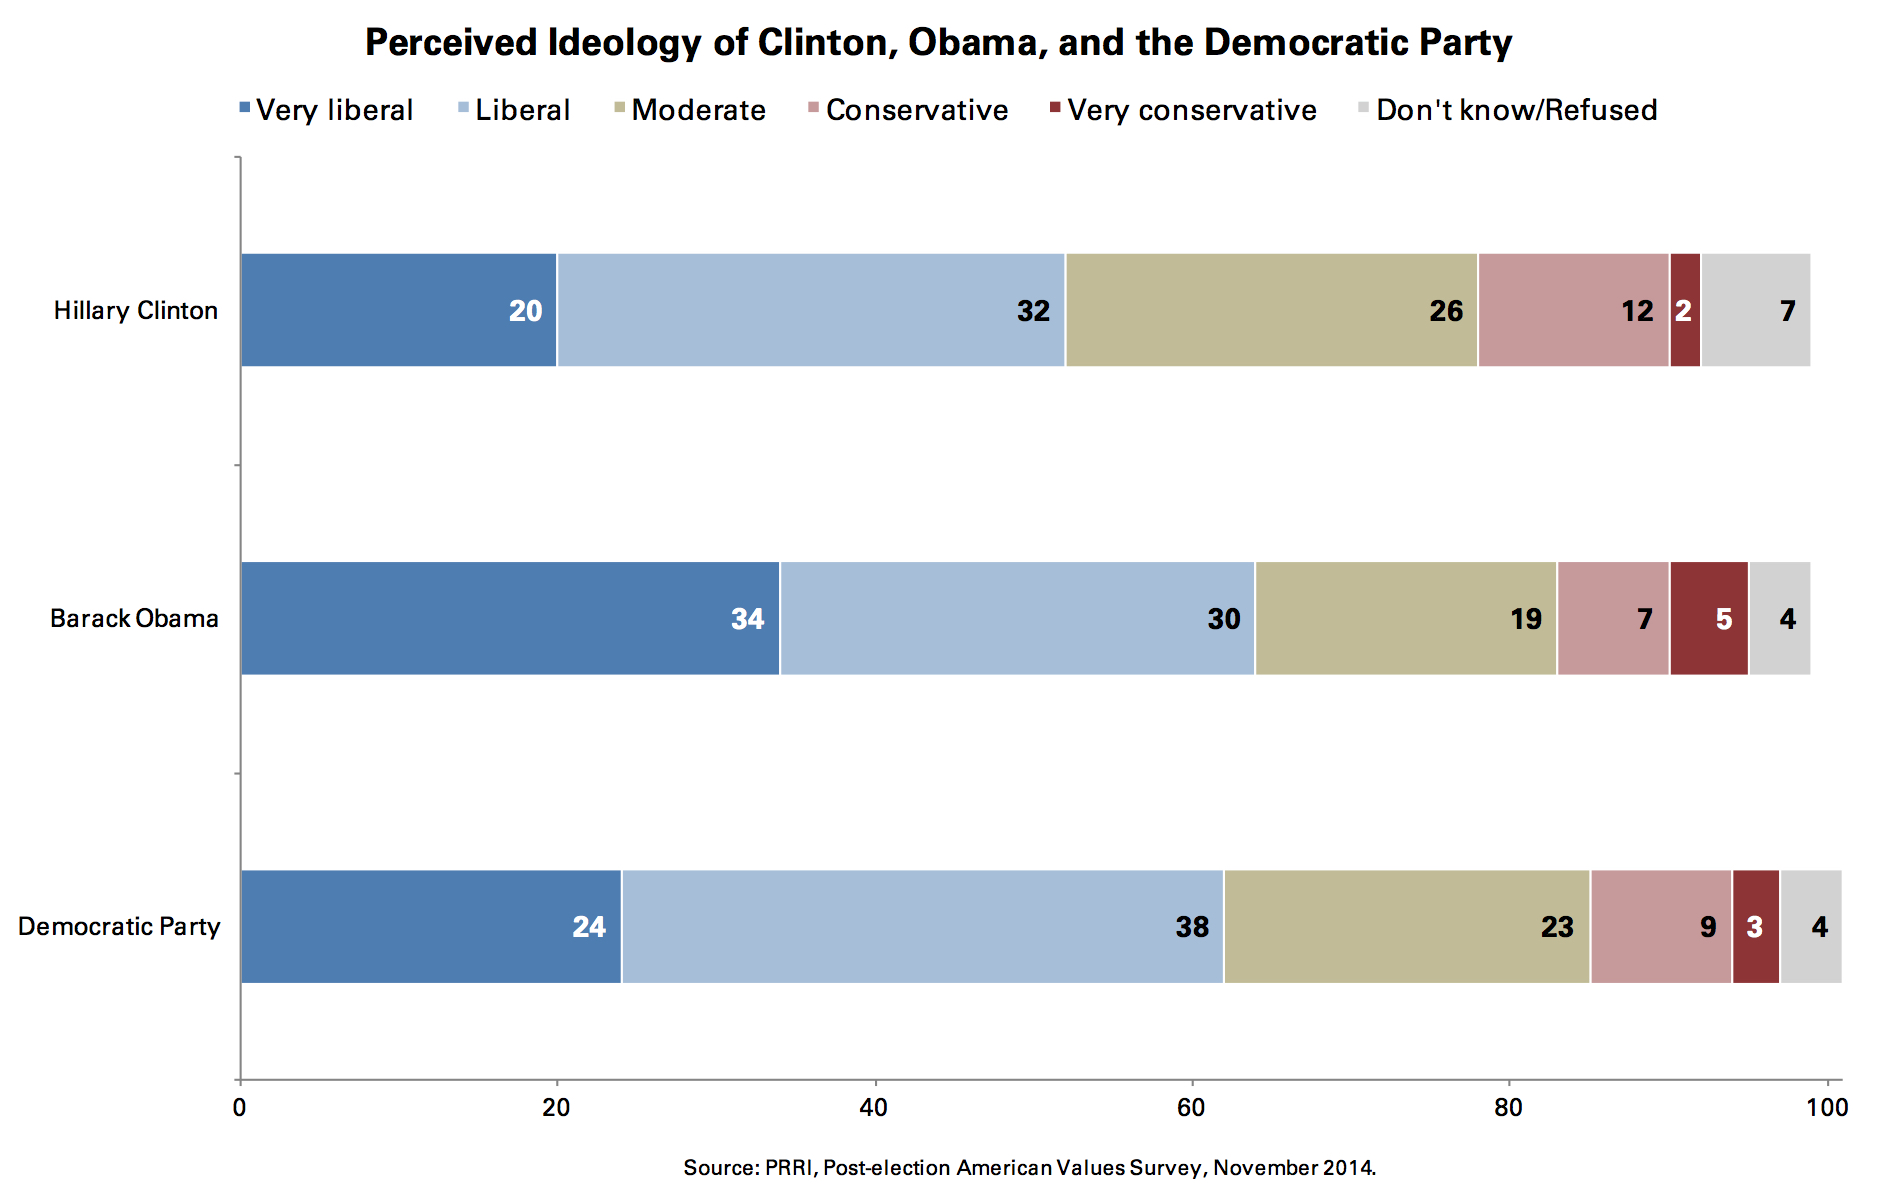
Americans are more likely to identify President Barack Obama as liberal today (64%) than they were in 2012 (57%).(14) More than one-third (34%) of Americans today believe that Obama is very liberal. Obama is also perceived to be more liberal than Hillary Clinton, his rival in the 2008 Democratic primary. A slim majority (52%) of Americans say Clinton is liberal. Views of Clinton’s ideology have not shifted since 2008, when 52% of Americans also identified her as liberal.(15) In contrast, perceptions of Mitt Romney’s political views have not changed significantly over the last two years. A majority (54%) of Americans today identify Romney as conservative, while 56% said the same in 2012.(16) Fourteen percent of Americans today are unable to locate Romney’s views on the political spectrum. More than 6-in-10 (61%) Americans say that former President George W. Bush is conservative.
The Political Parties
Americans are about as likely to identify the Democratic Party as liberal (62%) as they are to identify the Republican Party as conservative (64%). Roughly equal numbers of Americans identify the Republican Party and the Democratic Party as moderate (23% vs. 19%, respectively).
However, views of the parties have shifted over the past year. In 2013, both parties were seen as slightly more moderate: 55% of Americans said the Democratic Party was liberal, while 60% of Americans identified the GOP as conservative. At that time, the Democratic Party was more likely than the GOP to be seen as moderate (30% vs. 23%, respectively).(17)
While approximately 6-in-10 Americans see both the Tea Party (60%) and the Republican Party (64%) as generally conservative, Americans are twice as likely as to say the Tea Party is very conservative (36% vs. 18%).
Interestingly, perceptions of Obama’s political ideology are more highly correlated with views of the Democratic Party than perceptions of Clinton’s political ideology.(18) On the Republican side, perceptions of Bush’s political ideology are more closely connected to views of the GOP than perceptions of Romney’s ideology.(19)
The 2016 Election
Two years before the 2016 presidential election, the Republican field remains open. As many as five separate candidates receive double-digit levels of support from Americans who identify or lean Republican. Nearly 1-in-5 (17%) Republicans and Republican-leaning independents say they want Mitt Romney to be the 2016 Republican nominee. At least 1-in-10 say they would like to see Mike Huckabee (12%), Rand Paul (11%), Chris Christie (10%), or Jeb Bush (10%) win the party’s nomination. Fewer than 1-in-10 Republicans and Republican-leaning independents prefer Paul Ryan (9%), Rick Perry (7%), Ted Cruz (7%), or Marco Rubio (6%).
Democrats’ preferences are more concentrated. Hillary Clinton is the favorite of more than 6-in-10 (62%) Democrats and Democratic-leaning independents, while roughly 1-in-10 say they would like to see Joe Biden (11%) or Elizabeth Warren (13%) win the Democratic Party’s nomination.
IV. Race and Criminal Justice in 2014 and Beyond
A slim majority (51%) of Americans do not believe that blacks and other minorities receive treatment equal to whites in the criminal justice system, while 46% believe that they do. Current opinions about race in the criminal justice system represent a modest downward shift from August 2014, when 56% of Americans said that blacks and whites do not receive the same treatment in the criminal justice system.(20) In 2013, Americans were evenly divided over whether whites and non-whites receive equal treatment in the criminal justice system (47% agree, 47% disagree).(21)
Views about the fairness of the criminal justice system are highly stratified by race. A majority (53%) of white Americans believe that black and other minorities receive equal treatment in the criminal justice system compared to 42% who disagree. Black Americans are half as likely (24%) to affirm this statement, and 73% disagree.
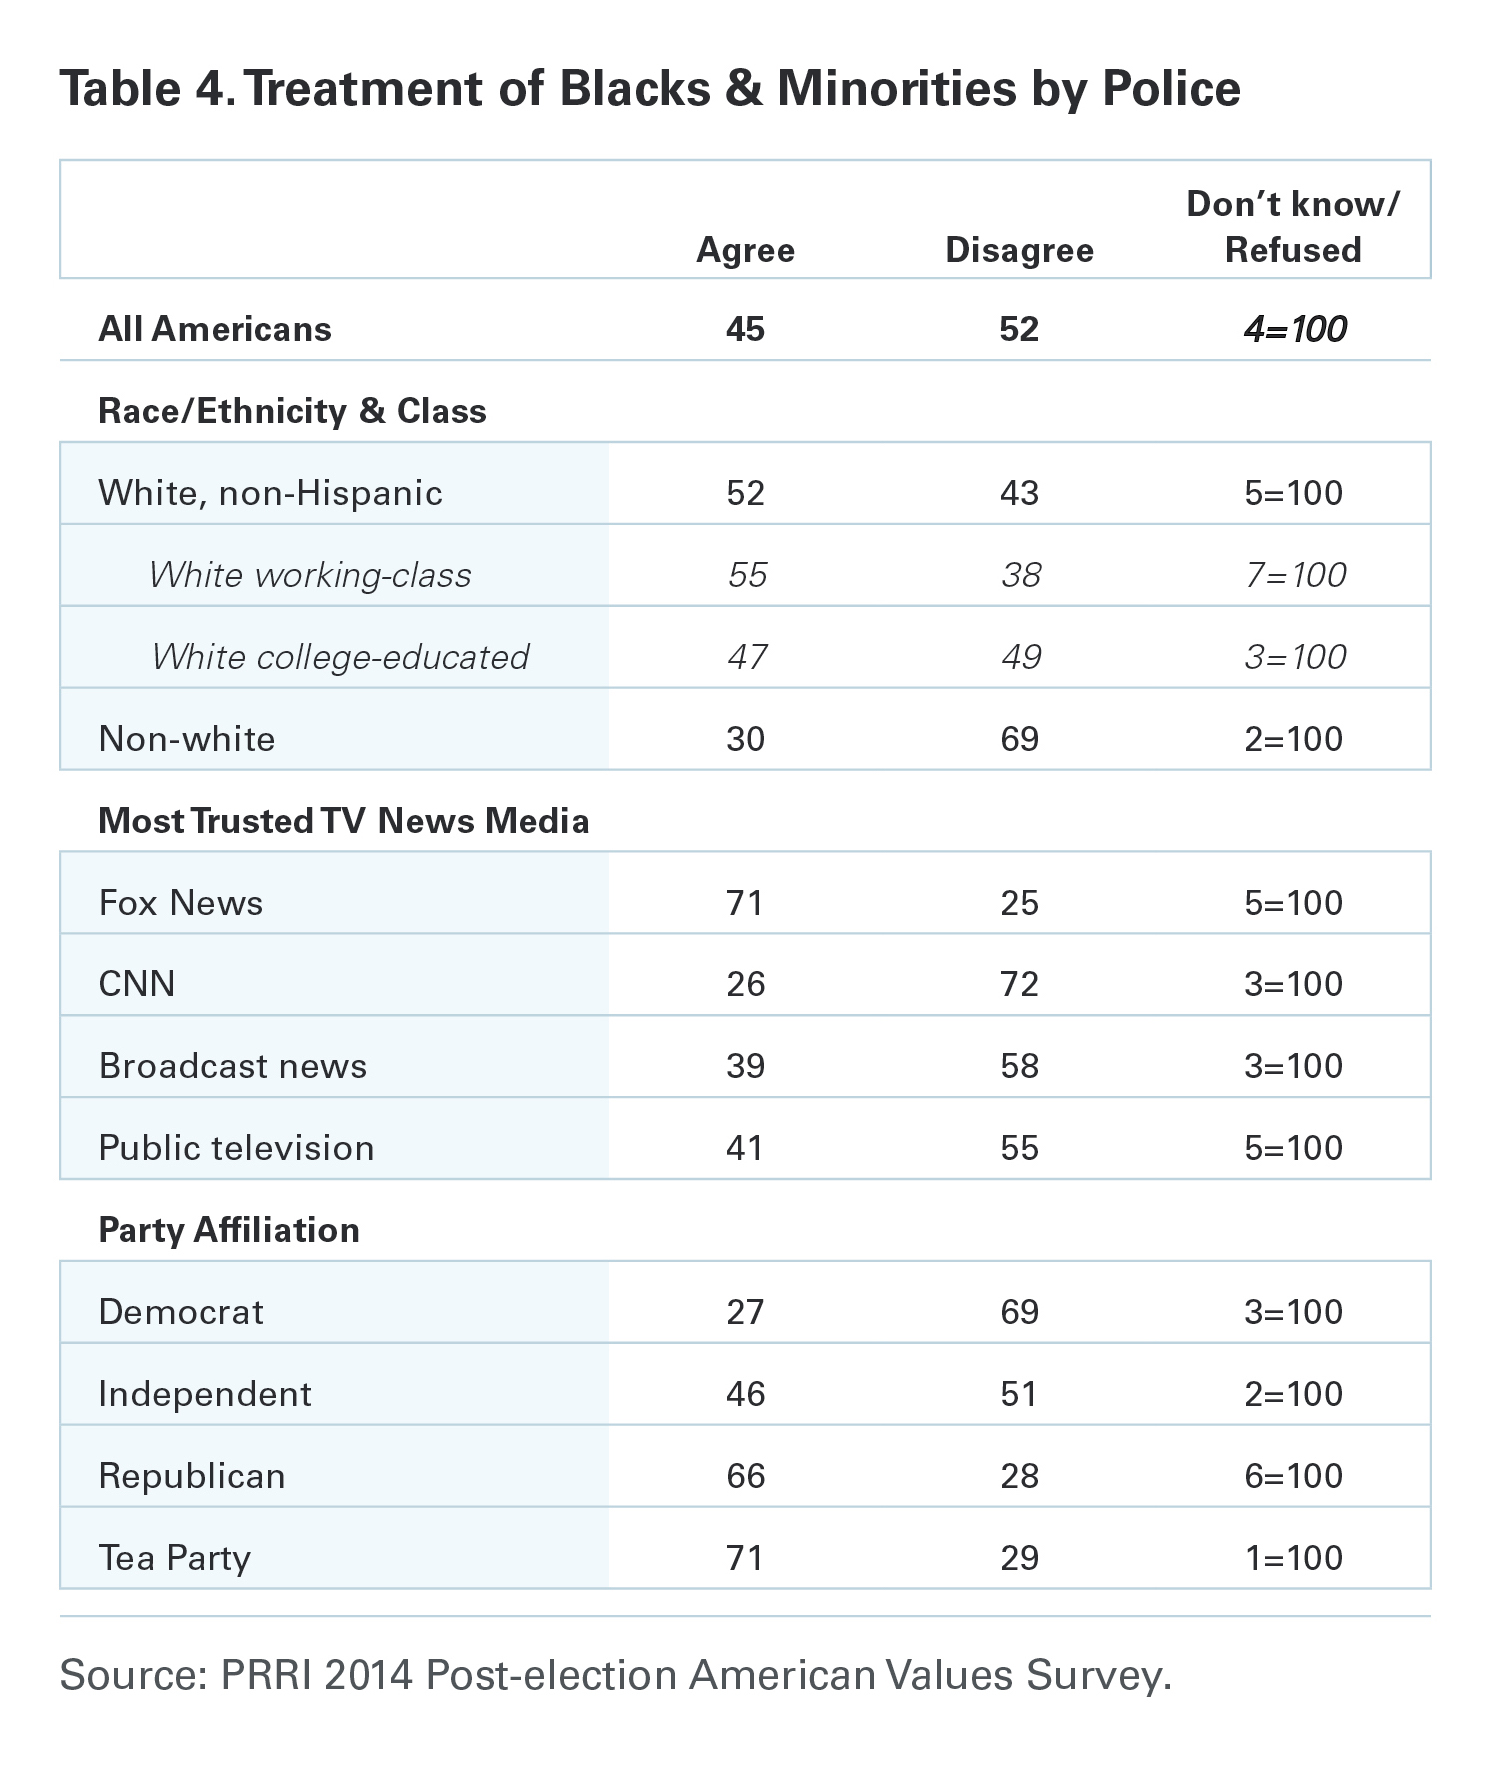
Americans’ views about the fairness of law enforcement officers largely mirror views about equity in the criminal justice system. A slim majority (52%) of Americans do not believe that police officers treat blacks and other minorities the same as whites, while close to half (45%) disagree. There are notable divisions on this question by race, political affiliation, and most-trusted media source.
Nearly two-thirds (66%) of Republicans and more than 7-in-10 (71%) Tea Party members agree that police officers generally treat blacks and other minorities the same as whites. Roughly as many Democrats (69%) disagree, while independents closely resemble the general public. A majority (52%) of white Americans also believe that police officers generally treat all people the same regardless of race, while more than 4-in-10 (43%) disagree. Three-quarters (75%) of black Americans reject this statement. More than 7-in-10 (71%) Americans who most trust Fox News agree that police generally treat people the same regardless of race. Less than half of Americans who most trust any other media source agree.
Americans generally agree that mandatory minimum sentences for nonviolent offenders should be eliminated. More than three-quarters (77%) of Americans say that mandatory minimum prison sentences for nonviolent offenders should be eliminated so that judges can make sentencing decisions on a case-by-case basis. One-in-five (20%) Americans oppose this policy change. There is bipartisan and cross-religious support for changing mandatory minimum sentences for nonviolent offenders. Approximately 8-in-10 Democrats (83%) and independents (80%) and two-thirds (66%) of Republicans support this policy. Similarly, majorities of all major religious groups—including 90% of religiously unaffiliated Americans, 76% of Catholics, 76% of minority Protestants, 76% of white mainline Protestants, and 65% of white evangelical Protestants—support eliminating mandatory minimum sentences for nonviolent offenders.
Endnotes
1 Public Religion Research Institute, Pre-election American Values Survey, September 2014. Click here for complete results.
2 Public Religion Research Institute, Post-election American Values Survey, November 2010.
3 Public Religion Research Institute, Pre-election American Values Survey, October 2012.
4 Public Religion Research Institute, Pre-election American Values Survey, October 2010.
5 According to Prof. Michael McDonald at the United States Elections Project, voter turnout among eligible voters was estimated at 36.3% in 2014 compared to 40.9% in 2010. See http://www.electproject.org/2014g, accessed November 10, 2014.
6 Public Religion Research Institute, Post-election American Values Survey, November 2010.
7 Throughout this section, “Republican voters” and “Democratic voters” refer to voters who supported Republican candidates or Democratic candidates, respectively, in the 2014 midterm election.
8 According to the 2014 National Election Pool Exit Polls, the national two-party vote for the U.S. House of Representatives was 53% for Republican candidates and 47% for Democratic candidates. PRRI’s post-election American Values Survey finds 46% of midterm voters reporting that they voted for Republican candidates, 45% reporting that they voted for Democratic candidates, 2% reporting that they voted for third party candidates, and 7% who refused the question. For comparison, PRRI’s post-election vote results can be recalculated by reclassifying conservative-leaning third party voters as Republican voters and excluding respondents who refused to identify their vote preference. Using this method, PRRI’s two-party vote results are 52% for Republican candidates and 48% for Democratic candidates.
9 Public Religion Research Institute, Post-election American Values Survey, November 2012.
10 Vote preferences for minority Protestant voters should be interpreted with some caution because the unweighted sample size for this group is fewer than 100 cases (N=95).
11 Public Religion Research Institute, Post-election American Values Survey, November 2012.
12 Respondents were asked about issue priorities in the 2014 Pre-election American Values Survey.
13 PRRI/RNS, Religion News Survey, November 2010.
14 Public Religion Research Institute, Post-election American Values Survey, November 2012.
15 Pew Research Center for the People & the Press Political Survey, May 2008.
16 Public Religion Research Institute, Post-election American Values Survey, November 2012.
17 Public Religion Research Institute, American Values Survey, October 2013.
18 Perceptions of Obama’s political views and the Democratic Party are highly correlated (0.64) while perceptions of Clinton’s political views are less tightly associated with perceptions of the Democratic Party (0.56). Americans who did not offer a response were not included in this analysis.
19 There is significant correlation between perceptions of Bush’s political views and those of the Republican Party (0.61). Perceptions of Romney’s political views are less closely tied to perceptions of the GOP (0.53). Americans who did not offer a response were not included in this analysis.
20 In the 2014 Pre-election American Values Survey, a majority (56%) of Americans said that blacks and other minorities did not receive the same treatment as whites. The field period for the survey was from July 21 to August 15—before, during, and after the shooting of Michael Brown in Ferguson, Missouri.
21 Public Religion Research Institute, Religion & Politics Tracking Survey, August 2013.
Recommended citation:
Jones, Robert P., Daniel Cox, and Juhem Navarro-Rivera. “What Motivated Voters during the Midterm Elections?: 2014 Post-election American Values Survey.” PRRI. 2014. http://www.prri.org/research/survey-2014-post-election-american-values-survey-what-motivated-voters-during-the-midterm-elections/.