Executive Summary
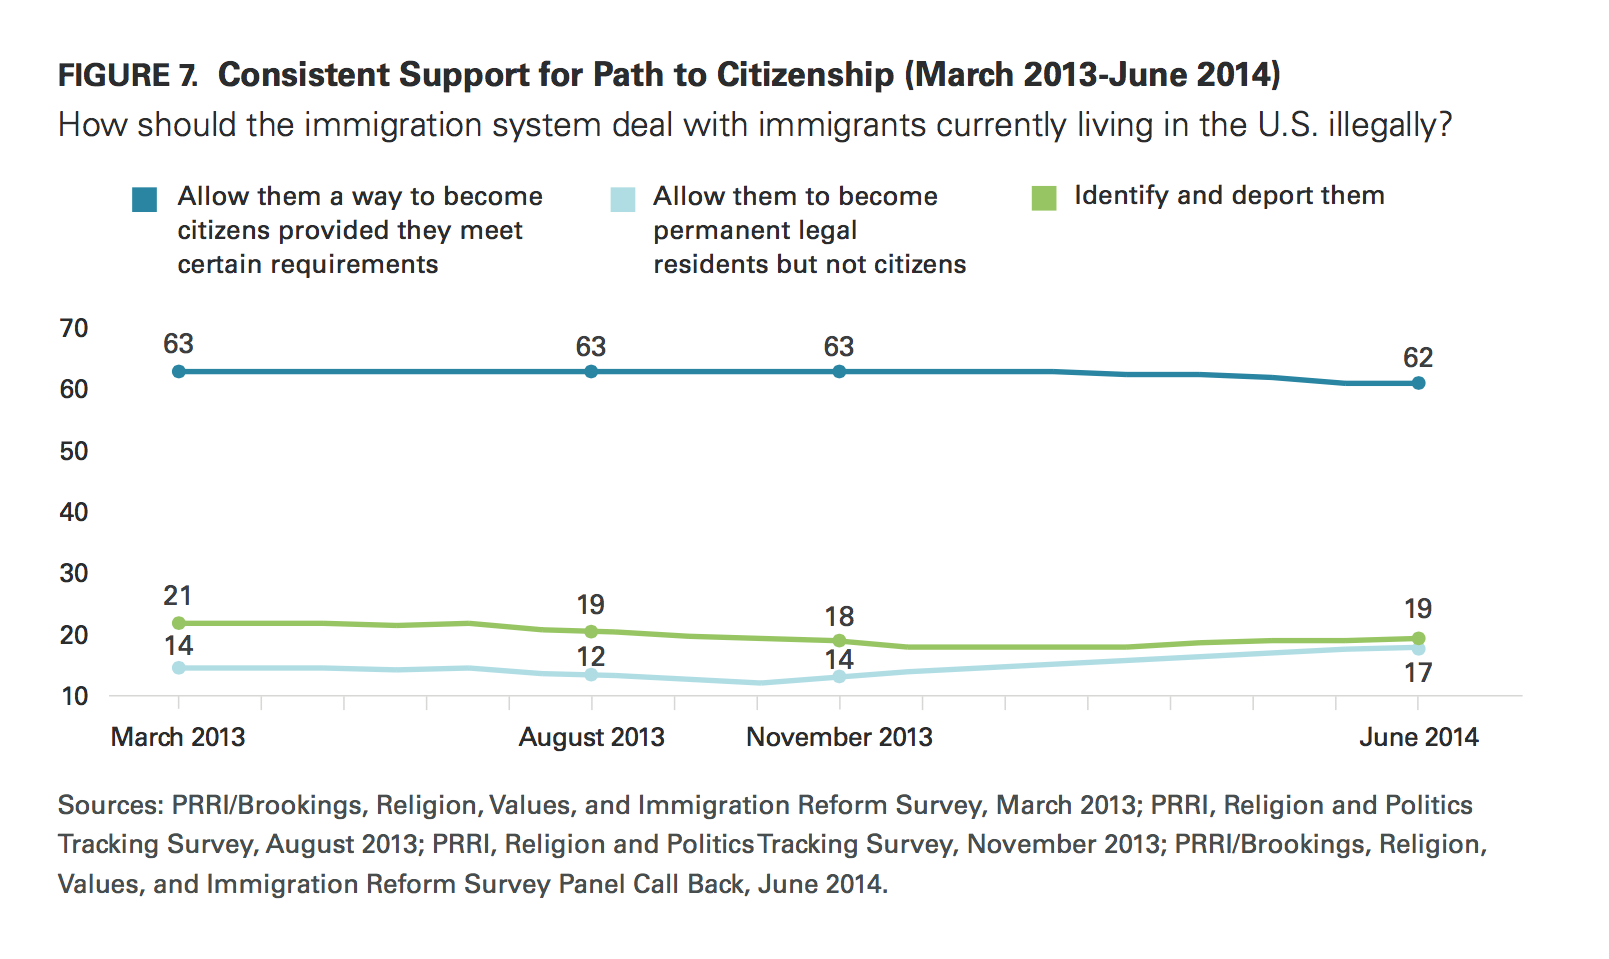
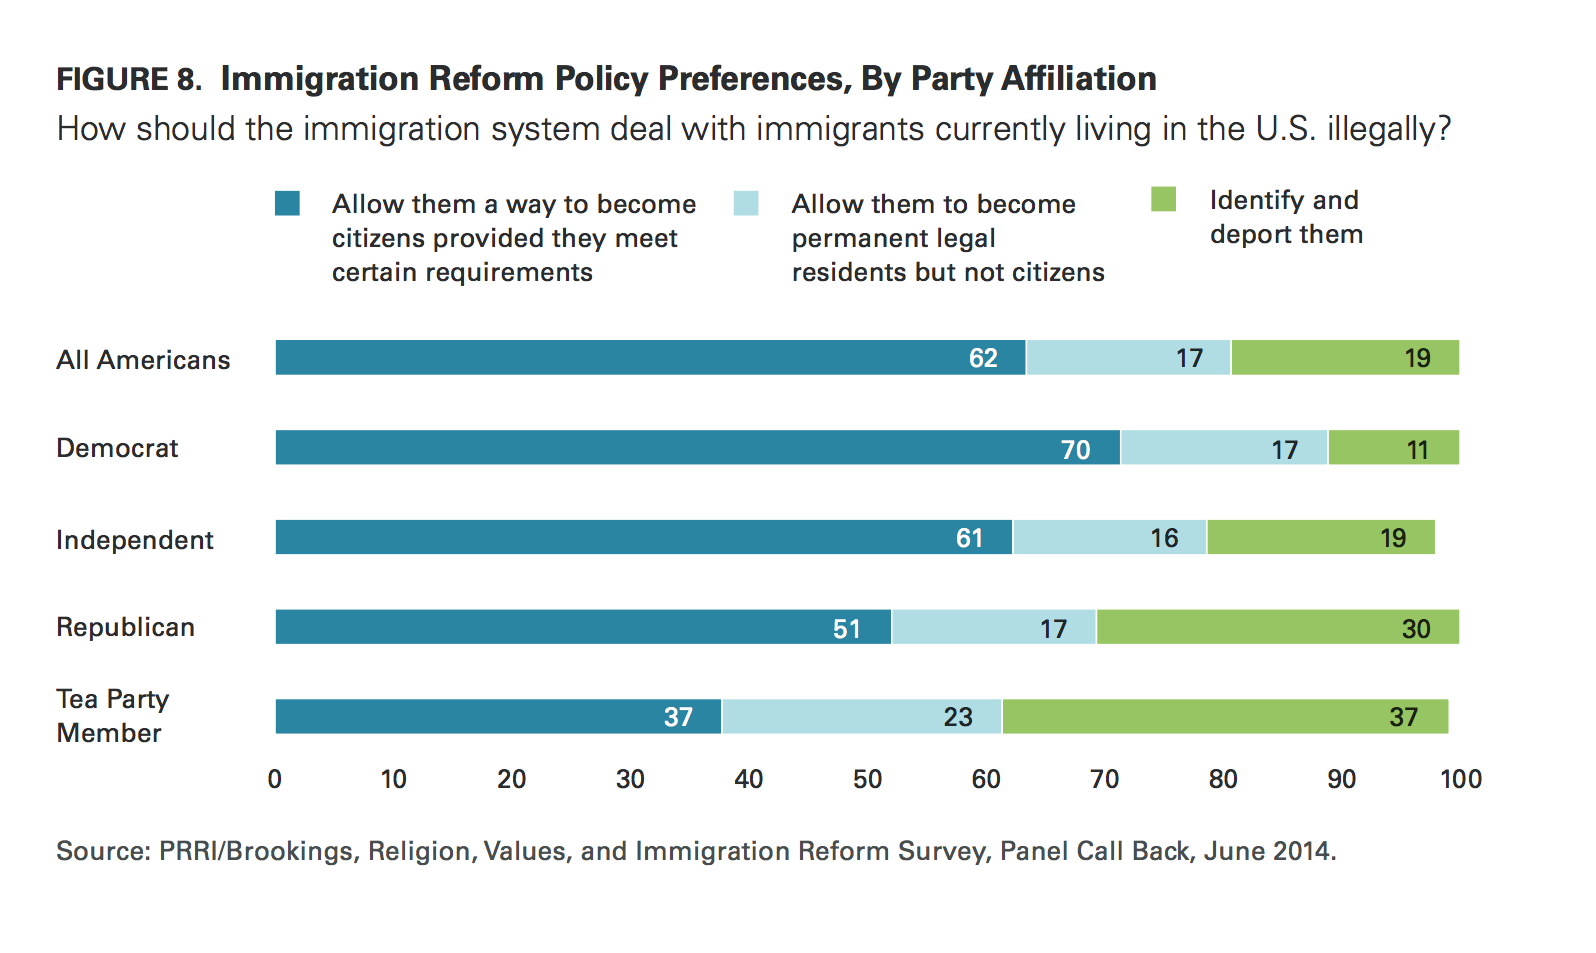
 At present, 62% of Americans favor providing a way for immigrants who are currently living in the United States illegally to become citizens provided they meet certain requirements, while 17% support allowing them to become permanent legal residents but not citizens, and roughly 1-in-5 (19%) favor a policy that would identify and deport all immigrants living in the United States illegally.
- Current support for a path to citizenship is nearly identical to support levels one year ago (March 2013) when 63% of Americans supported a path to citizenship for immigrants who are living in the United States illegally.
The issue of immigration reform has support across party lines, although there are notable differences in the intensity of support.
- Consistent with findings from March 2013, majorities of self-identified Democrats (70%), independents (61%), and Republicans (51%) continue to favor a path to citizenship for immigrants living in the country illegally. Notably, Republicans are roughly three-times more likely than Democrats to favor identifying and deporting all immigrants living in the U.S. illegally (30% vs. 11%).
- Less than 4-in-10 (37%) Americans who are part of the Tea Party movement favor allowing immigrants living in the U.S. illegally to become U.S. citizens, while 23% favor allowing them to become permanent legal residents but not citizens; notably, 37% favor a policy that would identify and deport all immigrants in the U.S. illegally, the highest among all partisan groups.
- Only 42% of Republicans who most trust Fox News to provide accurate information about politics and current events support a path to citizenship, compared to 60% of Republicans who most trust other news sources.
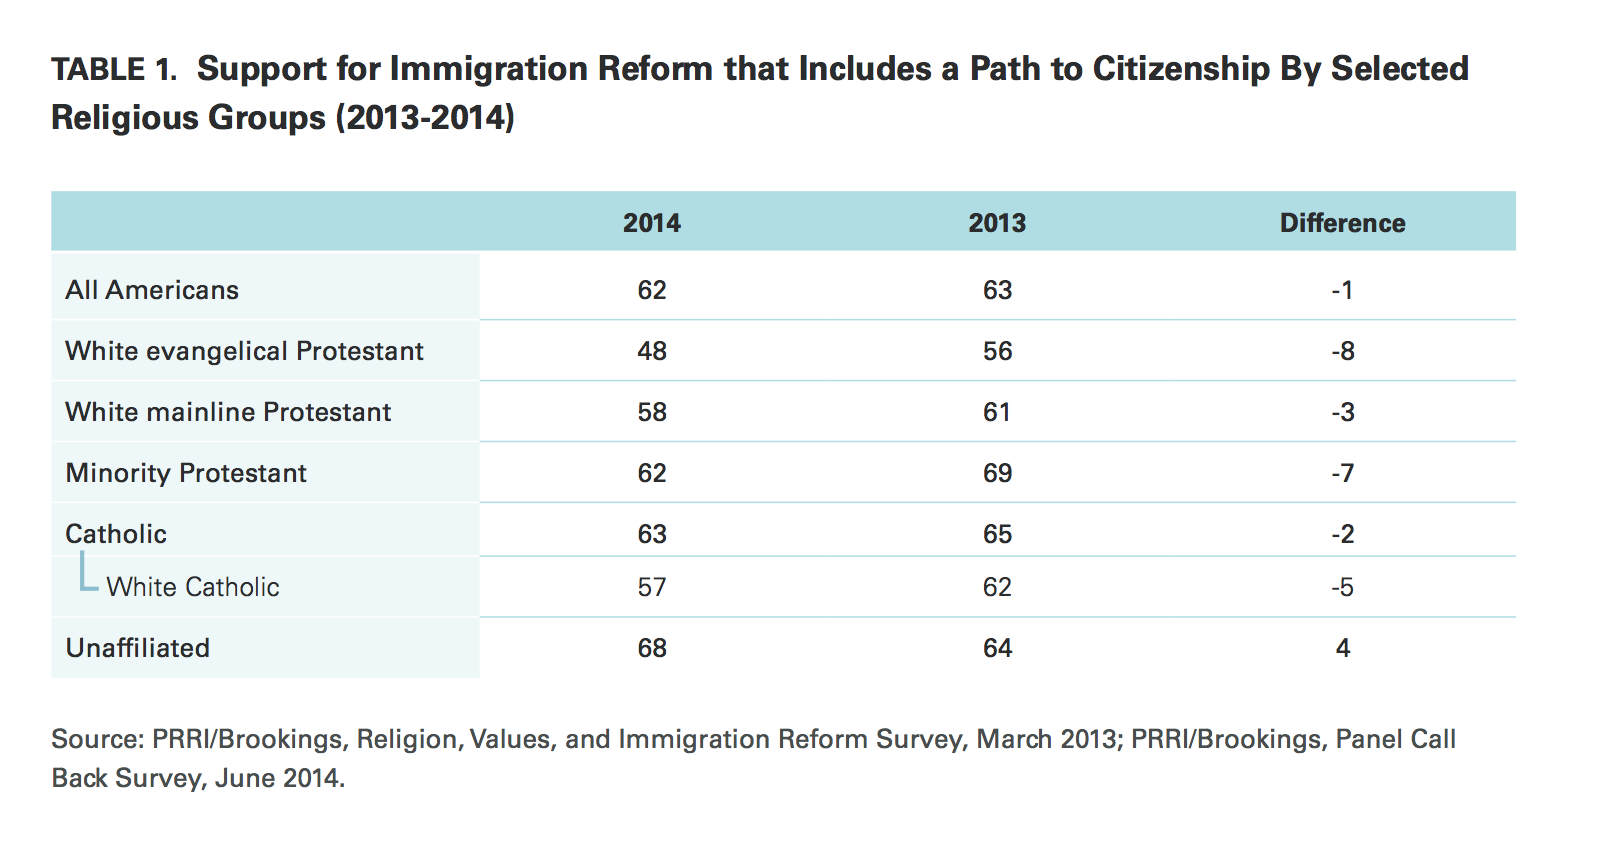
Majorities of all religious groups, with the exception of white evangelical Protestants, support a path to citizenship, including roughly 6-in-10 white mainline Protestants (58%), minority Protestants (62%) and Catholics (63%), and more than two-thirds (68%) of religiously unaffiliated Americans.
- Among white evangelical Protestants, nearly half (48%) also favor allowing immigrants living in the U.S. illegally an opportunity to become citizens provided they meet certain requirements, an 8-point drop from March 2013 when 56% supported a path to citizenship.
A statistical model demonstrates that certain traits independently predict either support for or opposition to immigration reform that includes a path to citizenship for immigrants living in the U.S. illegally.
- The two most powerful independent predictors of support for a path to citizenship are being young (under 30 years of age) and identifying as Hispanic. Holding a four-year college degree, being female, identifying with the Democratic Party, and most trusting MSNBC as an accurate news source are also significant predictors of support for immigration reform.
- In contrast, trust in Fox News as an accurate news source is the most powerful independent predictor of opposition to a path to citizenship. Identifying as Republican and being a born-again Christian are also significant predictors of opposition to immigration reform that includes a path to citizenship.
Americans continue to favor allowing immigrants living in the country illegally who were brought to the U.S. as children to gain legal resident status if they join the military or go to college, a policy which comprises the basic elements of the DREAM Act.
- More than two-thirds (68%) of Americans favor this policy, while three-in-ten (30%) are opposed.
- Eight-in-ten (80%) Democrats and more than two-thirds (68%) of independents favor the basic tenets of the DREAM Act, as do a slim majority (52%) of Republicans.
Compared to one year ago, Americans’ political priorities are largely unchanged.
- Today, one-quarter (26%) of Americans say that reforming the nation’s immigration system should be the highest priority for the president and Congress, while 47% of Americans report that reforming the immigration system should be a high priority but not the highest, and one-quarter (25%) think that immigration reform should be given a lower priority.
- Democrats (28%) and Republicans (28%) are equally likely to say that reforming the nation’s immigration system should be the highest priority, while independents rank it somewhat lower (25%).
Most Americans believe the immigration system in the United States is broken.
- Less than 1-in-10 (6%) Americans believe that the immigration system is generally working, while 31% say it is working but with some major problems.
- Nearly four-in-ten (38%) Americans report that the current immigration system is broken but working in some areas, while 23% say it is completely broken. These views remain essentially unchanged over the last year.
Although deportations of immigrants who are in the country illegally have increased since the beginning of the Obama administration, only one-quarter (25%) of Americans correctly state that deportations have increased over the past five or six years. Close to half (45%) of Americans believe that the number of deportations has stayed the same, while nearly 1-in-5 (18%) say deportations have decreased. Public knowledge about the level of deportations has remained unchanged since last year.
- Democrats (30%) and independents (27%) are more likely than Republicans (18%) to report correctly that the number of deportations has increased over the past five or six years.
- Only 12% of Americans who most trust Fox News for accurate information about politics and current events correctly believe deportations have increased.
Compared to one year ago, Americans are less likely to say that immigrants are having a negative economic impact on the country.
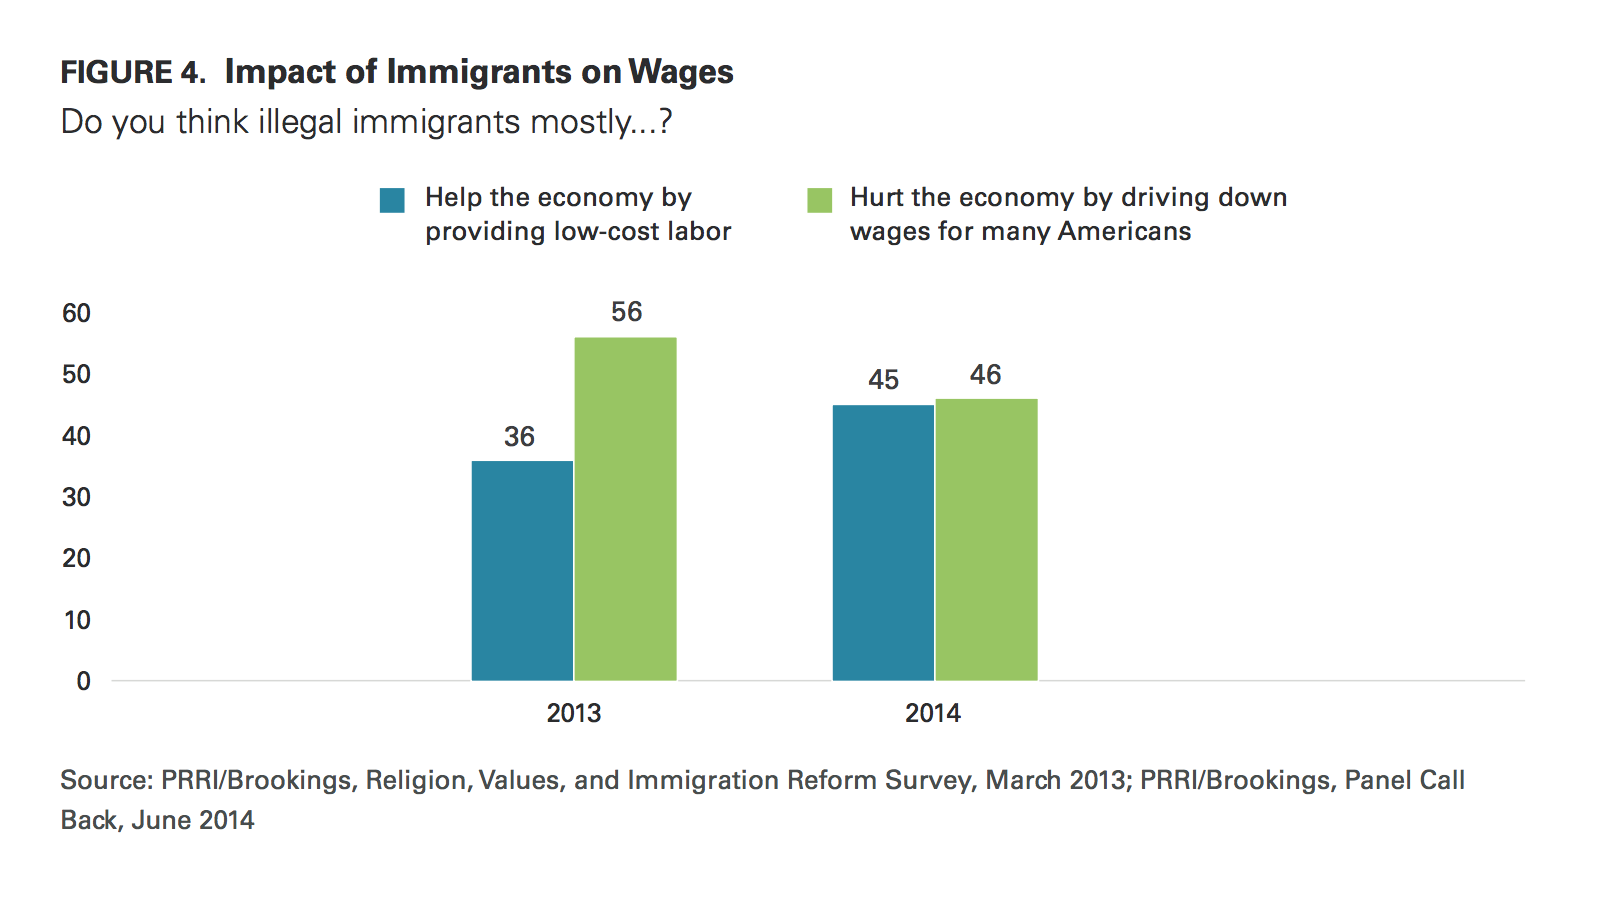
- Today, Americans are equally as likely to believe that illegal immigration helps the economy by providing low-cost labor (45%) as they are to say that it hurts the economy by driving down wages (46%). In March 2013, a majority (56%) of Americans said that illegal immigrants negatively impact the economy by driving down wages.
- Seven-in-ten (70%) Americans now say that immigrants coming to the country today mostly take jobs Americans do not want, while only 22% say they take jobs away from American citizens. Last year, Americans were somewhat less likely to say immigrants are taking unwanted jobs (64%).
American attitudes about the cultural impact of immigrants have also been moving in a more positive direction over the last year.
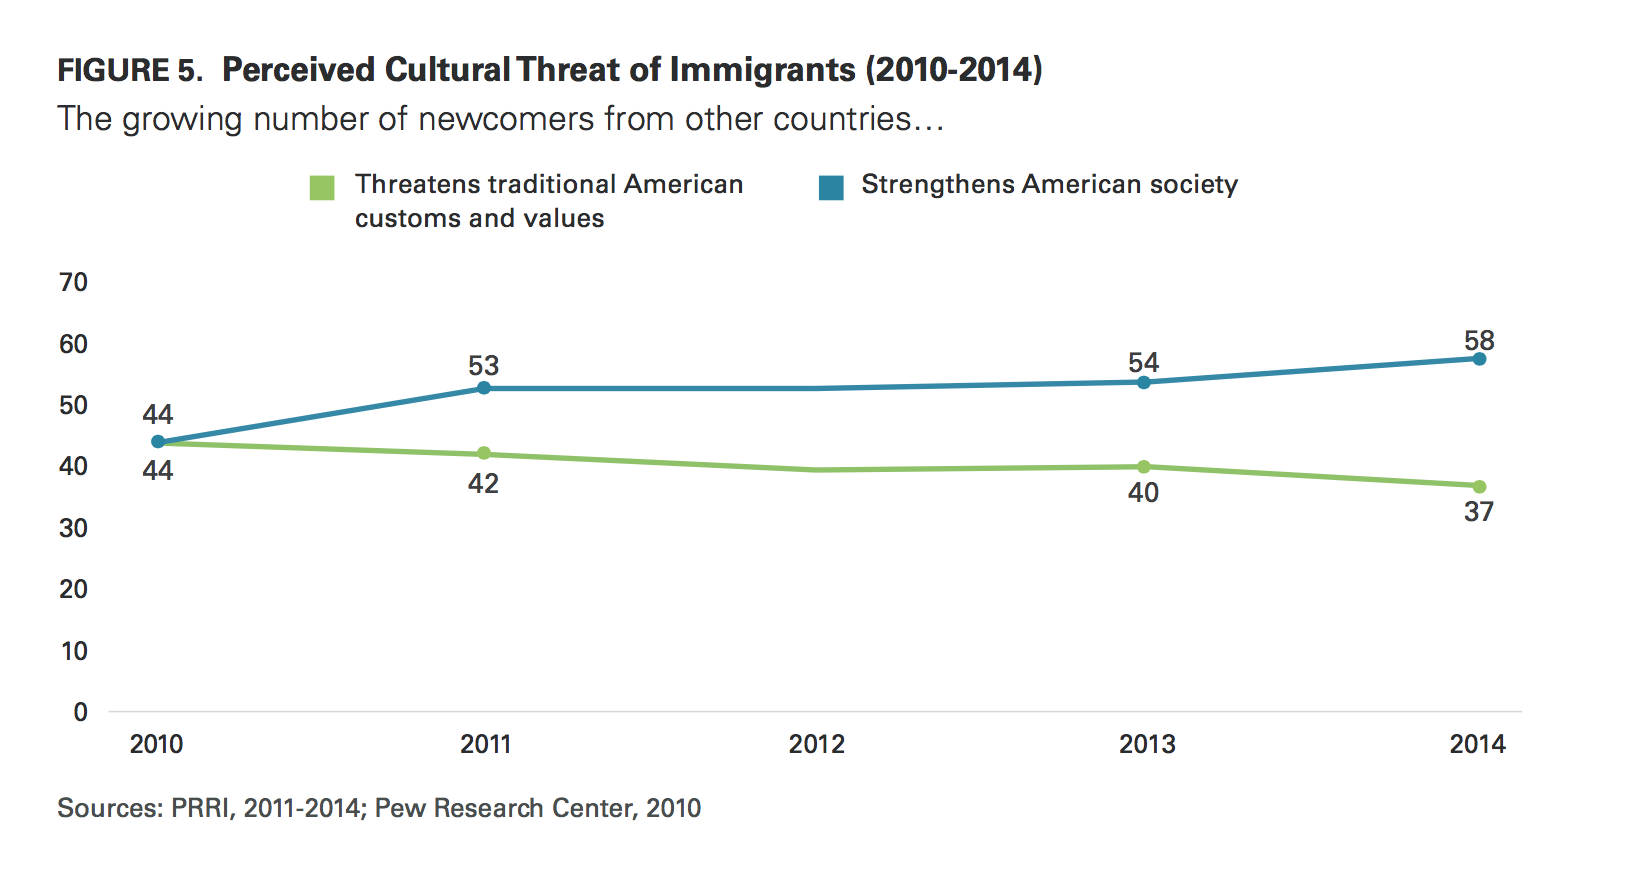
- Today, nearly 6-in-10 (58%) Americans say that the growing number of newcomers from other countries strengthens American society compared to 37% who say that newcomers threaten traditional American customs and values.
- As recently as 2010, Americans were divided in their views about the influence immigrants were having on American society; 44% said they threaten traditional customs and values while equal numbers (44%) said they strengthen American society.
Consistent with findings one year ago, more Americans say they trust the Democratic Party over the Republican Party to handle the issue of immigration. Close to half (46%) of Americans say they most trust the Democratic Party to handle the issue, while 33% say they most trust the GOP. Fourteen percent say they do not trust either party to handle the issue of immigration.
Among all registered voters, opposing immigration reform is more of a liability for candidates than an asset.
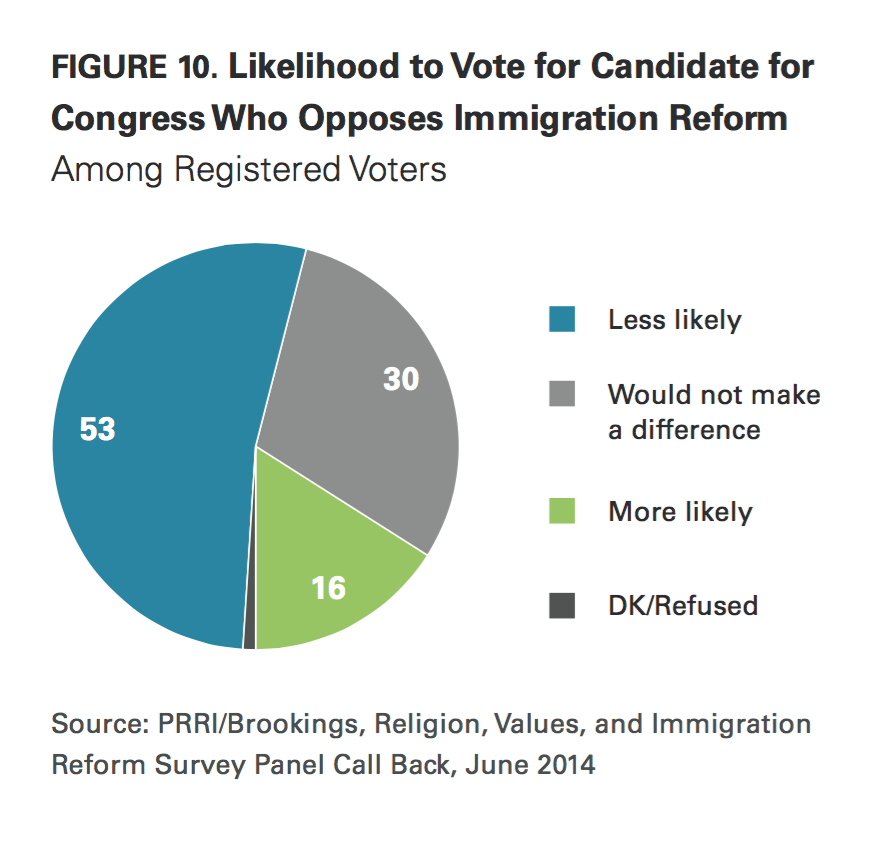
- Fifty-three percent of voters say they would be less willing to vote for a candidate who opposes immigration reform that includes a path to citizenship for immigrants currently living in the U.S. illegally. Only 16 percent say they would be more likely to support a candidate who opposes immigration reform, while 30 percent say that a candidate’s position on this issue would make no difference to their vote.
- Even among Republican voters, opposing immigration reform carries more political risk than benefit. Nearly half (46%( of Republican voters say they would be less likely to vote for a candidate who opposes immigration reform that includes a path to citizenship, while 21% say they would be more likely to support such a candidate. Three-in-ten (30%) Republican voters say it would not make a difference to their vote either way.
- Among religious voters, opposing immigration reform that includes a path to citizenship is also more of a liability than an asset. Among all major religious groups, at least twice as many voters say they would be less likely to support a candidate who opposes a path to citizenship as say they would be more likely to support such a candidate.
Nearly 4-in-10 (37%) voters believe the Republican Party’s position on immigration reform will hurt the GOP in the 2014 elections, compared to only 11% who say it will help the party. A plurality (44%) of voters believe the GOP’s current position on immigration will not have any discernible effect on the party’s fortunes in 2014.
At this point in the 2014 election season, Americans are relatively disengaged.
- Only 16 percent say they are following news about the 2014 congressional campaigns in their district or state very closely.
- Only about half (51%) the public say they are absolutely sure of voting in the 2014 congressional election. Roughly 1-in-5 (21%) say they will probably vote, while one-quarter (25%) say their chances of voting are 50-50 or less.
I. The Current Political Context
Dissatisfaction with the Direction of Country Increases
Over the last year, Americans have grown increasingly pessimistic about the way things are going in the country. Specifically, between 2013 and 2014, dissatisfaction with the direction of the country rose from 58% to 64%; only 31% of Americans report being satisfied with the direction of the country today.1 The uptick in dissatisfaction is driven entirely by Republicans and independents. Similar to a year ago, Democrats are roughly divided with 49% expressing satisfaction about the direction of the country, while 44% are dissatisfied. By contrast, Republicans’ dissatisfaction has risen from 81% to 88% and independents’ dissatisfaction has risen from 60% to 66% over the last year. There are also notable racial differences. Among white Americans and black Americans, evaluations of the direction of the country have not shifted over the last year. More than two-thirds (68%) of white Americans are dissatisfied with the direction of the country, similar to the number who reported feeling that way in 2013. A majority (53%) of black Americans say they are satisfied with the way things are going in the United States today. Sentiments among Hispanics, however, have turned considerably more negative over the past year. One year ago, fewer than 4-in-10 (39%) Hispanics were dissatisfied with the direction of the country, compared to 58% today.2
President Obama’s Job Approval Rating Drops
President Barack Obama’s approval rating has dropped over the past year. Currently, 44% of the public approves of the way Obama is handling his job as President, while half (50%) disapprove. One year earlier, a slim majority (51%) of Americans approved of the job the President was doing and 39% disapproved.
Committed partisans express similar views about the President today as they did one year earlier, while independents have become notably more critical of the President. Republicans strongly disapprove of the President’s performance with 9-in-10 (90%) expressing disapproval. Meanwhile, three-quarters (75%) of Democrats say they approve of how Obama is handling his job. A slim majority (52%) of independents disapprove of Obama’s performance, while 41% approve. In 2013, 45% of independents approved of Obama’s job performance, while 40% disapproved. Roughly 1-in-10 (9%) independents expressed mixed views about the President’s job performance last year.
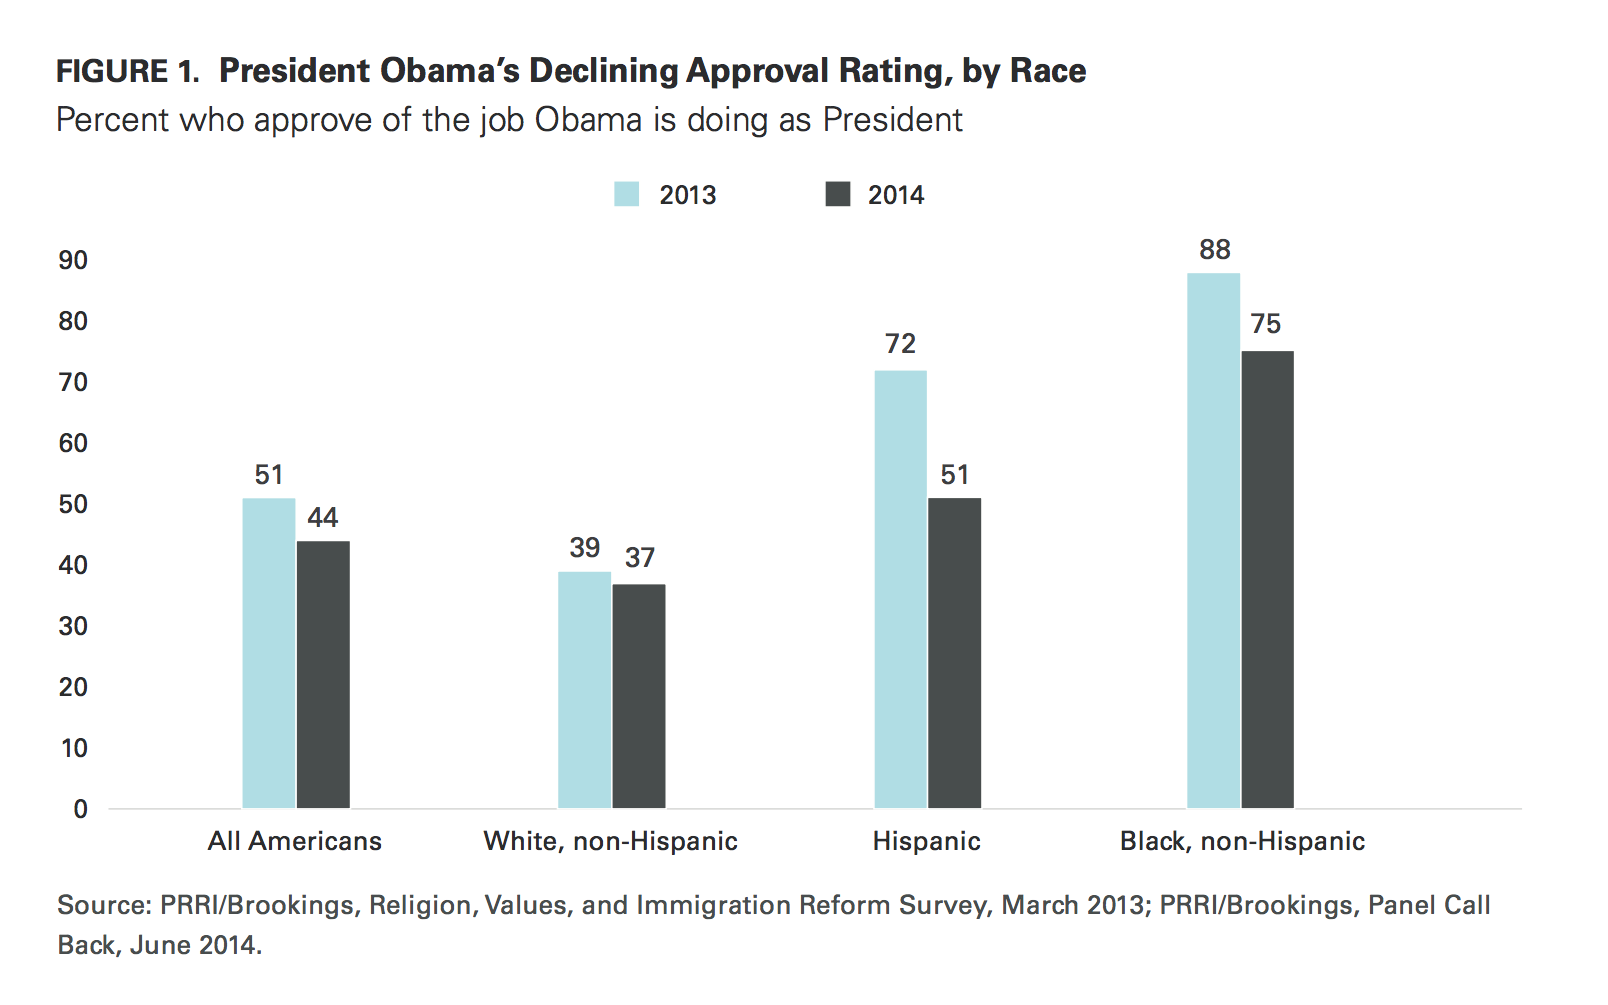
Hispanic Americans’ support for Obama has declined by more than 20 percentage points over the past year. A slim majority (51%) of Hispanics currently approve of Obama’s job performance, down from 72% in 2013. Three-quarters (75%) of black Americans currently approve of Obama’s job performance, down from 88% last year. White Americans have grown increasingly critical of the President, with 58% expressing disapproval, up from 50% in 2013.
Young adults remain the President’s strongest supporters, but they have become less enamored with his job performance. Currently, a majority (54%) of young adults approve of how the President is performing, while 38% disapprove. One year earlier, 60% of young adults expressed approval of the President. In contrast, six-in-ten (60%) seniors disapprove of Obama’s handling of his job as President, while only half (50%) said the same in 2013.
Issue Priorities Largely Unchanged in 2014
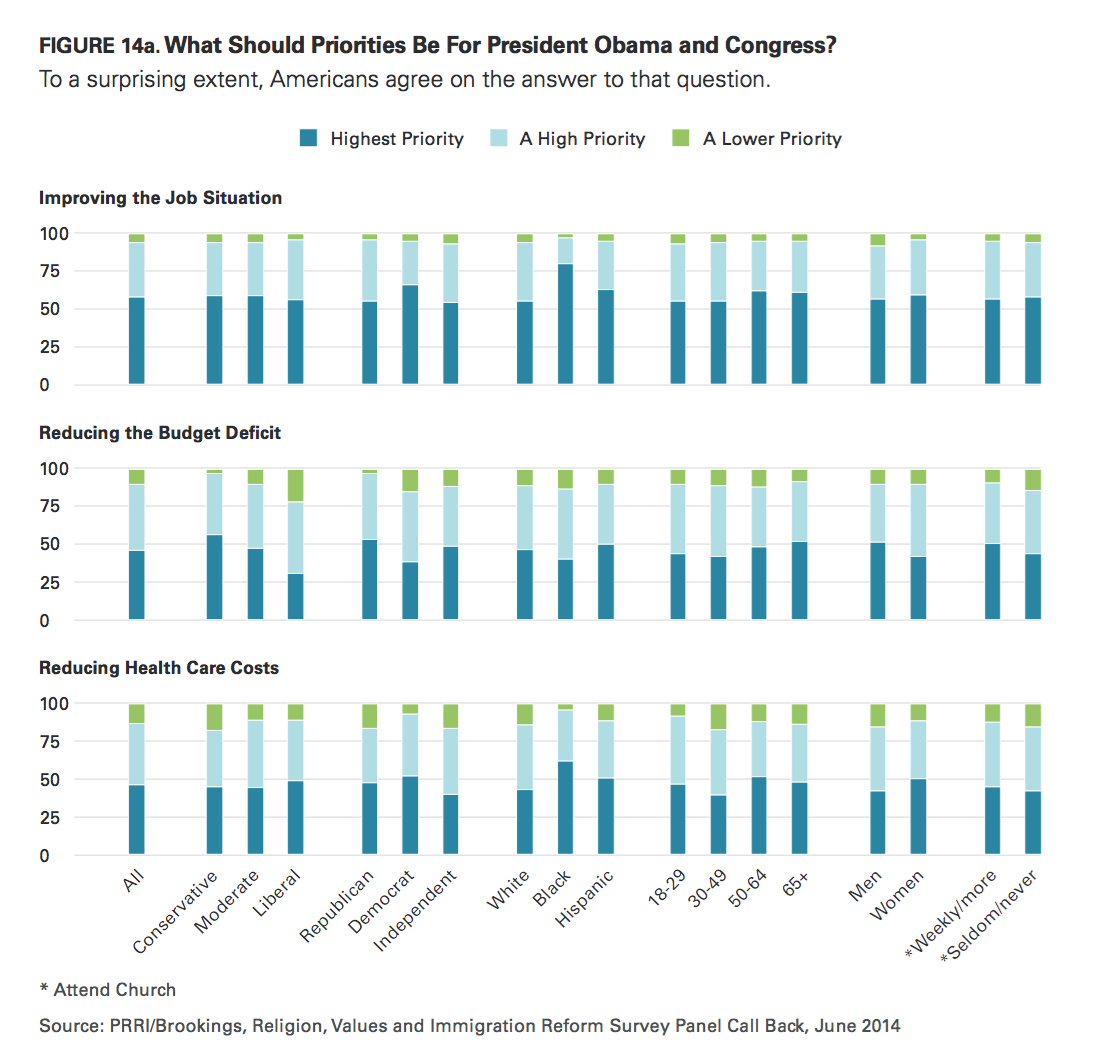
Economic issues remain at the top of Americans’ political priorities, but there are some indicators that Americans’ economic anxieties may have eased slightly. Compared to one year ago, Americans are seven percentage points less likely to say that improving the jobs situation should be the highest priority for President Obama and Congress (65% vs. 58%). More than one-third (36%) currently say it should be a high, but not the highest, priority.
Americans’ concerns about reducing the budget deficit have lessened since 2013. Less than half (45%) of Americans now say reducing the budget deficit should be the highest priority; a year ago 56% said it should be a top priority.
Similar numbers of Americans are concerned about the cost of health care. Less than half (45%) of Americans say that reducing health care costs should be the highest priority, while 4-in-10 (40%) say it should be a high, but not the highest, priority.
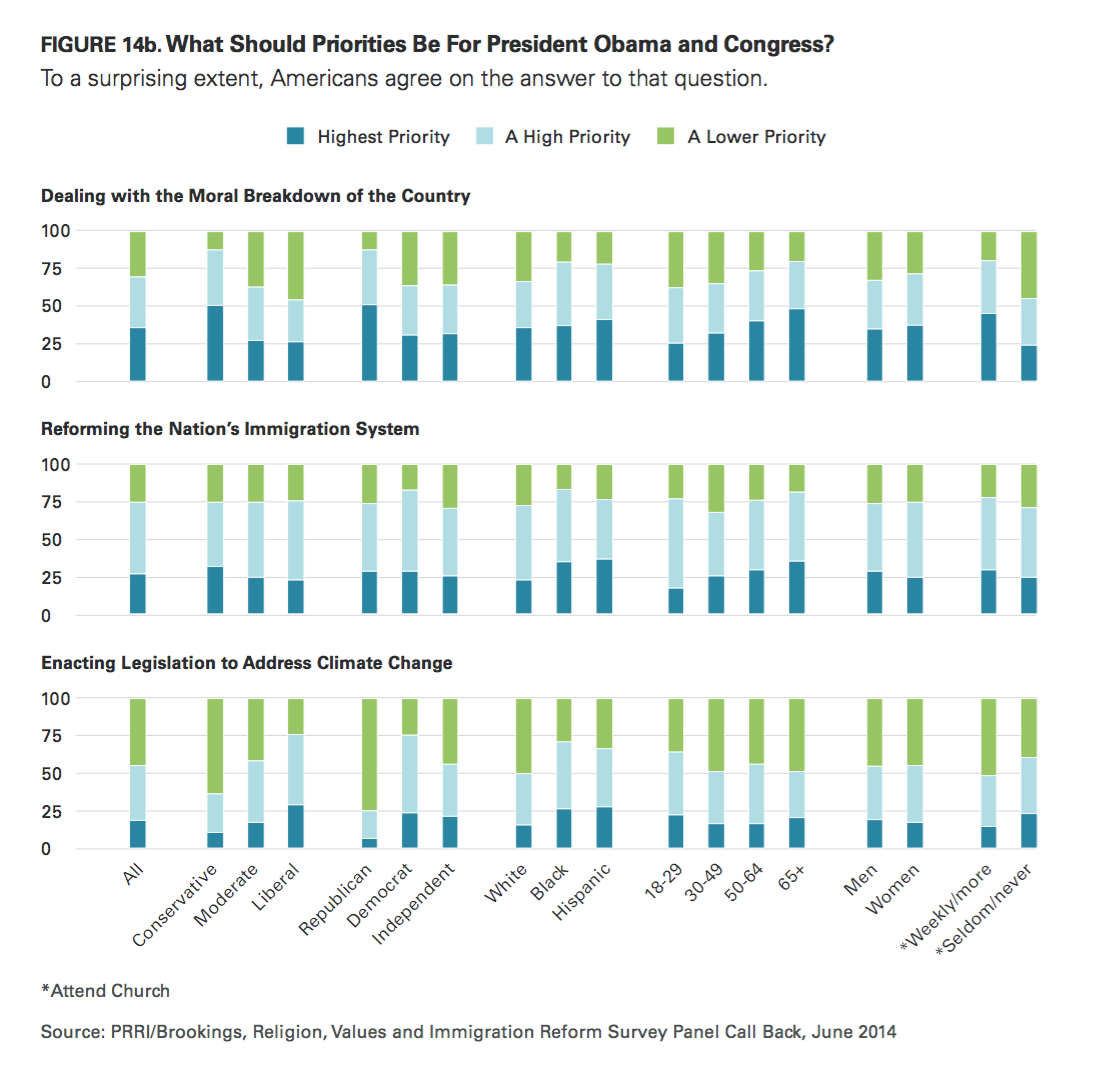
Roughly one-third (35%) of the public say dealing with the moral breakdown of the country should be the highest priority, another third (33%) says it should be a high, but not the highest, priority, while 30% say it should be given lower priority.
Views about the importance of immigration reform have not budged since early 2013 when 24% said reforming the nation’s immigration system should be the highest priority for the president and Congress. Today, one-quarter (26%) of Americans say that reforming the nation’s immigration system should be the highest priority for the president and Congress, while 47% of Americans report that reforming the immigration system should be a high priority but not the highest, and one-quarter (25%) think that immigration reform should be given a lower priority.
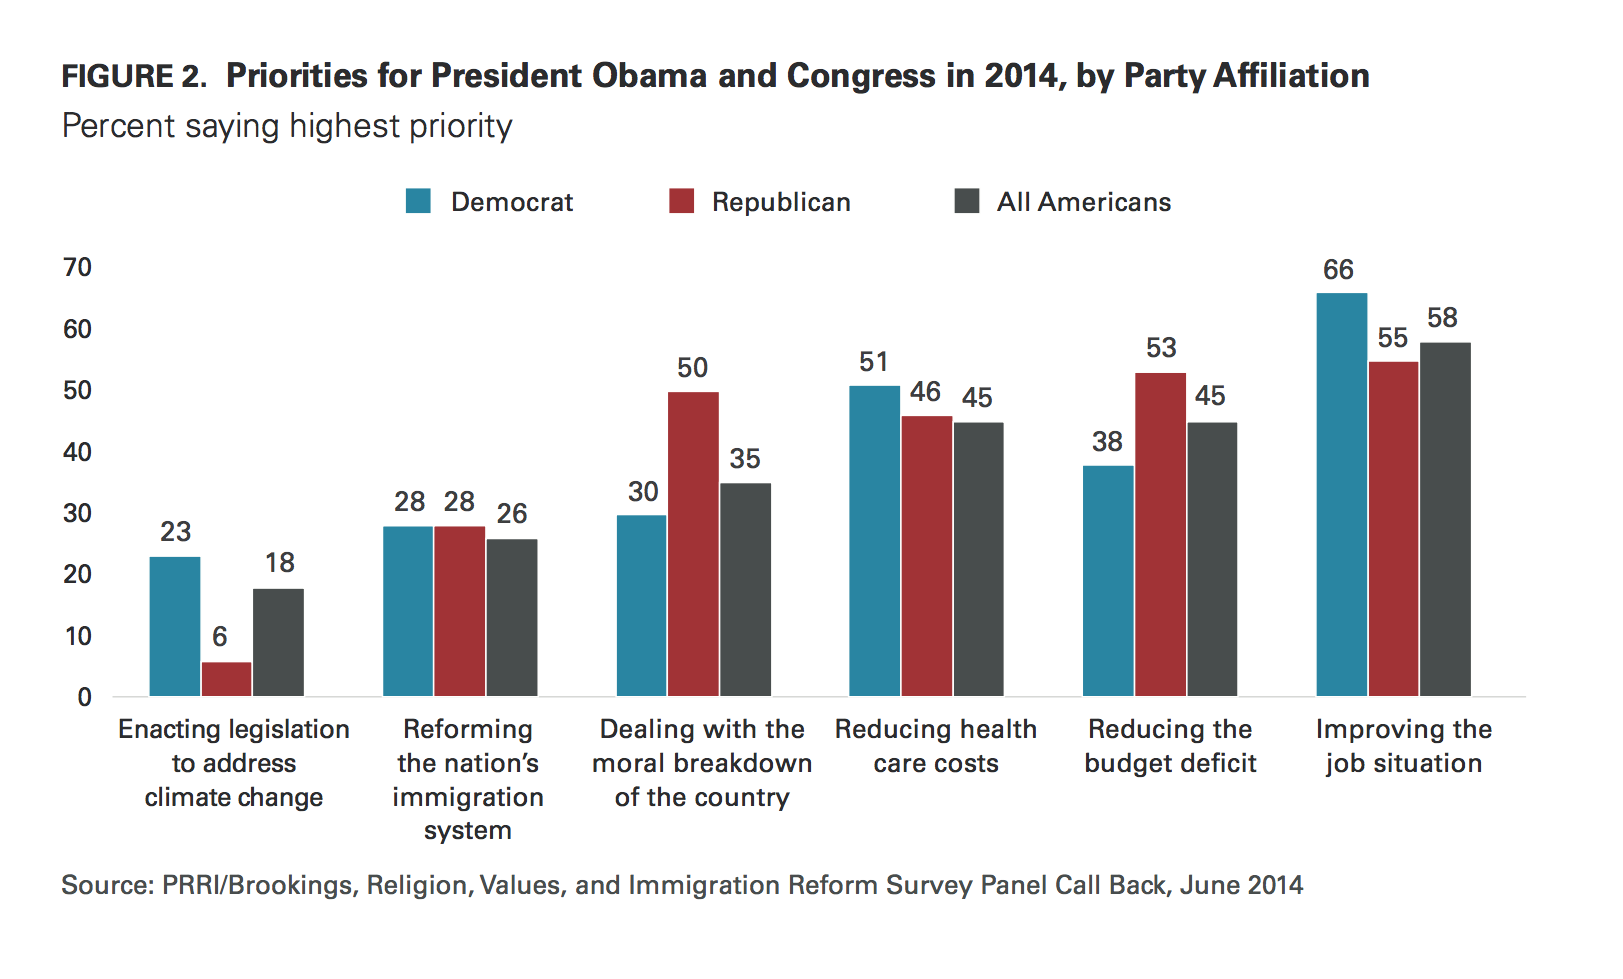
Climate change ranks last as an issue of priority for Americans, with less than 1-in-5 (18%) saying it should be the highest priority, while more than one-third (36%) say it should be a high, but not the highest priority. Forty-four percent of Americans say that enacting legislation to address climate change should be a lower priority.
Americans’ views about the most important priorities are conditioned somewhat by partisan attachment. Democrats are more likely than Republicans and independents to say that improving the jobs situation should be the highest priority (66% vs. 55% and 53%). In contrast, Republicans (53%) are much more likely than Democrats (38%) to say that reducing the budget deficit is a high priority. Interestingly, there are no significant differences of opinion between Democrats and Republicans when they are asked about the priority of immigration reform. Democrats (28%) and Republicans (28%) are equally likely to say that reforming the nation’s immigration system should be the highest priority, while independents rank it about the same (25%).
II. Views of Immigrants and Concerns about Demographic Change
As the worst part of the recession recedes, Americans have adopted more positive attitudes toward immigrants coming to America. Today, a majority of Americans believe immigrants coming to the U.S. contribute positively to society both economically and culturally. However, there are major political, religious, and generational differences in views about immigrants.
Impact of Immigrants on the American Economy
Overall economic impact of immigrants: strength or burden
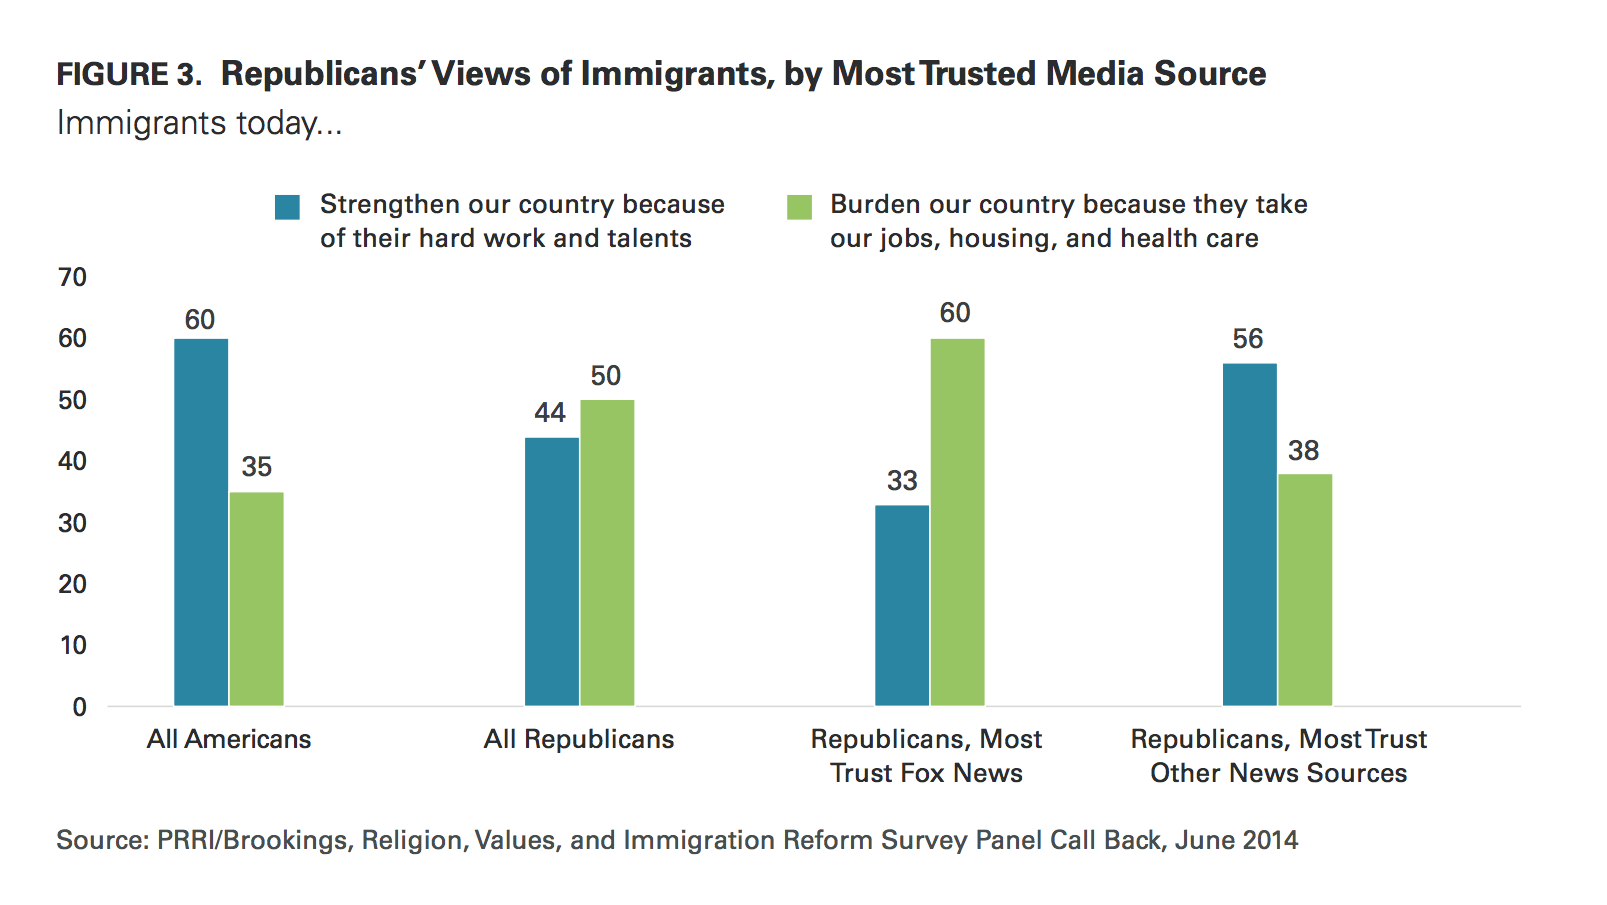
Today, 6-in-10 (60%) Americans say immigrants strengthen our country because of their hard work and talents, while roughly one-third (35%) say immigrants today are a burden on our country because they take jobs, housing and health care. Only a few years ago, opinions about the economic contributions of immigrants were more evenly divided. In 2010, fewer than half (45%) of the public said immigrants strengthen the country because of their hard work and talents, while roughly as many (43%) said that immigrants are a burden because of their reliance on social services.3
There are strong partisan divisions in views about how immigrants are impacting society. Nearly three-quarters of Democrats (73%) say immigrants today strengthen our country because of their hard work and talents compared to only 44% of Republicans; half (50%) of Republicans say immigrants are a burden on the country because they take our jobs, housing, and health care. Among members of the Tea Party, nearly 6-in-10 (57%) say immigrants are a burden on our country, compared to 35% who say immigrants strengthen the country. Independents mirror the American public: 61% say immigrants strengthen our country because of their hard work and 35% say immigrants are a burden.
Among Republicans, there are major differences in views of immigrants between those who say Fox News is their most trusted news source and those who do not. Six-in-ten (60%) Republicans whose most trusted news source is Fox News say that immigrants are a burden, while one-third (33%) say immigrants strengthen the country because of their hard work and talents. In contrast, among Republicans who most trust other news sources, a majority (56%) say immigrants today strengthen the country because of their hard work and talents, while less than 4-in-10 (38%) say immigrants are a burden.
Majorities of most major religious traditions believe that immigrants strengthen the country with their hard work and talents. Nearly three-quarters of the religiously unaffiliated (74%) and 7-in-10 Catholics (70%) say immigrants today strengthen our country because of their hard work and talents, while about one-quarter (25% and 26%, respectively) say immigrants today are a burden on our country because they take our jobs, housing and health care. Majorities of minority Protestants (56%) and white mainline Protestants (52%) also say immigrants strengthen the country. A majority of white evangelical Protestants (56%) say immigrants are a burden, while nearly 4-in-10 (37%) say immigrants strengthen our country.
Impact of immigrants on jobs
Seven-in-ten (70%) Americans say that immigrants coming to the country today mostly take jobs Americans do not want, while only 22% say they take jobs away from American citizens. Last year, Americans were somewhat less likely to believe that immigrants were taking unwanted jobs (64%), and more said immigrants were taking jobs away from citizens (27%).
There is broad consensus across party lines that immigrants mostly take jobs that Americans do not want. More than 8-in-10 (81%) Democrats, more than two-thirds (68%) of independents and roughly 6-in-10 (61%) Republicans say that immigrants mostly take unwanted jobs. Members of the Tea Party are divided; half (50%) believe immigrants take jobs Americans do not want, while 43% say immigrants take jobs away from American citizens.
There is also widespread agreement across religious communities about the effect immigrants are having on the labor market. Majorities of all religious groups, including more than three-quarters (76%) of Catholics, nearly 7-in-10 (69%) white mainline Protestants, and roughly 6-in-10 minority Protestants (63%) and white evangelical Protestants (57%) believe immigrants are mostly taking unwanted jobs. Nearly 8-in-10 (79%) religiously unaffiliated Americans also say immigrants mostly take unwanted jobs.
Majorities of white, black, and Hispanic Americans agree that immigrants mostly take unwanted jobs, but there are differences of intensity. More than 8-in-10 (85%) Hispanics and roughly 7-in-10 (69%) whites say immigrants take unwanted jobs. While most black Americans (57%) say this as well, a substantial minority (30%) believe immigrants take jobs away from American citizens.
Impact of immigrants on the labor market and wages
Americans’ views about the way immigrants impact wages have also experienced a pronounced shift over the last 12 months. Today, Americans are equally as likely to say illegal immigrants help the economy by providing low-cost labor (45%) as they are to say that illegal immigrants hurt the economy by driving down wages (46%). In 2013, only 36% said illegal immigrants help the economy by providing low-cost labor, compared to a majority (56%) of Americans who said that illegal immigrants negatively impact the economy by driving down wages.
Despite the shift in perspectives regarding immigrants’ role in the labor market, notable political differences remain. Today, a majority (56%) of Democrats say illegal immigrants mostly help by providing low-cost labor, a 13-percentage point increase over 2013 when 43% of Democrats said illegal immigrants mostly help the economy. By contrast, only one-third (33%) of Republicans say illegal immigrants mostly help the economy by providing low-cost labor, a modest increase from the 27% who said the same in 2013; 57% of Republicans say illegal immigrants mostly hurt the economy by driving down wages. Nearly two-thirds (65%) of Americans who are part of the Tea Party say illegal immigrants hurt the economy. Independents today are divided in their opinion: 44% say illegal immigrants provide low-cost labor, while 45% say illegal immigrants hurt the economy by driving down wages. In 2013, 36% of independents said illegal immigrants mostly provide low-cost labor, compared to a majority (55%) who said illegal immigrants mostly drive down wages.
Religious groups are divided over whether illegal immigrants are helping or hurting the economy. A majority of white evangelical Protestants (60%) and minority Protestants (55%) say illegal immigrants hurt the economy by driving down wages. White mainline Protestants and Catholics are more divided on the issue. Half (50%) of white mainline Protestants say illegal immigrants help the economy, while 41% say illegal immigrants help by providing low-cost labor. Forty-seven percent of Catholics say illegal immigrants help the economy, and a similar percentage (44%) say they hurt the economy. The religiously unaffiliated stand out as the only group in which a majority (58%) say illegal immigrants mostly help by providing low-cost labor.
Young Americans and seniors have contrasting views about the economic impact of illegal immigrants. More than 6-in-10 (61%) young Americans say illegal immigrants help the economy by providing low-cost labor compared to about one-third (32%) who say illegal immigrants hurt the economy. A majority of seniors (52%) say illegal immigrants hurt the economy by driving down wages, while fewer than 4-in-10 (37%) say they benefit the economy.
The racial differences in views about whether illegal immigrants are depressing wages are stark. Two-thirds (67%) of Hispanics say illegal immigrants mostly help by providing low-cost labor and only one-quarter (25%) say they hurt the economy. Whites are divided; nearly half (48%) say illegal immigrants mostly hurt the economy by driving wages down and 42% say they help by providing low-cost labor. A majority of black Americans (53%) say illegal immigrants hurt the economy by driving down wages compared to roughly 4-in-10 (38%) who say illegal immigrants help the economy by providing low-cost labor.
Impact of Immigrants on American Culture
American attitudes about the cultural impact of immigrants have become increasingly positive over the last few years. Today, nearly 6-in-10 (58%) Americans say that the growing number of newcomers from other countries strengthen American society compared to 37% who say that newcomers threaten traditional American customs and values. As recently as 2010, Americans were divided in their views about the influence immigrants were having on American society; 44% said immigrants threaten traditional customs and values while equal numbers (44%) said they strengthen American society.4
There are sharp contrasts between Democrats and Republicans in views about the cultural impact of immigrants. Nearly two-thirds (66%) of Democrats say that the growing number of newcomers strengthens American society, while 3-in-10 (30%) say the growing number of newcomers threatens American customs and values. In contrast, a majority (52%) of Republicans say newcomers threaten American customs and values, while approximately 4-in-10 (41%) say newcomers from other countries strengthen American society. Members of the Tea Party are most likely to see newcomers as a threat to American society. Among the Tea Party, 58% say newcomers threaten American values and customs, compared to only 36% who say they strengthen American society.
While a majority of Republicans say that newcomers threaten American customs and values, there are notable differences between members of the GOP who most trust Fox News for information about politics and Republicans who trust other news sources. A majority (57%) of Republicans who most trust Fox News say newcomers threaten American culture, while nearly 4-in-10 (37%) say newcomers strengthen American society. Republicans who most trust other news sources are evenly divided, with 46% saying newcomers strengthen American society and 46% saying newcomers from other countries threaten American customs and values. Majorities of most religious groups agree that newcomers strengthen American society. More than 7-in-10 (72%) religiously unaffiliated Americans say newcomers strengthen our country. Majorities of minority Protestants (57%), white mainline Protestants (55%), and Catholics (53%) also say newcomers strengthen American society. In contrast, a majority (53%) of white evangelical Protestants say the growing number of newcomers from other countries threatens traditional American customs and values; 40% say newcomers strengthen American society.
The generational differences are striking. More than three-quarters of young adults (76%) say the growing number of newcomers coming from other countries strengthens American society. Seniors are divided. Nearly half (46%) of seniors say newcomers threaten American customs and values, while 45% say the growing number of newcomers from other countries strengthen American society.
Concerns about the Changing Demographic Landscape
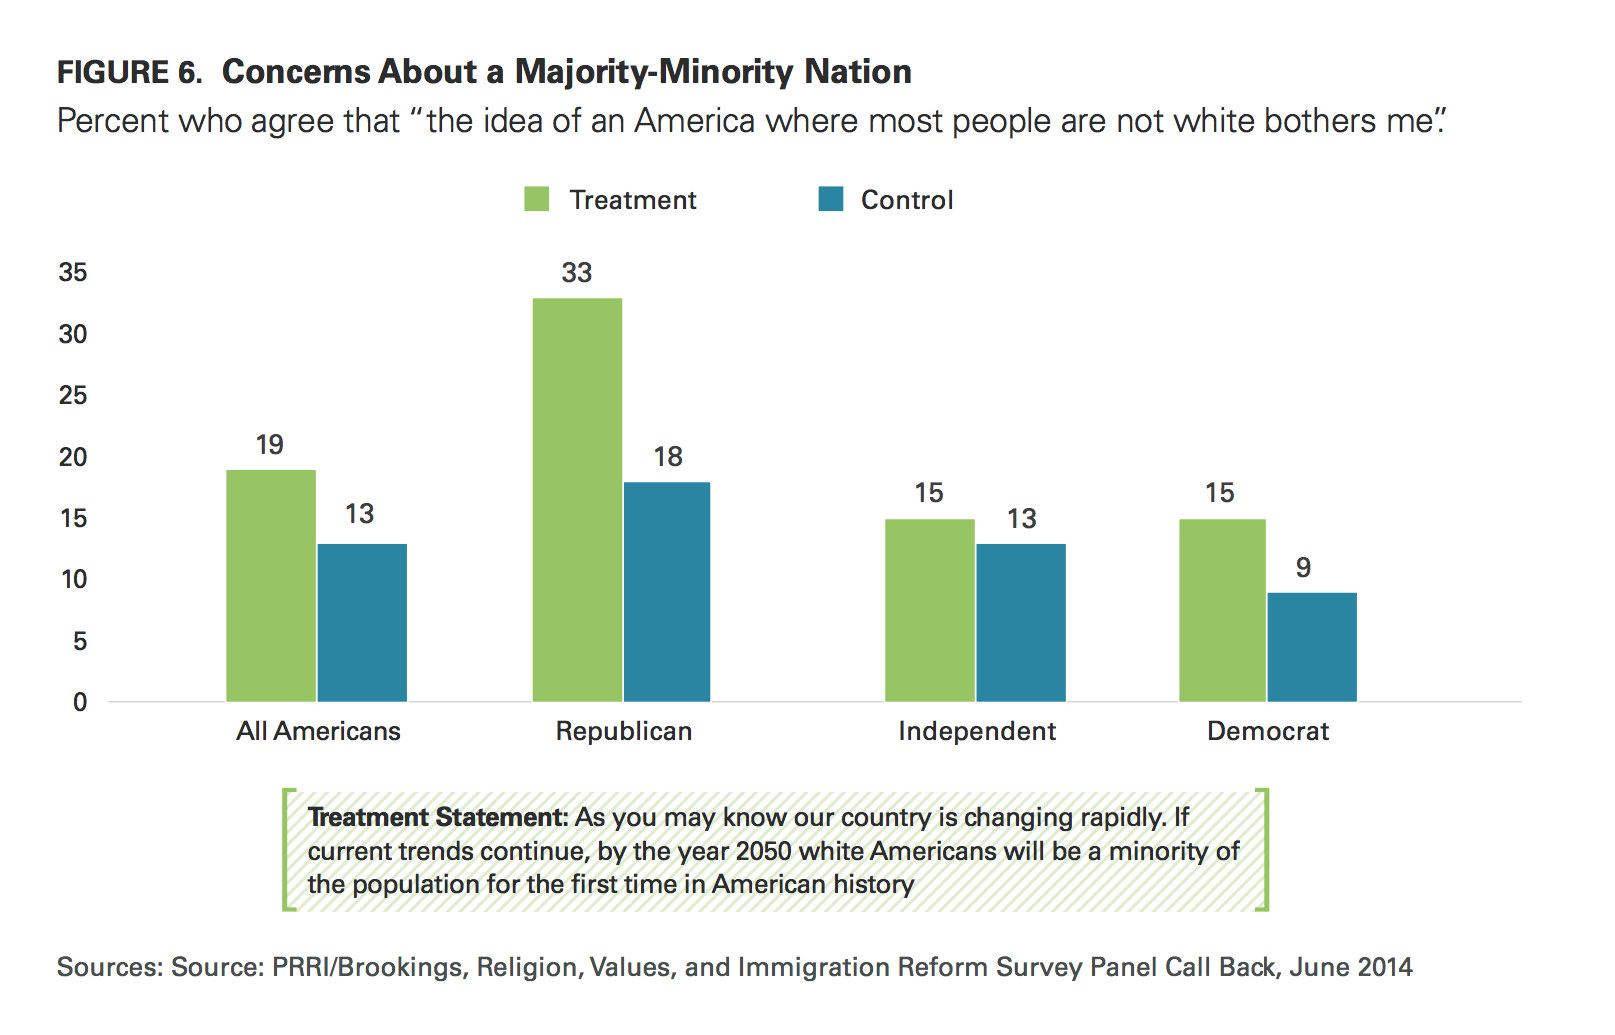
In its latest population projections, the U.S. Census Bureau estimates that white Americans will comprise a minority of the population by the year 2043.5 In order to assess anxieties Americans may feel because of these demographic changes, PRRI conducted a controlled survey experiment using a priming statement. The experiment was conducted by dividing the sample into two demographically matched groups, a treatment group and a control group. The treatment group, but not the control group, was primed with the following statement: “As you may know our country is changing rapidly. If current trends continue, by the year 2050 white Americans will be a minority of the population for the first time in American history.” Both groups were then asked whether they agreed or disagreed that “the idea of America where most people are not white bothers me.”
The results suggest that priming Americans to think about impending demographic changes increases concerns. Americans who received the treatment statement were six points more likely than those who did not to say that the idea of America as a majority non-white country bothered them (19% vs. 13%). The experiment produced significantly different outcomes among different subgroups of Americans.
Among political groups, Republicans are the most affected by the priming treatment. One-third of Republicans (33%) who received the treatment statement agree that the idea of America where most people is not white bothers them compared to less than 1-in-5 (18%) Republicans in the control group. The differences between the treatment and control groups are much more modest among Democrats (15% vs. 9%) and independents (15% vs. 13%).
Similarly, most religious groups did not appear to be affected by the priming statement about the future of America as a minority-majority nation. Only among white mainline Protestants are there sizable differences between the treatment group (26%) and the control group (14%).
Notably, the differences between the treatment and control groups among whites overall is not statistically significant. One-in-five (20%) whites who received the priming statement agree the idea of America where most people are not white bothers them compared to 15% in the control group.
III. The Immigration System and Knowledge of Immigration Trends
Most Americans Continue to Believe Immigration System is Broken
Overall, most Americans believe the immigration system in the United States is broken. Less than 1-in-10 (6%) Americans believe that the immigration system is generally working, while 31% say it is working but with some major problems. Nearly four-in-ten (38%) Americans report that the current immigration system is broken but working in some areas, while 23% say it is completely broken. These views remain essentially unchanged over the last year.
Notably, more than two-thirds (67%) of Republicans say that the immigration system is mostly or completely broken compared to 62% of independents and 54% of Democrats. Majorities of all major religious groups believe the current immigration system is broken, including more than 6-in- 10 white Catholics (67%), white mainline Protestants (67%), minority Protestants (64%), white evangelical Protestants (63%), the religiously unaffiliated (61%) and 56% of Catholics overall.
Public Knowledge of Recent Immigration Trends
Perceptions of illegal immigration rates
Nearly half (47%) of Americans believe that the number of immigrants coming to the country illegally has increased over the last five or six years.6 Roughly one-third (34%) say the rate has stayed about the same, and 13% say it has decreased. Views about the relative rate of unauthorized immigration are closely associated with political predispositions. Republicans (63%) are more likely than Democrats (44%) or independents (42%) to believe illegal immigration has increased. Among members of the Tea Party, nearly two-thirds (66%) believe that the number of immigrants coming to the U.S. illegally has increased over the last few years.
Those who say Fox News is their most trusted news source are far more likely than Americans who most trust other news sources to say the number of immigrants coming to the U.S. illegally has increased recently. Americans who most trust Fox News are the only group among whom a majority (64%) believe the number of immigrants coming to the U.S. illegally has increased. Less than half of those who most trust broadcast news, such as NBC, ABC, or CBS (46%), or CNN (46%) think illegal immigration has increased, while more than one-third (36%) of those who most trust public television believe immigration has increased.
Majorities of white evangelical Protestants (63%), white mainline Protestants (54%), and minority Protestants (54%) believe that illegal immigration has increased, compared to less than half (48%) of Catholics and less than one-third (31%) of the religiously unaffiliated.
Perceptions of deportation rates
Although deportations of immigrants living in the country illegally has increased since the beginning of the Obama administration,(7) only one-quarter (25%) of Americans correctly state that deportations have increased over the past five or six years. Close to half (45%) of Americans believe that the number of deportations has stayed the same, while nearly 1-in-5 (18%) say deportations have decreased. Public knowledge about the level of deportations has remained unchanged since last year.
There are modest differences in knowledge about deportations between partisans. A plurality of Democrats (49%), Republicans (45%) and independents (42%) believe the rate of deportations has stayed about the same over the last five or six years. However, Democrats (30%) and independents (27%) are more likely than Republicans (18%) to report correctly that the number of deportations has increased over the past five or six years. By contrast, Republicans (25%) are more than twice as likely as Democrats (12%) to report that the number of immigrants who were deported back to their home countries has decreased over the past five or six years.
There are substantial differences in the degree of knowledge about the deportation rate between racial and ethnic groups. More than four-in-ten (42%) Hispanic Americans correctly report that the number of immigrants living in the country illegally who were deported back to their home countries has increased over the past five or six years compared to approximately one-quarter of both black Americans (25%) and white Americans (23%).
Media sources also impact views on deportation. Only 12% of Americans who most trust Fox News for information about politics and current events correctly believe deportations have increased. In contrast, nearly one-quarter (24%) of Americans who most trust broadcast news, one-third (33%) Americans who most trust CNN, and 35% of Americans who most trust public television believe the deportation rate has increased.
IV. Public Policies: Immigration Reform and the DREAM Act
Immigration Reform Policy: Citizenship, Permanent Legal Residency, or Deportation
Since March 2013, views on immigration reform have remained remarkably steady with more than 6-in-10 Americans expressing support for a policy that would provide a way for immigrants who are currently living in the United States illegally to become citizens provided they meet certain requirements. Currently, 62% of Americans support a path to citizenship that includes certain conditions, while 17% support allowing immigrants to become permanent legal residents but not citizens, and roughly 1-in-5 (19%) favor a policy that would identify and deport all immigrants living in the United States illegally. Current support for a path to citizenship is nearly identical to support levels one year ago when 63% supported a path to citizenship for immigrants who are living in the United States illegally.8
The issue of immigration reform has support across party lines, although there are notable differences in the intensity of support. Consistent with findings from last year, majorities of self-identified Democrats (70%), independents (61%), and Republicans (51%) continue to favor a path to citizenship for immigrants living in the country illegally. Notably, Republicans are roughly three-times more likely than Democrats to favor identifying and deporting all immigrants living in the U.S. illegally (30% vs. 11%). Members of the Tea Party stand out in their lack of support for immigration reform. Less than 4-in-10 (37%) Americans who are part of the Tea Party movement favor allowing immigrants living in the U.S. illegally to become U.S. citizens, while 23% favor allowing them to become permanent legal residents but not citizens; notably, 37% favor a policy that would identify and deport all immigrants in the U.S. illegally.
Currently, majorities of all religious groups, with the exception of white evangelical Protestants, support a path to citizenship, including roughly 6-in-10 white mainline Protestants (58%), minority Protestants (62%), and Catholics (63%), and more than two-thirds (68%) of religiously unaffiliated Americans. Among white evangelical Protestants, nearly half (48%) also favor allowing immigrants living in the U.S. illegally an opportunity to become citizens provided they meet certain requirements, and 18% say they prefer a policy that allows immigrants in the country illegally to become permanent legal residents but not citizens, while nearly one-third (31%) say they would prefer a policy that identifies and deports all immigrants in the U.S. illegally. While support for a path to citizenship has held relatively steady among most religious groups, the current level of support among white evangelical Protestants represents a significant drop from 2013 when 56% said they supported a path to citizenship.
Young adults register higher support for immigration reform that includes a pathway to citizenship than older Americans. Nearly three-quarters (74%) of young adults favor a policy that would grant immigrants living in the U.S. illegally an opportunity for citizenship provided they meet certain requirements. Among seniors, close to 6-in-10 (59%) support this policy.
There are notable racial and ethnic differences in views about immigration reform. Fifty-eight percent of white Americans, 64% of black Americans and nearly 8-in-10 (77%) Hispanics favor allowing immigrants in the U.S. illegally a way to become citizens. Whites are nearly six times more likely than Hispanics to support a policy that would identify and deport all immigrants living in the U.S. illegally (23% vs. 4%).
Having a close friend born outside of the United States also impacts attitudes on immigration. Nearly two-thirds (66%) of those who have a close friend born outside of the United States support a path to citizenship, compared to 54% of those who do not have a close friend who was born outside of the United States. More than 1-in-4 (26%) of those who do not have a close friend who was born outside of the United States favor deportation, compared to 16% of those who have a close friend born outside of the United States.
Strength of opinions on immigration reform
Americans on both sides of the immigration debate feel strongly about their position, although those who say their preferred policy is identifying and deporting immigrants who are living in the U.S. illegally feel most strongly about their position. More than 9-in-10 (91%) Americans who favor deportation say they feel strongly about their view, while 80% of Americans who favor a path to citizenship also feel strongly about their position. Among those who favor allowing immigrants who are in the United States illegally to become permanent legal residents, 65% say they feel strongly about their position.
The influence of media sources on support for immigration reform
Americans’ media preferences are closely associated with views about immigration reform. Majorities of Americans who most trust public television (71%), CNN (65%), and broadcast news (63%) support a path to citizenship for immigrants currently living in the U.S. illegally. Americans who most trust Fox News are less likely (46%) to favor allowing immigrants living in the country illegally to become citizens, while 19% favor allowing them to become permanent legal residents, but not citizens, and nearly one-third (32%) prefer to identify and deport them.
Although a slim majority of Republicans favor immigration reform policy that includes a path to citizenship, there are substantial differences between Republicans who most trust Fox News for information about news and politics and those who trust other media outlets. Only 42% of Republicans who most trust Fox News support a path to citizenship, compared to 60% of Republicans who trust other news sources. This pattern is also evident among political independents. Although more than 6-in-10 of independents support a path to citizenship overall, only 48% of independents who most trust Fox News say they support this policy, compared to 66% of independents who most trust other television news outlets.
A profile of the minority who support deportation
Americans who support deportation represent a distinct minority in the U.S., and they have a unique political, social and demographic profile. Compared to Americans overall, they are roughly twice as likely to be members of the Tea Party movement (24% vs. 12%) and significantly more likely to identify as Republican (36% vs. 23%).
Americans who favor deportation are more likely to be white and tend to be older than Americans overall. Nearly 8-in-10 (79%) Americans who say immigrants in the U.S. illegally should be deported are white, while 10% are black and only 2% are Hispanic. Close to 6-in-10 (57%) Americans who support deportation are over the age of 50, compared to 46% of Americans overall.
Americans who hold these views also tend to have lower levels of education and are much more likely to be white working class. A majority (53%) of those who favor deportation policy have a high school degree or less compared to 4-in-10 (40%) of Americans overall. Less than 1-in-5 have a college degree (12%) or a post-graduate degree (7%). A majority (55%) of Americans who favor deportation are working-class whites, compared to 35% of Americans overall.
Close to half (46%) of all Americans who support deportation live in the South, while 23% live in the Midwest, and fewer reside in the West (17%) or Northeast (14%).
Deportation supporters stand out for holding divergent beliefs from other Americans about immigration and deportation rates over the last five or six years. Most notably, more than three-quarters (77%) of deportation supporters believe that the number of immigrants coming to the U.S. illegally has increased over the previous five or six years; among Americans overall, less than half (47%) believe this. Similarly, deportation supporters are more than twice as likely as Americans overall to believe, incorrectly, that deportations have decreased in the last five or six years (39% vs. 18%).
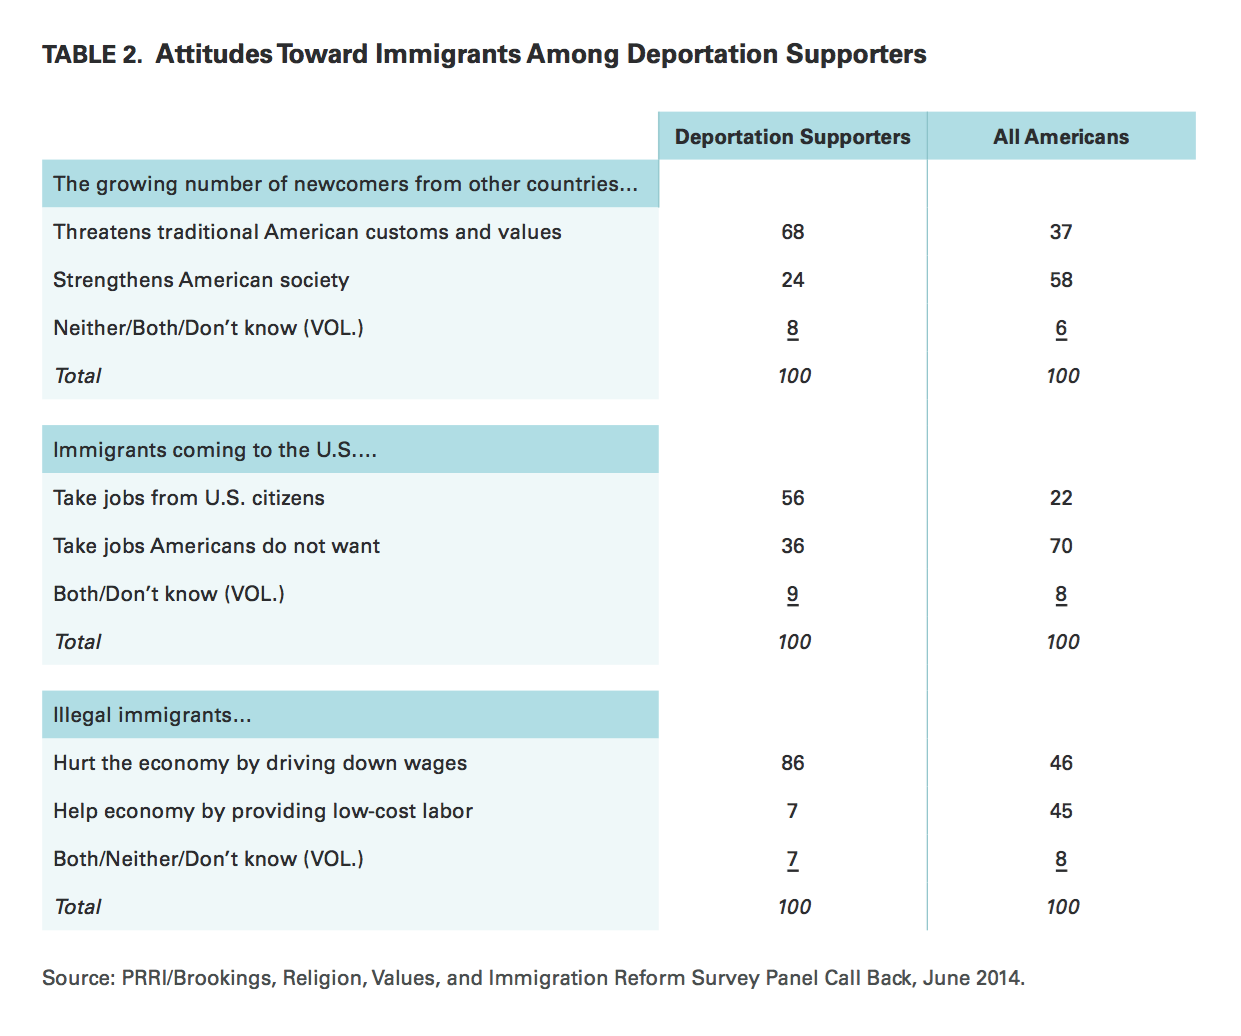
Deportation supporters also tend to have substantially more negative views about the general contribution of immigrants to the United States. Nearly 7-in-10 (68%) believe the growing number of newcomers from other countries threatens traditional American customs and values compared to just 37% of Americans overall. More than three-quarters (77%) of deportation supporters believe immigrants are a burden on the country because they take jobs, housing and health care, a view shared by only 35% of Americans overall.
Deportation supporters also have strongly negative views about the impact of immigrants on jobs and wages. Deportation supporters are more than twice as likely as Americans overall to believe that immigrants in the country illegally are taking jobs that Americans want (56% vs. 22%). And overwhelming numbers (86%) of deportation supporters believe that immigrants in the country illegally hurt the economy by driving down wages, a view shared by less than half (46%) of Americans overall.
Those who support deportation are also much more likely than other Americans to care about the issue of immigration and to report that they are certain to vote. Nearly half (46%) say that reforming the nation’s immigration system should be the highest priority for the president and Congress compared to 21% of supporters of a path to citizenship and 26% of Americans overall. Approximately 6-in-10 (61%) deportation supporters report that they are absolutely certain to vote in the 2014 congressional election compared to 48% of supporters of a path to citizenship and 51% of Americans overall.
The most trusted news source for deportation supporters is Fox News, with more than 4-in-10 (41%) saying it is the television news source they trust the most to provide accurate information about politics and current events, followed by a quarter (25%) who say broadcast network news, and 13% who trust CNN the most.
Predictors of support for a path to citizenship
In order to identify which factors are most important in structuring attitudes about immigration reform, we constructed a logistic regression model that predicts support for providing immigrants who are in the country illegally with a path to citizenship provided they meet certain requirements. The model results indicate that the two most powerful independent predictors of support for a path to citizenship are being young and identifying as Hispanic. Young adults (age 18-29) are about twice as likely as older Americans (age 30+) to support a path to citizenship. Similarly, Hispanics are roughly twice as likely as non-Hispanics to favor this policy.
Holding a four-year college degree, being female, identifying with the Democratic Party, and most trusting MSNBC as an accurate news source are also significant predictors of support for immigration reform, although each of these factors exhibit weaker independent influence than age and ethnicity. For example, compared to Americans who do not have a four-year college education, college graduates are 1.6 times as likely to favor immigration reform that includes a path to citizenship.
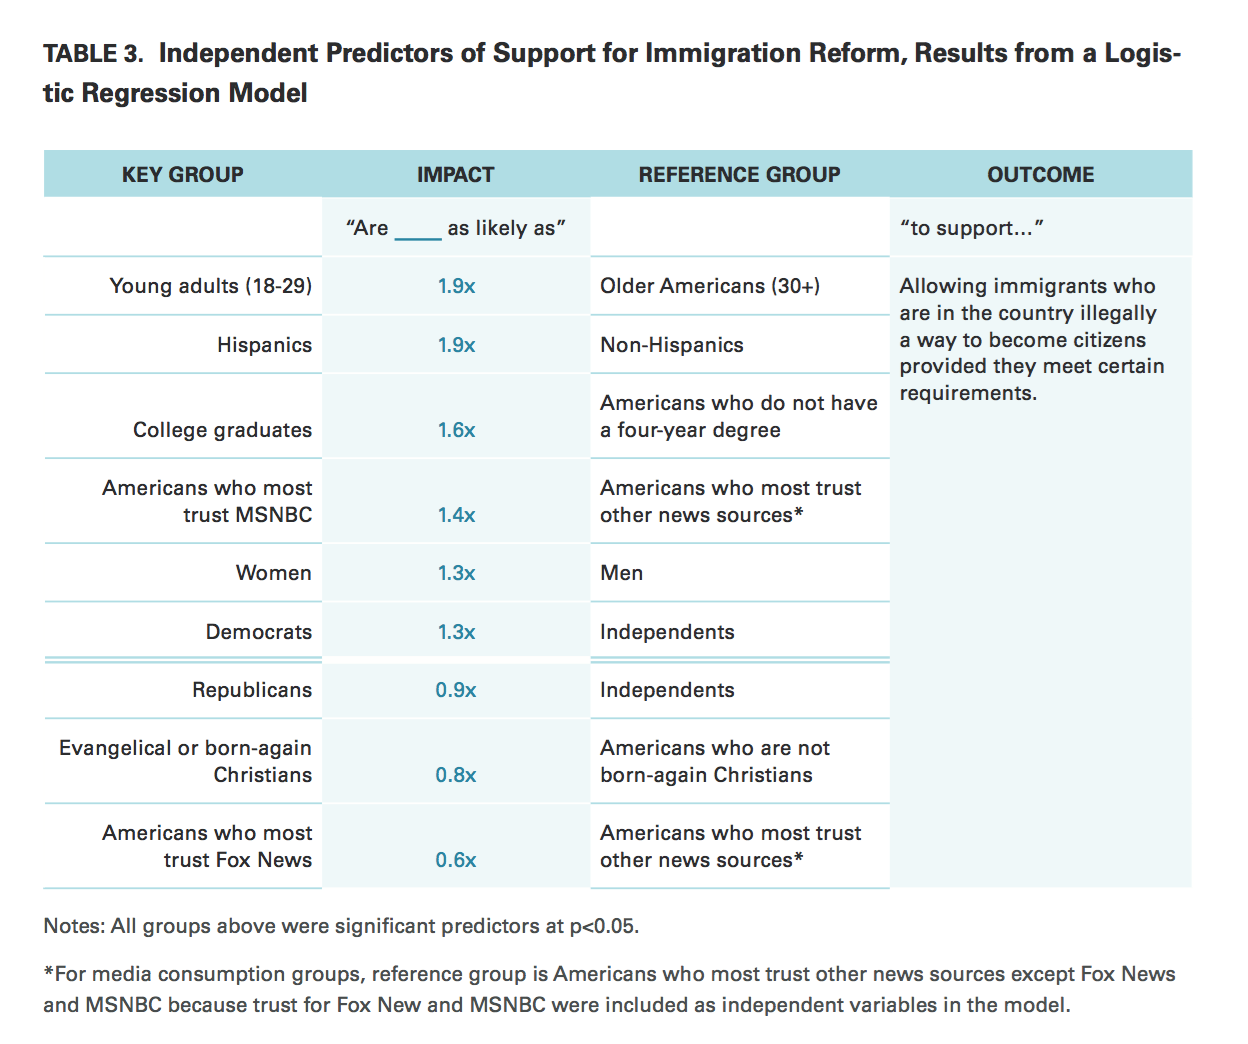
In contrast, identifying as Republican, being a born-again Christian, and most trusting Fox News as an accurate news source all predict opposition to immigration reform that includes a path to citizenship. Among these negative factors, trusting Fox News exhibits the strongest effect, dwarfing Republican identification. Americans who most trust Fox News are about half as likely to support immigration reform as Americans who trust other news sources. Notably, once controls are included for trust in Fox News, being Republican has only a modest impact on opinions about immigration reform.
Few Believe Immigration Reform Would Increase Risk of Terrorism
Although national security concerns are occasionally cited as an issue closely tied to immigration, most Americans do not believe providing a path to citizenship for immigrants living in the U.S. illegally would increase the likelihood of a terrorist attack. Less than 1-in-5 (17%) say providing a path to citizenship to immigrants living in the U.S. illegally would increase the likelihood of terrorism. In contrast, more than 7-in-10 (72%) say it would have no impact, and close to 1-in-10 (9%) say providing such a path would make an act of terrorism less likely.
There is strong agreement about the relationship between immigration reform policy and terrorism across the political spectrum. Nearly two-thirds of Republicans (64%) and about three-quarters of Democrats (75%) and independents (74%) say that passing immigration reform would make no difference in the likelihood of a terrorist attack. However, Republicans (26%) are about twice as likely as Democrats (14%) or independents (13%) to think a path to citizenship for immigrants would increase terrorism.
Majorities of all religious groups also do not recognize a link between immigration reform and terrorism, but there are some notable differences. More than one-quarter (27%) of white evangelical Protestants compared to 1-in-5 (20%) minority Protestants, 15% of white mainline Protestants and Catholics, and 1-in-10 (10%) religiously unaffiliated Americans believe a path to citizenship for immigrants would increase terrorism.
Notably, only about 4-in-10 (39%) deportation supporters say they believe that a path to citizenship policy would increase the likelihood of terrorism; 51% say it would make no difference and 7% say it would decrease the likelihood of terrorism.
Strong Support for DREAM Act
Americans continue to favor allowing illegal immigrants brought to the U.S. as children to gain legal resident status if they join the military or go to college, a policy which comprises the basic elements of the DREAM Act. More than two-thirds (68%) of Americans favor this policy, while three-in-ten (30%) are opposed. There is agreement across political groups, but notable differences in the strength of support. Eight-in-ten (80%) Democrats and more than two-thirds (68%) of independents favor the basic tenets of the DREAM Act, as do a slim majority (52%) of Republicans.
Again, Republicans who most trust Fox News express considerably different opinions than other Republicans. Less than half (43%) of Republicans who most trust Fox News favor the DREAM Act compared to 6-in-10 (62%) Republicans who most trust other news sources.
Majorities of nearly all religious groups favor the basic tenets of the DREAM Act, including 81% of the religiously unaffiliated, 69% of Catholics, 68% of minority Protestants, and 63% of white mainline Protestants. White evangelical Protestants are divided; 48% favor of the basic tenets of the DREAM Act, and 47% oppose it.
Strong majorities of all racial and ethnic groups favor allowing illegal immigrants brought to the U.S. as children to gain legal resident status if they join the military or go to college. More than 8-in-10 (84%) of Hispanic Americans, 71% of black Americans and 64% of white Americans favor the basic tenets of the DREAM Act.
Political Party Most Trusted to Handle Immigration
The Democratic Party retains a significant edge over the GOP over which party is most trusted to handle to issue of immigration. Close to half (46%) of Americans say they most trust the Democratic Party to handle the issue, while 33% say they most trust the GOP. Fourteen percent say they do not trust either party to handle the issue of immigration. Since 2013, the Democratic Party has widened its lead on this question, from a 10-point advantage over the GOP (39% to 29%) in 2013 to a 13-point advantage today.
Partisans overwhelmingly trust their respective parties to better handle the issue of immigration. Seventy-five percent of Republicans say they trust the GOP to better handle the issue of immigration, while 86% of Democrats say they trust their party more to handle it. Tea Party members are somewhat less likely to trust the GOP on the issue of immigration than Republicans (66%). Notably, independents are not significantly more likely to trust the Democratic Party (36%) than they are to trust the GOP (33%) to handle the issue of immigration. More than 1-in-5 (22%) independents report that they do not trust either party to handle the issue.
V. The 2014 Elections
Low Interest in 2014 Campaign
At this point in the 2014 election season, Americans are relatively disengaged. Only 16 percent say they are following news about the 2014 congressional campaigns in their district or state very closely. Twenty-eight percent say they are following the congressional campaigns in their state or election district fairly closely, while 55% say they are not following these campaigns too closely or at all closely.
Only about half (51%) the public say they are absolutely sure of voting in the 2014 congressional election. Roughly 1-in-5 (21%) say they will probably vote, while one-quarter (25%) say their chances of voting are 50-50 or less.
Among registered voters, interest in the 2014 election is somewhat higher. However, even among voters, only 19% say they are paying very close attention, while 31% say they are paying fairly close attention to the political campaigns in their respective district. About 6-in-10 (62%) voters say they are absolutely sure to vote in the congressional elections this year.
Republican voters are much more likely than Democratic voters to report that they will vote this year (78% vs. 57%). Among Tea Party voters, 86% say they will definitely vote in the congressional elections this fall.
Younger voters (age 18-34), who were an important part of President Obama’s electoral coalition in 2012, remain very disengaged at this early stage of the election. Only 37% of younger voters report that they are absolutely certain to vote this year. In contrast, roughly three-quarters (74%) of senior voters (age 65+) say they are absolutely certain to vote in the 2014 elections.
2014 Vote Preferences
Among all registered voters, Democratic candidates have a modest advantage over Republican candidates (45% vs. 37%). However, among engaged voters—those voters who report that they are absolutely certain to vote this year—Republicans maintain a narrow advantage over Democrats (44% vs. 41%).
Concerning the outcome of the 2014 elections, voters are more likely to prefer the status quo with each party retaining a majority of one house of Congress. Half of all voters say they would prefer control of Congress to be divided between the Republican Party and Democratic Party. More than 1-in-5 (22%) voters say they would prefer Republicans control both houses of Congress, while roughly as many (25%) say they would prefer that Democrats take unified control over Congress.
Republican and Democratic voters are about as equally likely to wish their respective party had unified control over Congress (55% vs. 53%). Notably, 63% of independents prefer that control over Congress be divided between the major political parties.
2014 Candidate Positions: Benefits and Liabilities
Opposition to immigration reform
Among all registered voters, opposing immigration reform is more of a liability for candidates than an asset. Fifty-three percent of voters say they would be less willing to vote for a candidate who opposes immigration reform that includes a path to citizenship for immigrants currently living in the U.S. illegally. Only 16 percent say they would be more likely to support a candidate who opposes immigration reform, while 30 percent say that a candidate’s position on this issue would make no difference to their vote.
 Even among Republican voters, opposing immigration reform carries more political risk than benefit. Nearly half (46%) of Republican voters say they would be less likely to vote for a candidate who opposes immigration reform that includes a path to citizenship, while 21% say they would be more likely to support such a candidate. Three-in-ten (30%) Republican voters say it would not make a difference to their vote either way. A majority of Democratic (58%) and independent (52%) voters say they would be less likely to cast a ballot for a candidate who opposes immigration reform.
Among religious voters, opposing immigration reform is also unlikely to engender much support. Close to half of white evangelical Protestant voters (45%) and minority Protestant voters (46%) say they would be less likely to vote for a candidate who opposes immigration reform, roughly twice as many who say they would be more likely to support such a candidate (22% and 18% respectively). Half of Catholic voters say they would be less apt to cast a ballot for a candidate who opposes immigration reform, while only 18% say this would make them more inclined to vote for such a candidate. A majority of white mainline Protestant voters (56%) and religiously unaffiliated voters (60%) also say opposing immigration reform would decrease their likelihood of voting for a candidate.
Repealing the 2010 health care law
Opposition to the 2010 health care law, in the form of supporting its repeal, provides a modest advantage for candidates running for Congress this year. Forty-two percent of voters say they would be more likely to support a candidate who is in favor of repealing the 2010 health care law, while slightly fewer (37%) say they would be less likely to vote for such a candidate. About 1-in-5 (18%) voters say the health care law will not influence their voting decision.
However, opposing the health care law is a greater asset among Republican voters than it is a liability among Democratic voters. Nearly 8-in-10 (78%) Republican voters and 87% of Tea Party voters say they would be more likely to support a candidate who favors repealing the recent health care law. In contrast, 62% of Democratic voters report that they would be less likely to cast a ballot for a candidate who supports a repeal. Among independent voters, 44% would be more likely to support a candidate advocating repeal, while 34% would be less likely.
Supporting same-sex marriage
Among voters overall, supporting same-sex marriage is about as likely to win votes as it is to cost them. Roughly one-third (34%) of voters say they would be more likely to vote for a candidate who favored allowing gay and lesbian couples to marry, while nearly as many say they would be less likely to support such a candidate (33%). About one-third (32%) of voters say the issue would not influence their voting decision in either direction.
Like opposition to health care, there is asymmetry between Republican and Democratic voters on the issue of same-sex marriage. Supporting same-sex marriage is a greater political liability among Republican voters than it is a benefit among Democratic voters. Sixty-three percent of Republican voters say they would be less likely to vote for a candidate who favors same-sex marriage, compared to half (50%) of Democratic voters who say they would be more likely to support such a candidate.
Supporting or opposing President Obama
A candidate’s perceived support for President Obama may influence Americans’ voting decisions. Given Obama’s flagging approval ratings, candidates who oppose him are currently better positioned among voters than candidates who support him.
More than 4-in-10 (41%) voters say they would be less likely to vote for a candidate who supports the President. Less than one-third (31%) say they would be more inclined to vote for a candidate supporting the President and 27% say it would not make a difference. Eight-in-ten (80%) Republican voters say they would be less likely to vote for a candidate who supports the President compared to 61% of Democratic voters who say they would be more likely to cast a ballot for such a candidate. Among independent voters, 41% say they would be less likely to vote for a candidate who supports the President compared to 21% who would be more inclined to vote for such a candidate.
While supporting the president is currently a net liability for candidates, opposing the President has less impact on candidate support. Thirty-five percent of voters say they would be more likely to support a candidate who opposes President Obama, while 32% say they would be less likely to support such a candidate. For 3-in-10 (30%) voters, Obama is not a significant factor in determining who they will support.
Impact of Republican Party’s Position on Immigration in 2014 Elections
Nearly 4-in-10 (37%) voters believe the Republican Party’s position on immigration reform will hurt the GOP in the 2014 elections, compared to only 11% who say it will help the party. A plurality (44%) of voters believe the GOP’s current position on immigration will not have an discernible effect on the party’s fortunes in 2014.
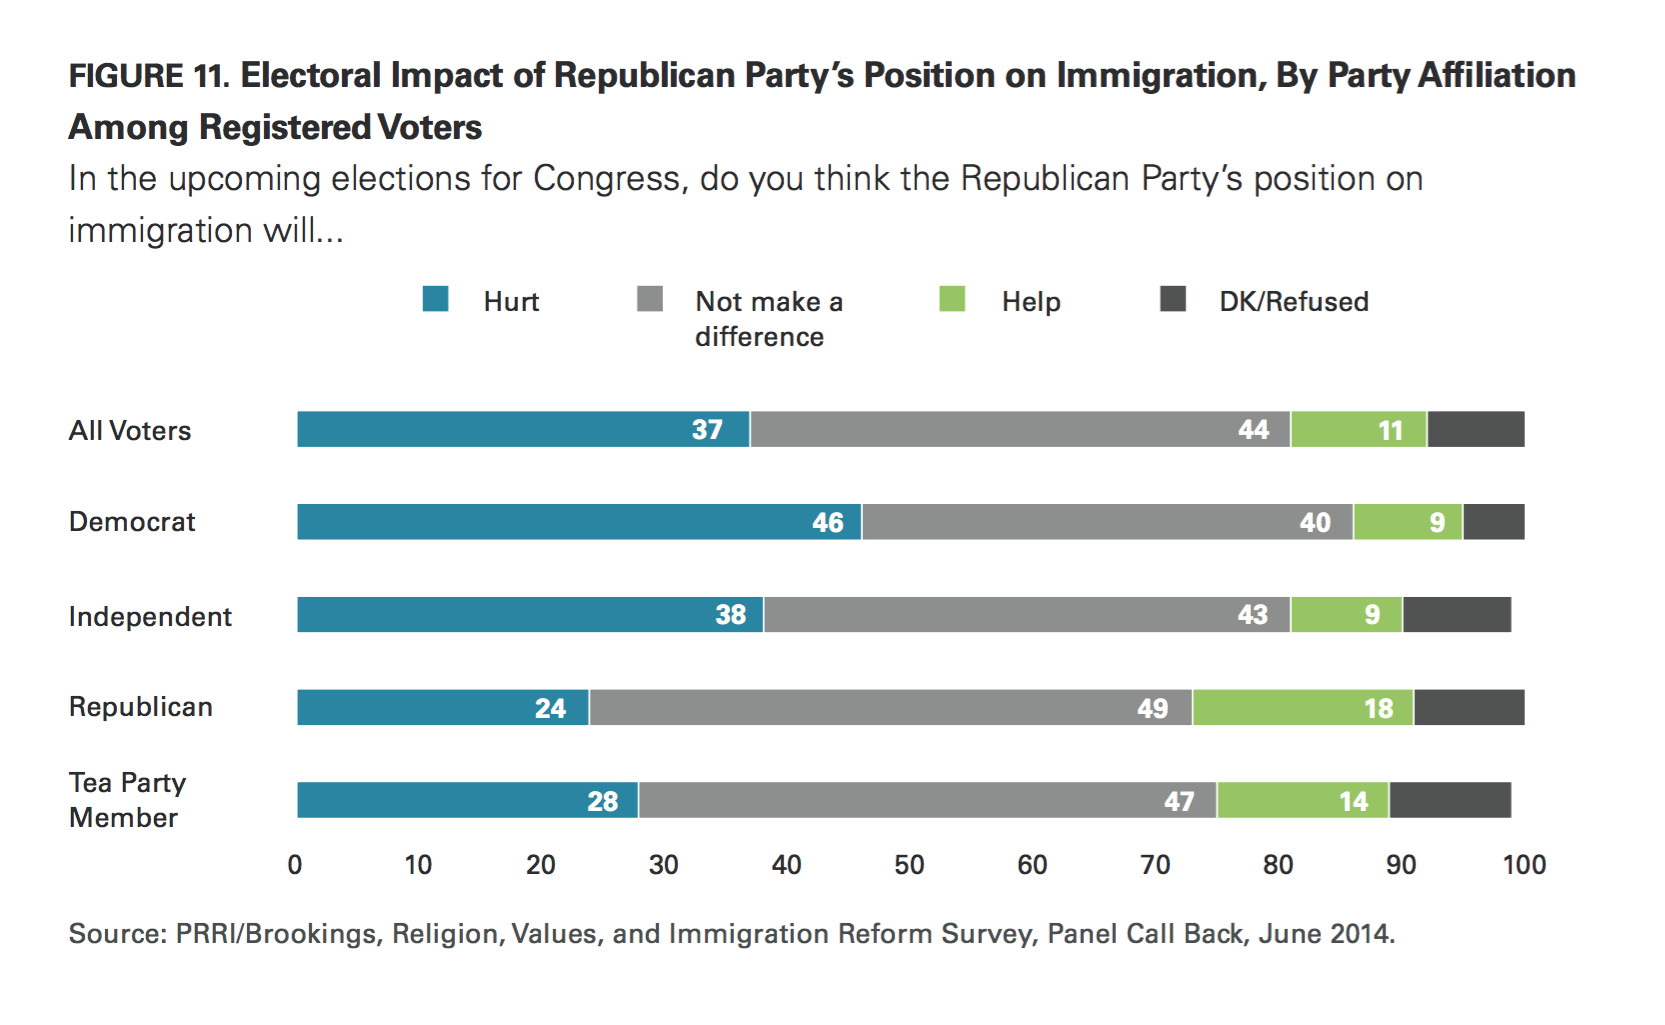
There are considerable differences of opinion between Democratic and Republican voters about the potential impact of the immigration issue on the 2014 elections. Democratic voters are much more likely to say the GOP’s position will negatively impact the party in 2014 than to say it will help (46% vs. 9%). Independent voters are also much more likely to believe the Republican position on immigration will hurt the GOP rather than help it this year (38% vs. 9%). In contrast, nearly half (49%) of Republican voters do not believe the party’s position on immigration will have any effect on its electoral prospects. Additionally, nearly as many Republican voters say the GOP’s position would help the party in the upcoming congressional elections as say it will hurt (18% vs. 24%).
VI. Other Policy Debates in 2014: Same-sex Marriage, Health Care, and Minimum Wage
Same-sex Marriage
In 2014, a majority (55%) of Americans report that they favor allowing gay and lesbian couples to marry legally, while less than 4-in-10 (39%) Americans oppose same-sex marriage.
Stark religious divisions persist in views about same-sex marriage. A majority of Catholics (55%) and white mainline Protestants (64%) favor allowing gay and lesbian people to marry. Conversely, a majority of white evangelical Protestants (72%) and minority Protestants (62%) are opposed to it. Religiously unaffiliated Americans are by far the strongest proponents of same-sex marriage with 83% expressing support for it.
Strong political divisions are also evident in views about same-sex marriage. However, opinion is becoming asymmetrically polarized with Republicans’ views growing as distant from independents as they are from Democrats. More than 6-in-10 Democrats (66%) and independents (63%) favor allowing gay and lesbian couples to marry, compared to only 27% of Republicans.
Young Americans continue to demonstrate markedly different views on the issue than older Americans. More than 7-in-10 (72%) young adults (age 18 to 29) favor same-sex marriage, including roughly half (49%) who strongly favor the policy. Among seniors, only 36% are in favor of same-sex marriage, while 57% oppose it.
The 2010 Health Care Law
Americans remain closely divided over whether they would like to see the 2010 health care law overturned. Forty-eight percent of the public favor repealing the health care law, but nearly as many (44%) are opposed.
There are strong partisan differences in views about the law. Nearly 8-in-10 (77%) Republicans support the repeal of the 2010 health care law, compared to 18% who support it. Fifty-nine percent of Democrats oppose repealing the law, compared to 31% who support it. Independents are evenly divided in their views with as many supporting repeal (45%) as opposing it (46%).
Minimum Wage
Nearly 7-in-10 (68%) Americans support increasing the minimum wage from $7.25 an hour to $10.10 an hour. Thirty percent of the public oppose a minimum wage hike of this amount.
Support for the minimum wage cuts across religious groups, although there are differences in the intensity of support. A majority of white mainline Protestants (53%), white evangelical Protestants (55%), religiously unaffiliated Americans (75%), minority Protestants (76%) and Catholics (77%) favor increasing the minimum wage to $10.10 an hour.
There are, however, dramatic political differences. Eighty-seven percent of Democrats and two-thirds (67%) of independents favor raising the minimum wage rate compared to less than half (44%) of Republicans. Only 4-in-10 (40%) Americans who identify with the Tea Party support increasing the minimum wage, while close to 6-in-10 (57%) oppose.
VII. The Varieties of American Political Polarization
By E.J. Dionne Jr. and William A. Galston
There is little debate over whether our nation is polarized politically, and our colleagues have shown in the first part of this report how this polarization plays out on many issues, particularly immigration. In this essay, we propose to explore some of the roots of polarization. We will examine one of the most important mechanisms reinforcing polarization, the news viewing habits of citizens, and demonstrate the particularly important role played by Fox News for both Republicans and conservative independents. We will also show that Americans are less divided in itemizing the problems the nation faces than they are in identifying solutions. We will explain how our survey lends strong support to the widespread view that Democrats face a turnout problem in the 2014 elections. And we will show how split Americans are over what role our country should play in the world, while noting that disagreements over intervention and non-intervention do not map at all on existing lines of polarization. On the contrary, this is a question that divides the left, the right and the center. The good news, perhaps, is that our foreign policy debate will bring new groups together across existing dividing lines, while also creating novel lines of division.
The Fox News Republicans and The Fox News Independents
In discussions of political polarization, it is common to argue that our new media environment sharpens political divisions as citizens on the left and the right consume media that reinforces their predilections. Less discussed but also important is whether ideologically-oriented media push people further along the philosophical spectrum – for example, making moderate conservatives or liberals more conservative or liberal still.
The survey provides some support for this view, but it also challenges certain media stereotypes. For example, demographically, the public radio audience, often seen as liberal, closely matches the political composition of the country. Republicans make up 23% of the entire sample and 21% of those who say they use public radio as a “news source for information about politics and current events.” Democrats make up 34% of the sample and 36% of those who say they use public radio. Independents are 40% of the broader sample and also 40% of those who report that they listen to public radio for their news.
Moreover, local television news remains one of the most widely used sources of information (76% of all surveyed), compared with 69% of respondents who say they watch cable television news, 57% who read print newspapers and magazines and 42% who listen to talk radio. It needs to be emphasized more often than it is that while politically-engaged sources of information on television, radio and online have important effects on politics, large numbers of Americans continue to use news sources that lack an obvious ideological sympathy.
Roughly three quarters of Republicans call themselves conservative, and there is little ideological difference among Republicans when they were asked a general question about which sources they use “for information about politics and current events.” The survey found that 78% of Republicans who listen to talk radio programs call themselves conservative, but exactly the same proportion of Republicans who say they listen to public radio also say they are conservative. The conservative figure for Republicans who watch cable news is 77%; for those who use online news sources, it is 76%; for local television news, it is 75%; and for those who read print sources for their news, it is 70%.
Information sources also make little difference in the ideological leanings of Democrats, but with one exception: Among Democrats who use online news sources, 56% call themselves liberal. Among the users of the other news sources, liberal self-identification is lower, ranging from 42% among cable news viewers and 43% of local television news viewers to 48% among public radio listeners.
But another question that asked respondents which specific television news sources they trust most underscored Fox News’ influence not only with Republicans but also with an important subset of conservative independents. Indeed, the survey suggests that “Fox News independents” – 26% of all independents — might become a useful demographic category for ongoing political analysis, given how different these independents are from others.
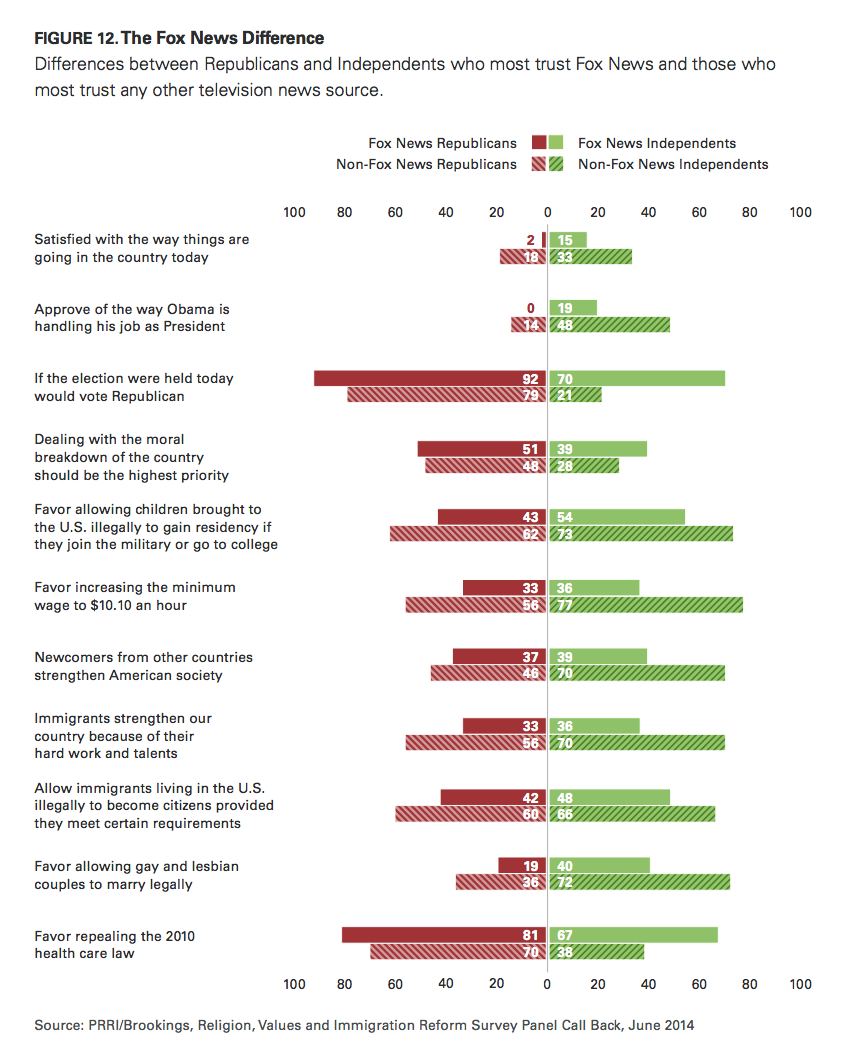
The Fox role among Republicans is clear enough: Overall, 53% of Republicans say they most trust Fox for accurate information about politics and current events, and this group is consistently more conservative than Republicans who do not trust Fox the most for their news. As our colleagues pointed out earlier in this report, there is a notable Fox difference concerning attitudes toward the immigration issue. Americans who most trust Fox as a news source are the only group among which a majority (64%) believes that the number of immigrants coming to the United States illegally has increased. Only 12% of Fox News viewers believe the number of deportations has increased (compared, with, say 24% of broadcast news viewers, 33% of CNN viewers, and 35% of public television viewers). And there is a major difference between Fox and non-Fox Republicans on immigration policy. Only 42% of Republicans who most trust Fox News support a path to citizenship for immigrants living in the country illegally, compared with 60% of other Republicans.
Fox News Republicans are also far more likely to regard themselves as members of the Tea Party movement: 35% of Republicans who trust Fox consider themselves part of the Tea Party movement, compared with 15% of non-Fox Republicans.
The Fox difference is visible across a broad range of other issues, as illustrated by Figure 12. Among Fox News Republicans, 60% say reducing the budget deficit should be among the highest priorities, compared with 46% of other Republicans. Fox News Republicans are far more forceful in their opposition to same-sex marriage: 76% are opposed to same-sex marriage, including 47% who say they are strongly opposed. Among non-Fox Republicans, only 57% oppose same-sex marriage, and only 31% strongly oppose it. One of the starkest differences between the two Republican groups came on the minimum wage. Fox News Republicans oppose increasing the minimum wage to $10.10 an hour by a margin of 64% to 33%. But non-Fox Republicans favor the wage increase, 56% to 41%.
But Figure 12 also shows the importance of Fox for independents who say it is their most trusted news source. Among independents who do not list Fox as their most trusted source, 48% approve of President Obama’s handling of his job, compared with 42% who disapprove. But among Fox News independents, 19% approve of the president’s job performance, while 80% disapprove. Fox News independents favor a Republican over a Democratic Congressional candidate by a margin of 70% to 10%. Independents who do not rely on Fox split 42% for the Democrat, 21% for the Republican. Non-Fox News independents are more likely to be undecided than Fox News independents (27% versus 16%) and slightly more likely to volunteer that they would vote for a third party candidate (6% versus 2%). Not surprisingly, 62% of Fox News independents call themselves conservative, compared with just 20% of the non-Fox independents. Among Fox News independents, 24% say they are part of the Tea Party movement; only 9% of non-Fox independents say this.
These differences are reflected across a broad range of issues. Where only 40% of Fox News independents favor same-sex marriage, 72% of non-Fox independents do; 67% of Fox News independents favor repealing the 2010 health care law, compared with 38% of non-Fox independents; 36% of Fox independents favor raising the minimum wage to $10.10 an hour, compared with 77% of non-Fox independents who favor the increase. Such differences also showed up sharply on immigration questions. When respondents were asked to choose between two options, whether immigrants “strengthen our country because of their hard work and talents” or “are a burden on our country because they take our jobs, housing and health care,” Fox News independents picked the “burden” option by a margin of 61% to 36%; non-Fox independents picked the “strengthen” option by 70% to 25%.
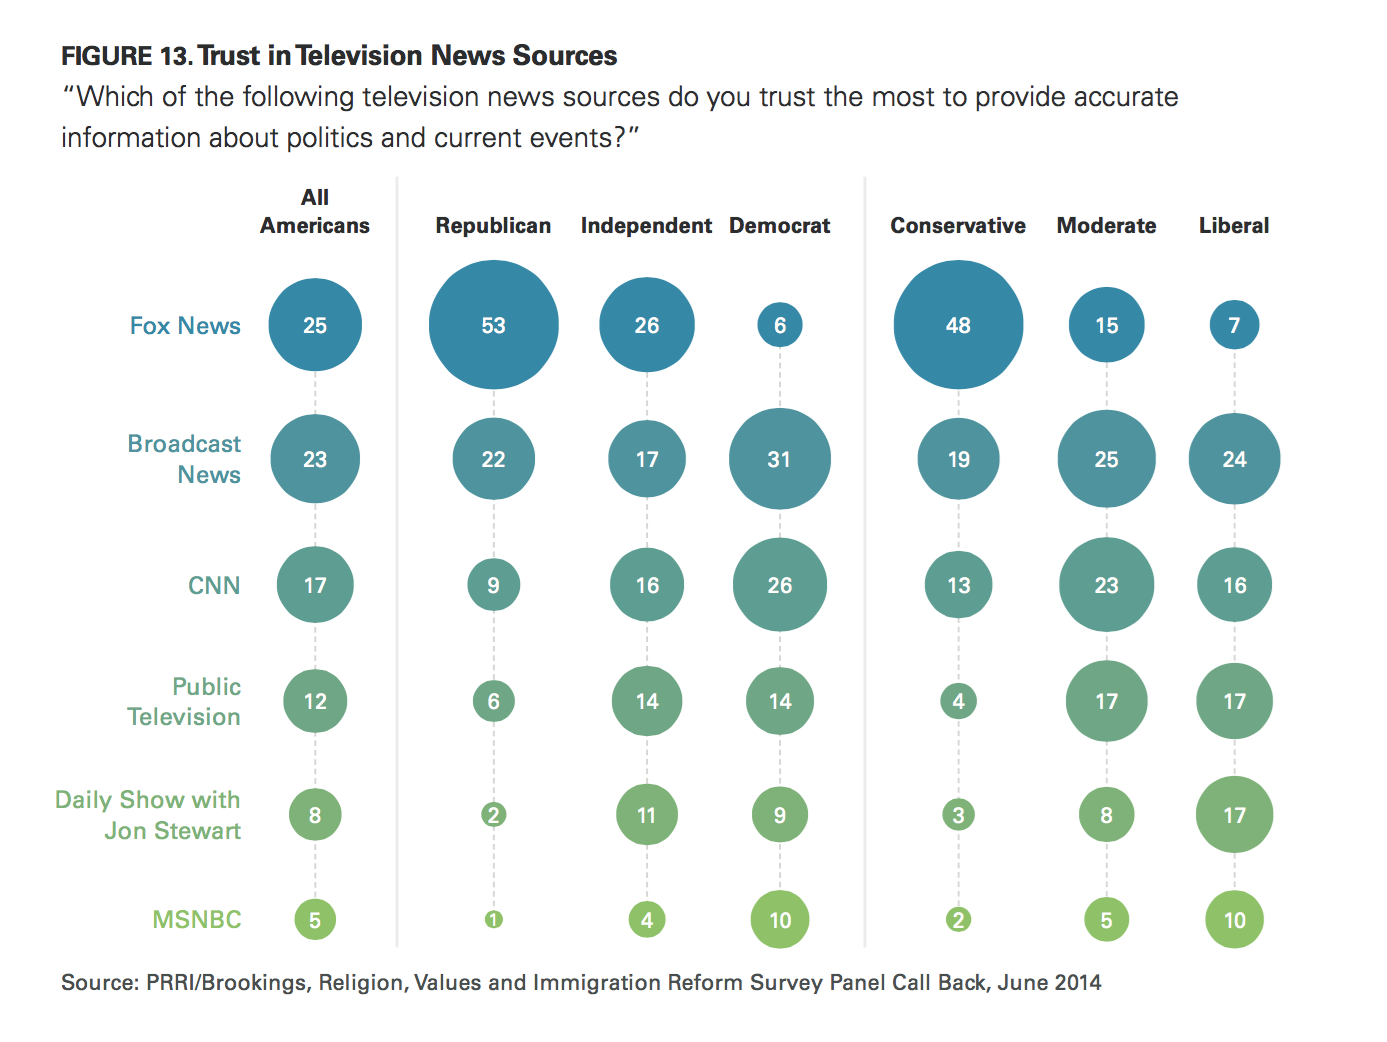
The survey also found that there is no media source that has a political role on the center or left that is comparable to Fox’s on the right. As Figure 13 illustrates, while more than half of Republicans list Fox as a trusted news source, no other source comes close. The traditional broadcast networks (ABC, CBS and NBC) are listed by 22% of Republicans, and all other television sources are in single digits. Similarly, 48% of self-described conservatives list Fox News as a trusted source, with the broadcast networks a distant second at 19%.
By contrast, there is no dominant trusted news source among Democrats or liberals. Four different sources are in double digits among Democrats — the traditional networks at 31%, CNN at 26%, public television at 14% and MSNBC at 10%. Jon Stewart’s Daily Show is listed by 9% of Democrats. Among liberals, five sources are in double digits — the broadcast networks (24%), Jon Stewart and public television (both at 17%), CNN at 16%, and MSNBC at 10%. These figures may partly reflect the ideological diversity of the Democratic Party. Whereas Republicans overwhelmingly identify as conservative (74%), the Democratic Party is more ideologically diverse, with 46% calling themselves liberal, 31% moderate, and 20% conservative.
Among independents, Fox is the plurality leader (as we have seen, at 26%) followed by the broadcast networks at 17%, CNN at 16%, public television at 14% and Jon Stewart at 11%. Among political moderates, broadcast news and CNN are the preferred choices (at 25% and 23% respectively), followed by public television at 17%, Fox at 15% and Stewart at 8%.
It is not possible from this data to offer a precise solution to the chicken-and-egg question — whether the more important fact is that those with very conservative views are already attracted to Fox, or whether Fox turns its viewers into conservatives. What is clear is that conservatives are drawn to Fox, and that Fox may, in turn, reinforce and perhaps harden conservative views. The survey also suggests that our discussions of political polarization need to take account of the unusually large role Fox News plays among conservatives and Republicans. At the moment, liberals are subject to a wider range of influences than conservatives are. Put another way, conservatives show a greater degree of solidarity, at least where their media habits are concerned. At the same time, divisions within the Republican Party can be defined at least in part by attitudes and habits related to Fox News. This could have important implications for future battles over Republican nominations and arguments over the party’s philosophical identity.
Despite Partisan Polarization, a Broad Agreement on Priorities
There is a paradox in our politics at the moment. It is obvious that our political system is deeply polarized and that the political parties advocate very different approaches to core issues such as health care and the economy. Yet at the same time, Americans across partisan, ideological, and demographic lines largely agree on the relative importance of the challenges we face.
The people as a whole see the acceleration of job creation as the top priority, with reducing the budget deficit and health care costs also scoring high. Enacting immigration reform and addressing climate change trail far behind, while dealing with moral breakdown occupies a middle position.
When we turn to subgroups, some surprising results emerge. For example when asked to rate particular issues as a highest, high or lower priority, only 36% of Hispanics regard immigration reform as a highest priority, compared to 62% who list jobs as the highest priority and 49% who cite health care costs. In fact, there are few differences over priorities across racial and ethnic lines. By substantial margins, whites, African-Americans, and Hispanics care most about job creation and least about immigration and climate change. All three groups rank moral breakdown fourth on the list of six. Whites and men as a whole care more about the deficit than about health care costs, while the reverse is the case for African-Americans and women.
One might have expected issues such as climate change and immigration reform to score high among young adults. Not so: only 22% gave a “highest priority” rating to climate change and even fewer (17%) to immigration reform. Only 29% of self-described liberals view climate change as a highest priority issue, and only 22% put immigration reform in that category.
Two things appear to be true at the same time when it comes to the political implications of immigration reform. On the one hand, as our colleagues show in their essay, opposing immigration reform appears to be more of a political liability than an asset. This helps explain why some Republican leaders are urging their party to act on a comprehensive approach. On the other hand, immigration reform ranks low on Americans’ list of priorities, which is why Republicans resisting immigration reform can argue that the risk of offending parts of their base opposed to comprehensive legislation exceeds the risk of inaction.
The findings also point to the difficulties the Obama Administration and environmentalists are facing in trying to win support for action on climate change, despite recent reports pointing to Arctic melting and other evidence suggesting both present and future problems related to climate.
Nonetheless, political polarization does have some effect on political agendas. For example, conservatives and Republicans attach a higher priority to the budget deficit and moral breakdown than do liberals and Democrats. Indeed, while the decline of public attention to the deficit owes in part to the fact that the deficit itself is now dropping, it is also the case that deficits are a far more partisan Republican and conservative issue than they once were. Among conservatives, 56% rate “reducing the budget deficit” as one of their “highest priorities,” as do 53% of Republicans. But among liberals, only 30% rate the deficit that high; among Democrats, 38% do. On this question, independents and moderates are at a halfway point between the parties. On the other hand, the Republican and conservative concern over “dealing with the moral breakdown of the country” separates them not only from Democrats and liberals but also from moderates and independents. The survey found that 50% of Republicans and 49% of conservatives gave the “highest priority rating” to dealing with moral breakdown. But only 25% of liberals, 27% of moderates, 30% of Democrats, and 31% of independents rate moral breakdown that high. This points to a challenge to Republican politicians as they try to balance the concerns of their large constituency of social and religious conservatives with efforts to reach out to other parts of the electorate. Still, it is striking that every ideological and every partisan group gives “improving the job situation” the highest priority rating, at numbers ranging from a low of 53% among independents to a high of 66% among Democrats. Interestingly, conservatives (at 58%) and liberals (at 56%) are virtually at par in their concern for job creation.
Agreement on priorities is one thing; on policies to address them, quite another. Every group cares deeply about health care costs, but the consensus ends there. Still, the people are sending clear signals about the policy agenda they wish would dominate the political debate.
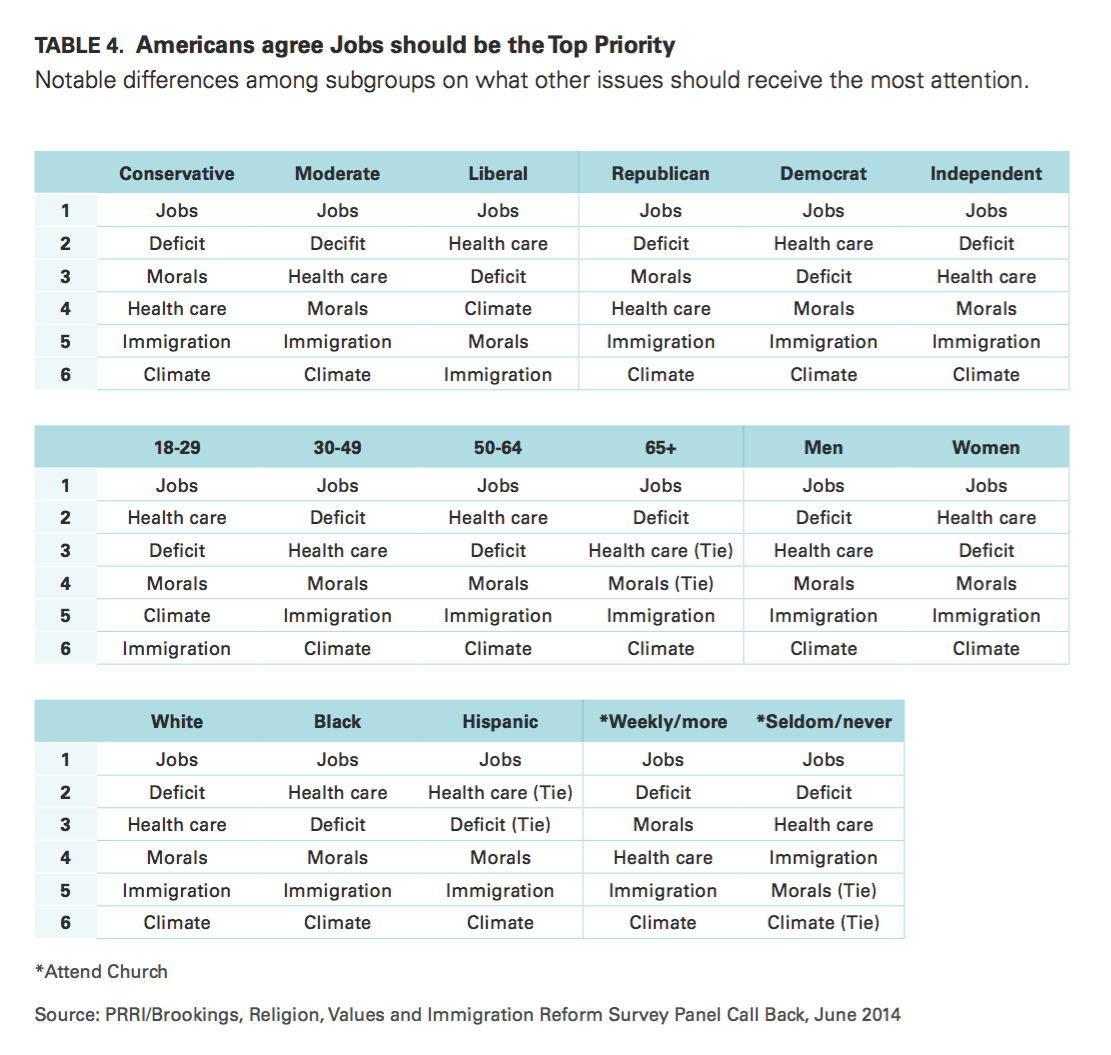
This raises an obvious question: why are the parties not focusing like a laser-beam on job creation? The short-term answer is rooted in one of our system’s significant peculiarities: although roughly 60% of Americans routinely vote in presidential elections, 40% or less do so in mid-term elections. The 40% include a large number of ardent partisans on both sides who are not a microcosm of the 60%. So in off-year elections, parties tend to emphasize issues that mobilize their most passionate core supporters.
The longer-term answer, however, reflects two uncomfortable realities about our current politics. Trust in government’s ability to manage the economy is at a very low ebb, and both parties are struggling to develop policies that respond to the new challenges of economic growth and job creation in an economy buffeted by globalization, rising inequality, and rapid technological change.
The Enthusiasm Gap
It is a new axiom in American politics that will be tested in 2014: Republican constituency groups are far more likely to turn out in mid-term elections than those loyal to Democrats. Key Democratic or Democratic-leaning constituencies — particularly the young, African-Americans, Hispanics and single women — tend to vote in large numbers in presidential years but in much smaller numbers in off-years. This phenomenon is sometimes labeled “the enthusiasm gap,” and the evidence from our survey supports its existence. In fact, there is a negative correlation between the electorate’s attitude toward President Obama and their propensity to participate this November. Put simply, the less a group approves of his job performance, the more likely they are to turn out to vote.
Starting with the basics: 68% of Republicans and 61% of conservatives report that they are “absolutely certain” to vote, compared with only 51% of Democrats and 46% of liberals. Similarly, 55% of men, but only 48% of women, are sure they will go to the polls; 57% of whites, but only 49% of African-Americans; 61% of regular church attenders versus 44% of those who rarely if ever attend.
The challenge for Democrats appears the greatest for two groups — Hispanics and young adults — who made vital contributions to Obama’s winning coalitions in both 2008 and 2012. Only 30% of Hispanics say that they are certain to vote in 2014. This may reflect a sharp decline in Hispanics’ approval of the president’s job performance—from 63% last September to only 48% in March, according to the Pew Research Center.9 (The current survey places Hispanic approval at 51%.)
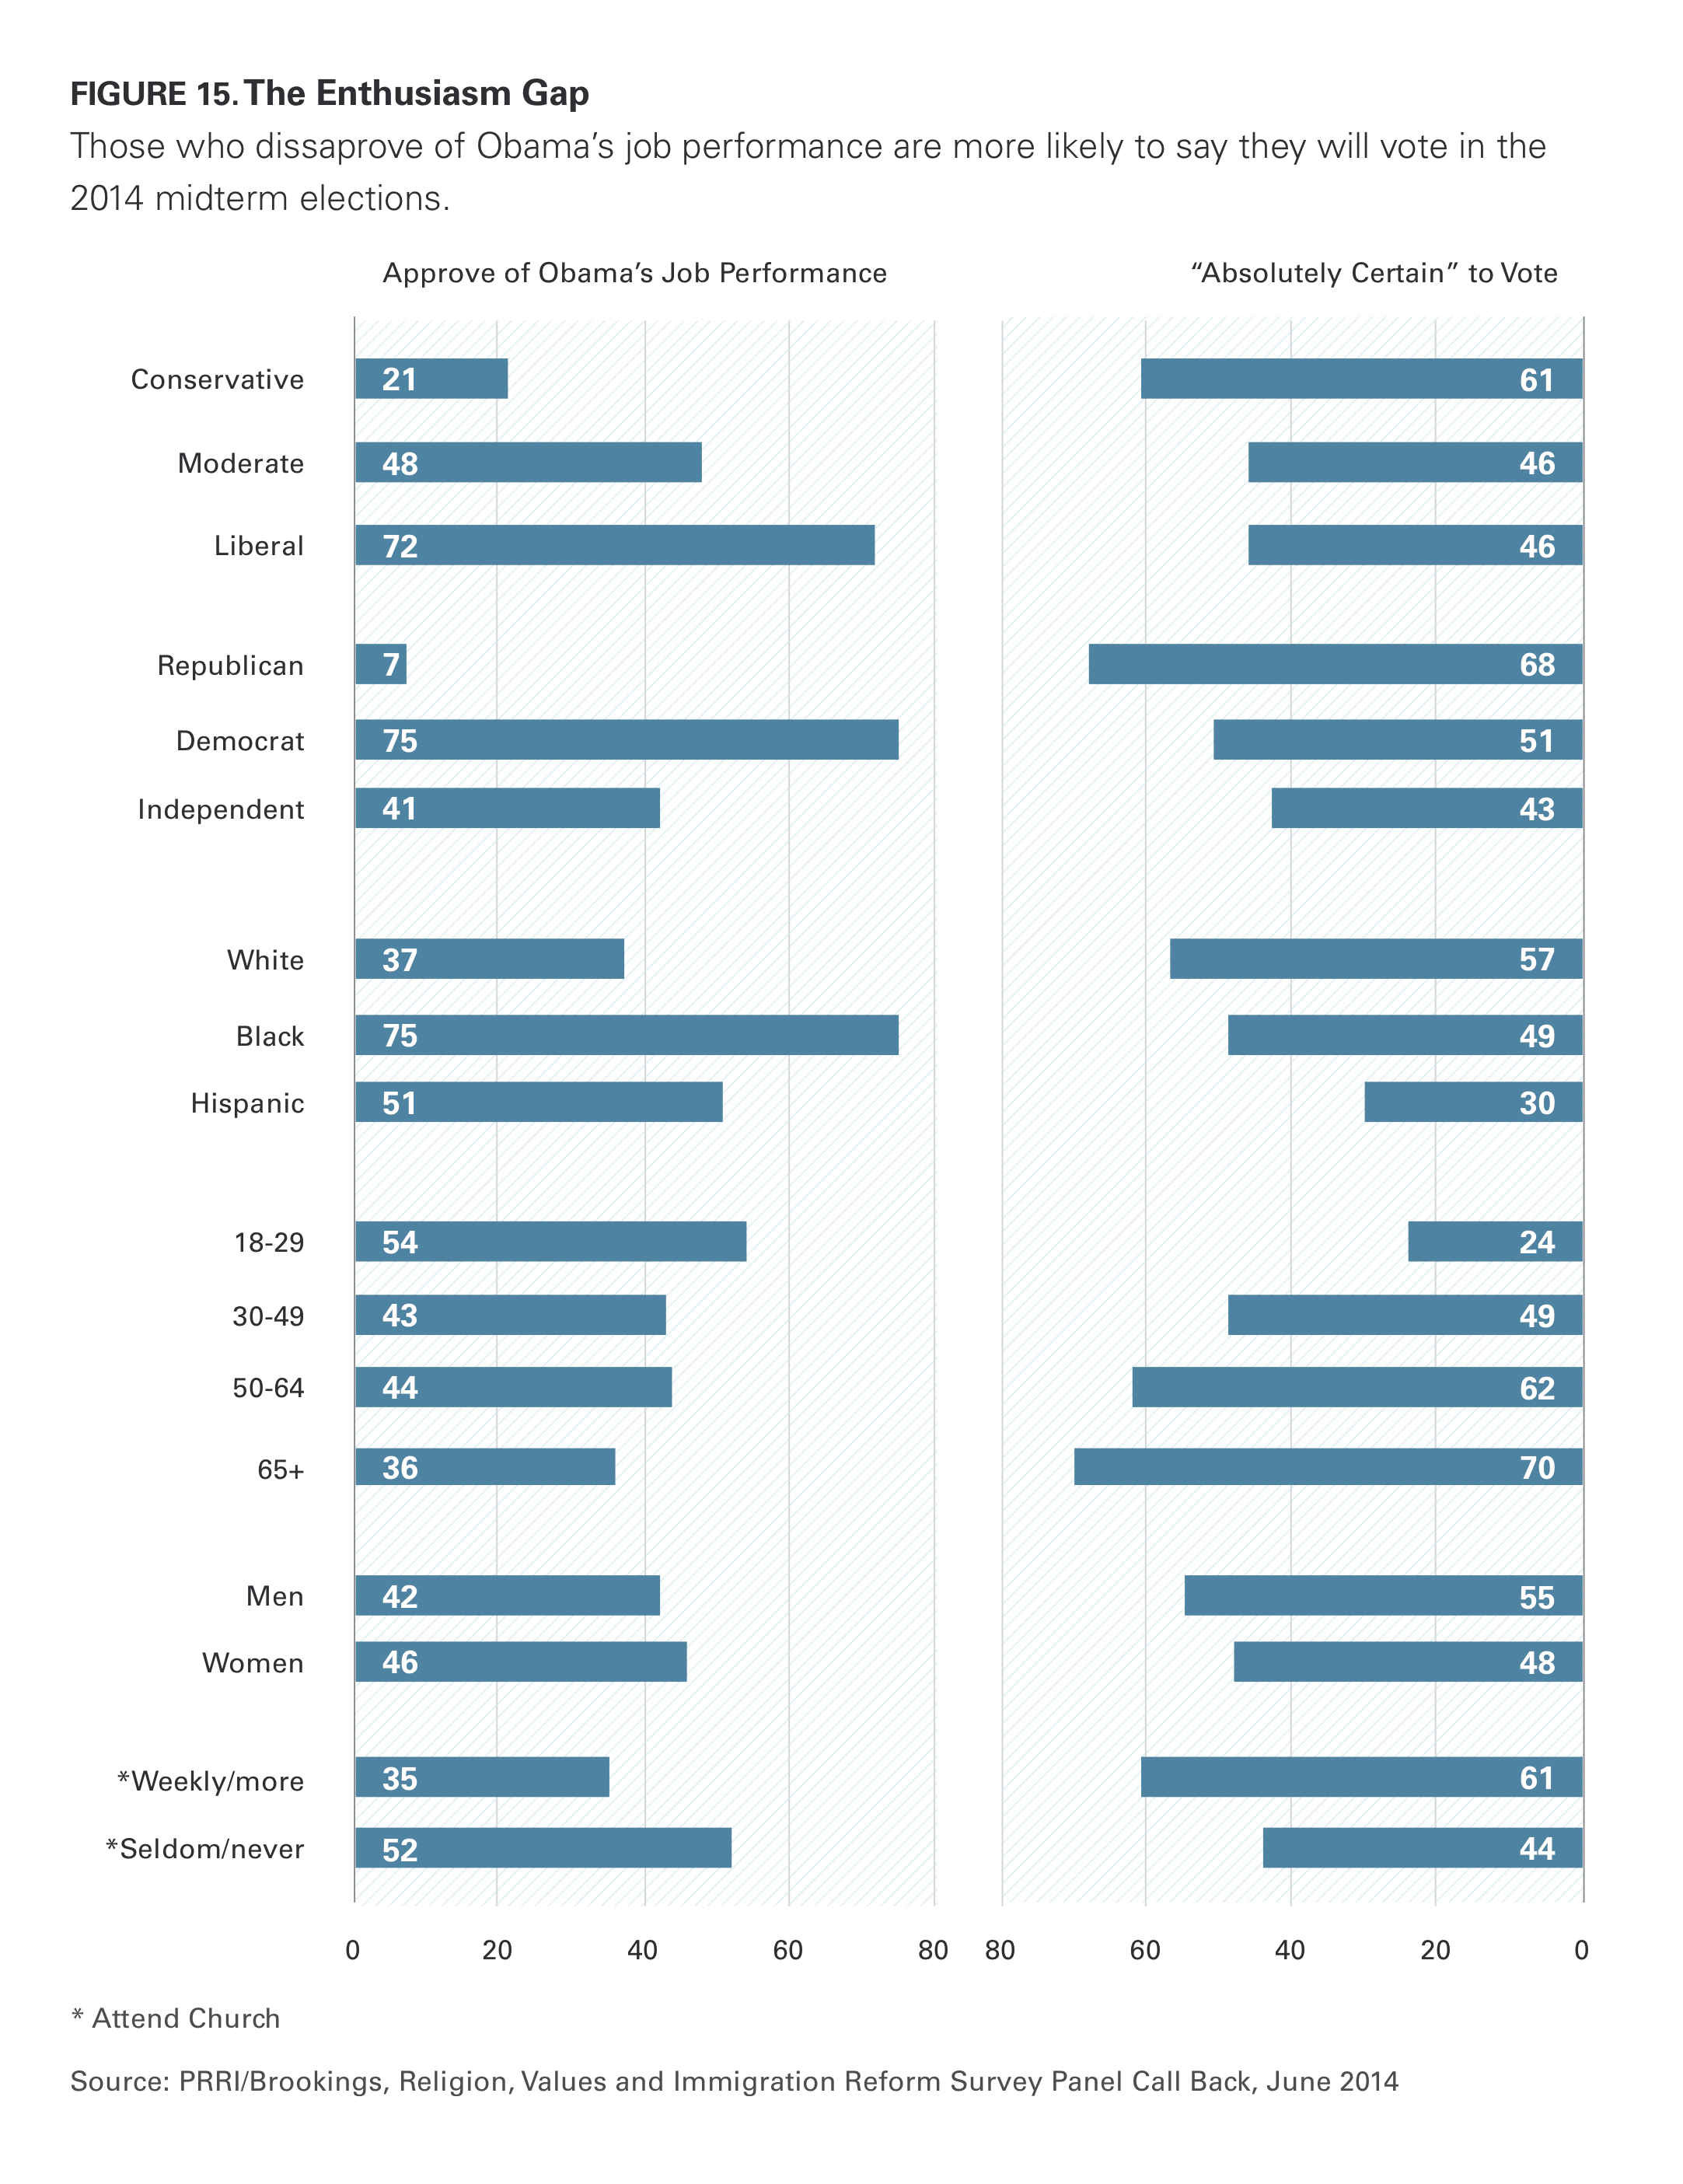
As for young adults age 18 to 29—heretofore among the president’s most ardent supporters— only 24% say that they are certain to vote, a figure we might question had not the Harvard Kennedy School’s Institute of Politics come up with a virtually identical finding in its most recent survey of young Americans’ attitudes toward politics and public service, released in late April.10 And patterns of self-reported participation among young adults track those of the electorate as a whole: Republicans more likely to vote than Democrats, conservatives more than liberals, men more than women, whites more than minorities. It is hard to miss the similarities between mid-2014 and the political terrain four years ago. Indeed, more young adults believe the nation is on the wrong track today than they did in 2010, and their approval of congressional Democrats’ performance is a bit lower. Four years ago, 31% of young adults said that they would definitely be voting in the mid-terms, 7 points higher than today.11
Here may be the summary numbers from the Institute of Politics survey: 44% of young adults who voted for Mitt Romney say they are definitely voting this November, compared to only 35% of those who voted for Obama in 2012.12
None of this proves that Republicans will repeat their sweeping victory in the 2014 midterms. In the six months prior to the 2012 election, Democrats managed to close what had been a substantial enthusiasm gap among young adults, Latinos, and others. And as Republican pollster David Winston has pointed out, “likely voter” measures applied well in advance of Election Day tend to screen out more Democrats who will actually vote than Republicans. The other major difference with 2010 is the Democrats’ deep awareness of the problem they face. (“Democrats are not perfect,” President Obama said at a Democratic fund-raiser in Chicago on May 22, “and it turns out that one of our great imperfections is we have a congenital tendency not to vote in midterm elections.”(13) For months, from the president on down, Democrats have made highly public appeals to their supporters to turn out this fall, and the party has invested substantially in turnout efforts. Only in November will we learn whether these efforts were enough to stem an adverse tide. What our survey makes clear is that the problem they are trying to solve is very real.
The Foreign Policy Divide: It is Not Partisan. It Splits Everyone
Foreign policy has loomed far larger in President Obama’s second term than in the first. During his first term the country’s focus was on recovery from the financial crash. And through the 2012 presidential election, foreign policy concerns helped the president politically, since the withdrawal from Iraq was broadly popular and the killing of Osama Bin Laden seemed to mark the end point on an especially painful period in American history. Since the president’s second inauguration, events abroad have loomed larger in the news and, to at least some degree, in the popular consciousness. And the president’s choices were more controversial – in Syria, in Egypt, in the Israeli-Palestinian peace talks, the Iranian nuclear negotiations, and, more recently, in Ukraine.
In the new circumstances, it is not surprising that Republicans have been more aggressive in their criticisms of the president’s stewardship of the nation’s international standing – not only with their long-standing focus on what happened in Benghazi, but also on the specific choices he has made. At the same time, Republicans have found themselves at odds with each other over interventionism and internationalism. Senator Rand Paul, representing the party’s libertarian wing, has tangled at various times with more interventionist Republicans such as Senators Lindsey Graham and John McCain and Governor Chris Christie.
Americans are certainly in for a serious debate over the country’s role in the world, but a striking finding of our survey is that general attitudes toward foreign policy do not fall neatly along partisan lines. Indeed, the broad issue of intervention versus non-intervention splits both parties, both left and right, races, regions and genders.
The survey offered a pair of statements that did not deal specifically with military intervention (other recent polls have shown a widespread resistance to involving American troops overseas), but with a broader conception of America’s responsibilities abroad. It asked respondents which came closest to their views: “The U.S. should mind its own business internationally and let other countries get along the best they can on their own,” or, “The U.S. has a responsibility to help people in other countries when they are in crisis.”
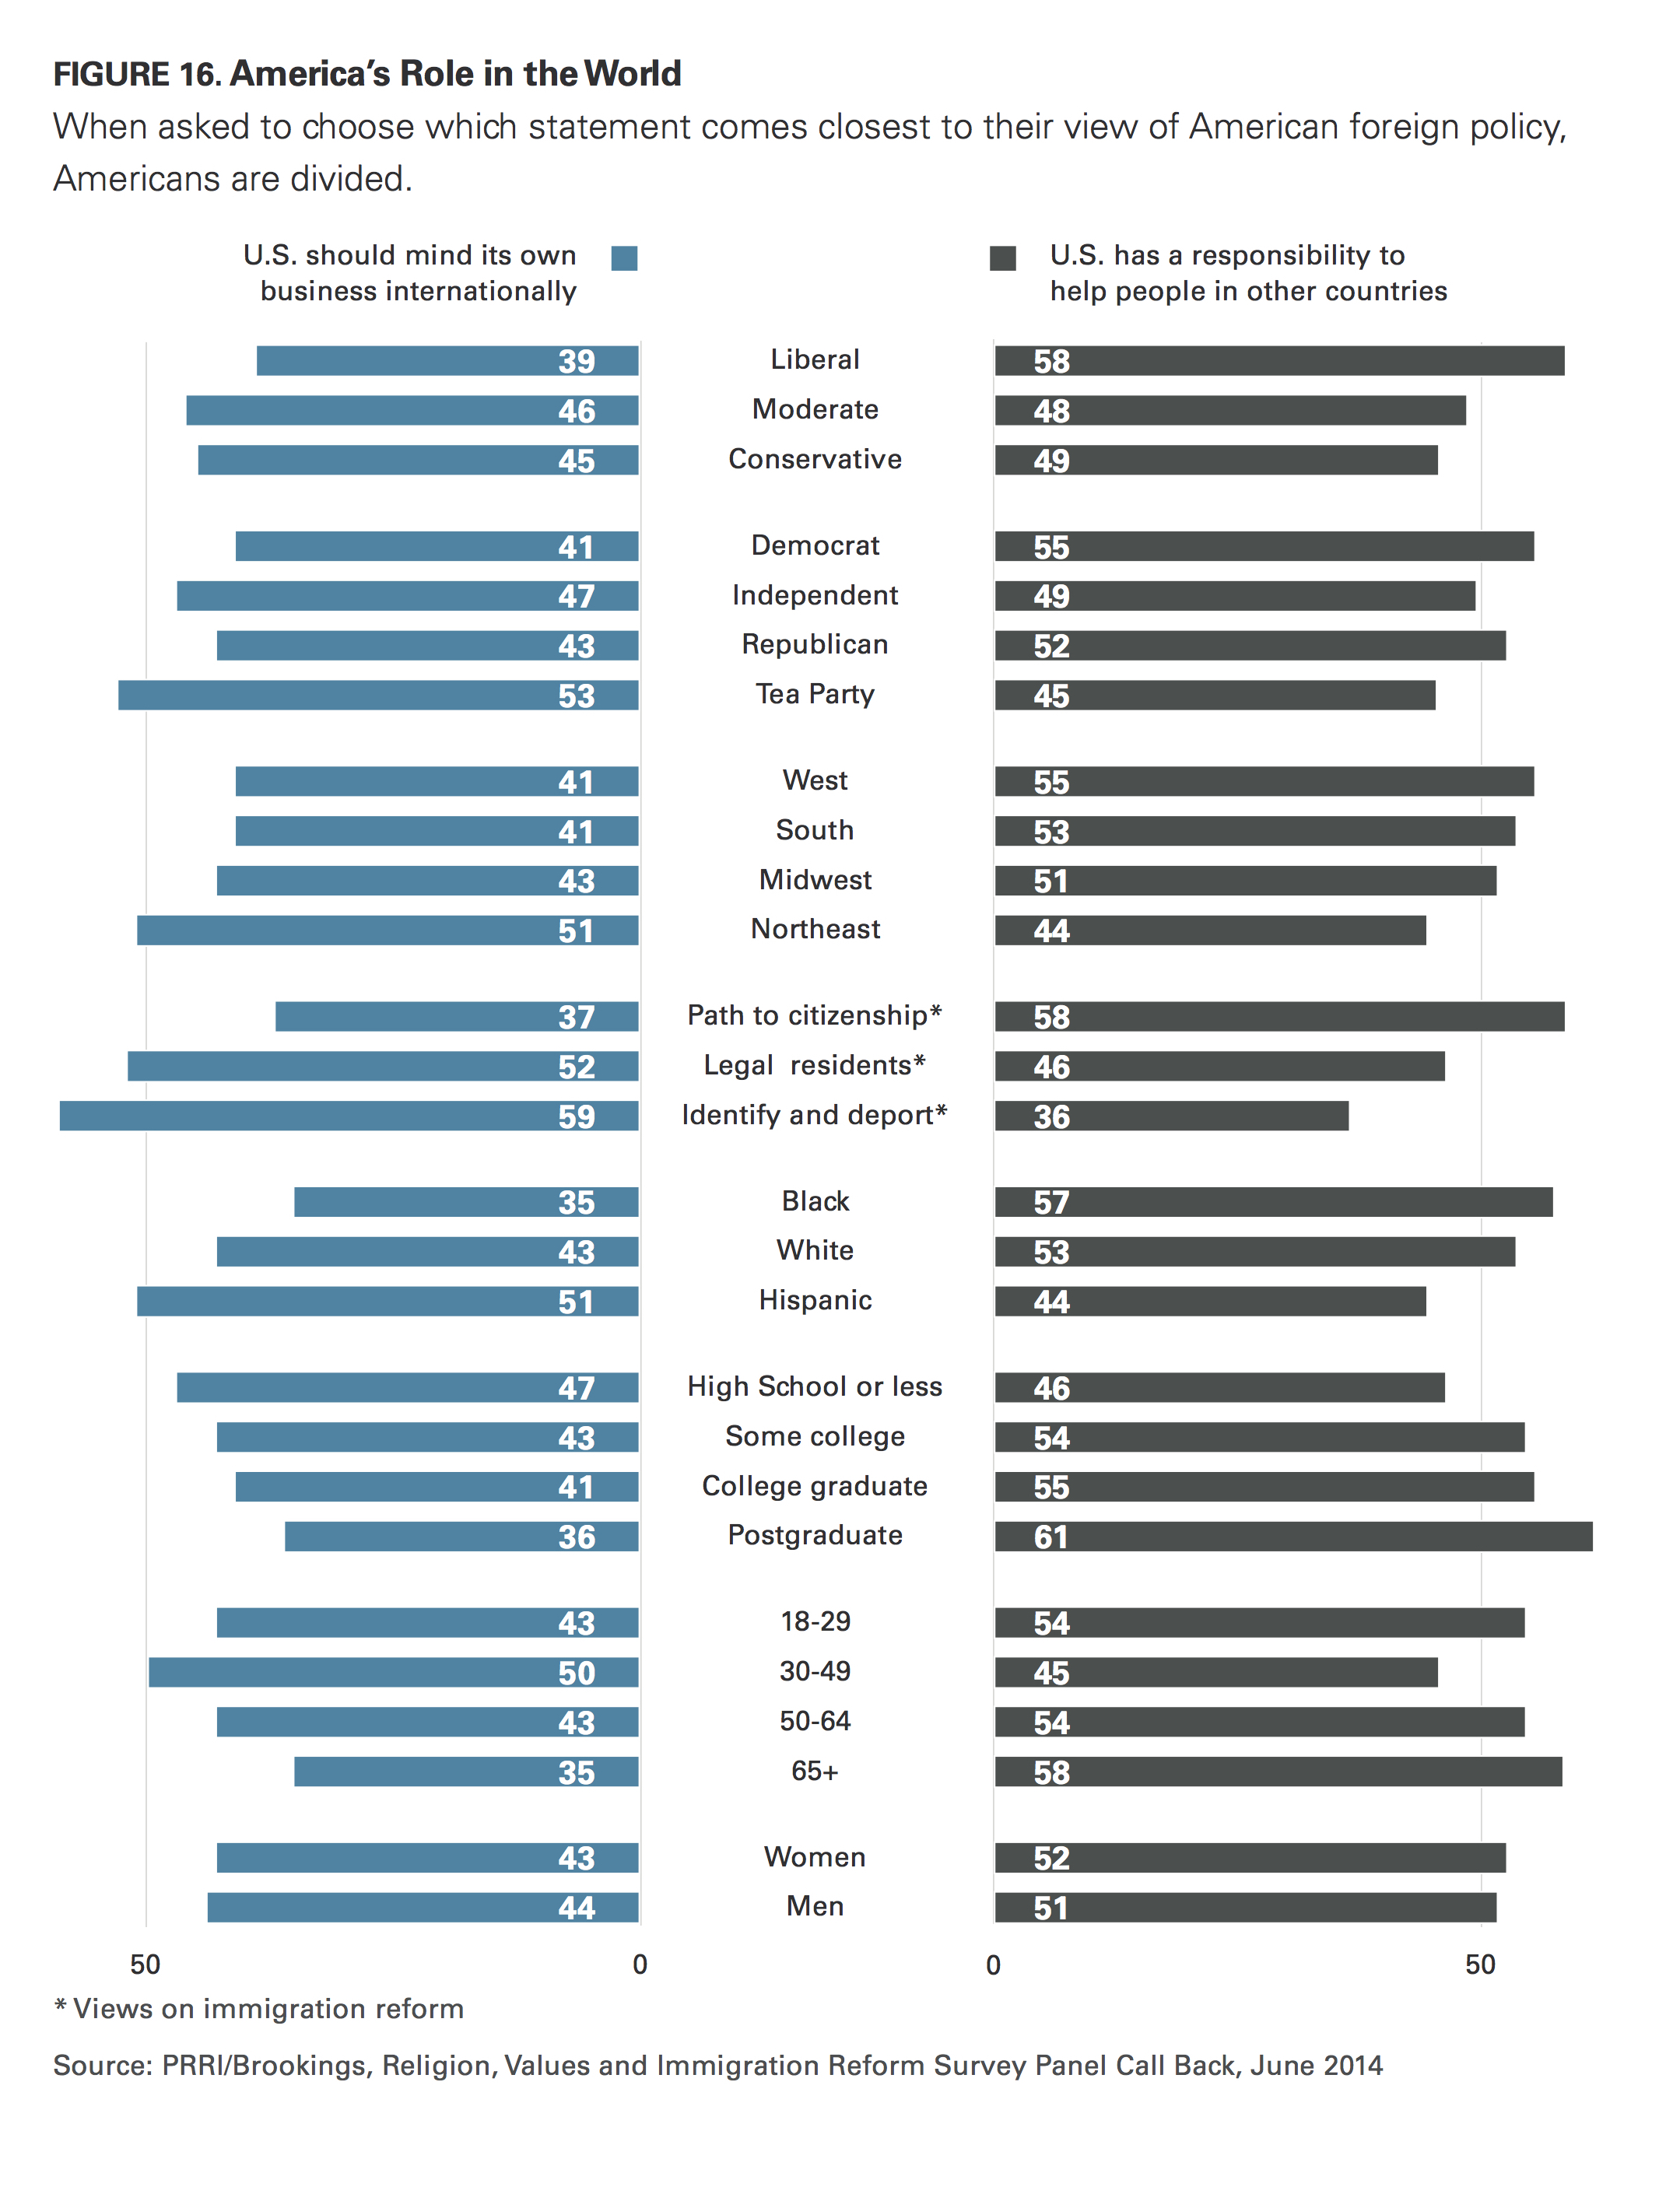
Overall, the country divided rather closely: 44% chose the anti-interventionist option, while 51% chose the interventionist option. As Figure 16 illustrates, Republicans and Democrats split in almost exactly the same way: 52% of Republicans chose the interventionist option, 43% the ‘mind our own business’ option; among Democrats, 55% chose the interventionist option, 41% the anti-interventionist choice. Liberals are somewhat more interventionist than conservatives: Liberals chose the ‘responsibility’ option, 58% to 39%; conservatives chose it by 49% to 45%. However, Tea Party supporters chose the ‘mind our own business’ option by 53% to 45% for the alternative.
Men and women split in almost exactly the same way, each group echoing the nation’s small pro-intervention majority. Whites were pro-intervention by 10 points and African-Americans by 22 points. Hispanics chose the anti-intervention option by 7 points. There is also a relationship between support for intervention and higher levels of education. The interventionist option was chosen by 61% of Americans with postgraduate education, 55% of college graduates, 54% of those with some college education, and 46% of those with a high school degree or less. There was no clear relationship by age. The oldest Americans were the most pro-intervention (those over 65 picked that option by 58% to 35%), but the youngest Americans, those aged 18 to 29 years old, were the second most pro-interventionist age group (by 54% to 43%).
There was a clear link between attitudes toward intervention and attitudes toward immigration. Those who favored a path to citizenship for immigrants living in the country illegally chose the ‘responsibility to help others’ option over ‘minding our own business’ by 58% to 37%. The numbers were almost exactly reversed among those who favored identifying and deporting immigrants living in the country illegally: 36% for intervention, 59% opposed.
The close division on the matter of interventionism suggests that the country faces a major and potentially divisive argument about its role in the world. And if the argument is polarizing, it will not reinforce existing divisions. It will draw new lines across American politics.
Endnotes
1 Unless otherwise noted, references to 2013 refer to data from PRRI/Brookings, Religion, Values, and Immigration Reform Survey, March 2013.
2 Throughout this report, the term “white Americans” refers to white, non-Hispanic Americans and the terms “black Americans” and “African Americans” are used interchangeably.
3 Public Religion Research Institute, Religion, Values, and Immigration Reform Survey, March 2010.
4 Pew Research Center for the People & the Press, Political Survey, June 2010.
5 U.S. Census Bureau, Projections Show a Slower Growing, Older, More Diverse Nation a Half Century from Now.
6 Estimates of unauthorized migration show a dramatic decline between 2007 and 2009 with this decline stalling between 2010 to 2012. The current estimate of 11.7 million immigrants who are in the country illegally remains significantly below the 12.2 million estimated to be in the country in 2007. See Passel, Jeffrey S. D’Vera Cohn and Ana Gonzalez-Barrera, “Population Decline of Unauthorized Immigrants Stalls, May Have Reversed,” Pew Research Center, September 23, 2013.
7 According to U.S. Immigration and Customs Enforcement (ICE), annual deportations increased by more than 10% between FY 2008, when nearly 370,000 immigrants were deported, and FY 2012, when about 410,000 immigrants were deported.
8 Since early 2013, PRRI has measured attitudes about immigration reform on four separate surveys and found consistently strong support for a policy that allows immigrants living in the U.S. illegally to become U.S. citizens provided they meet certain requirements.
9 Jens Manuel Krogstad and Seth Motel, “Support for Obama, health care law has eroded among Hispanics,” Pew Research Center, March 27, 2014.
10 “Survey of Young Americans’ Attitudes toward Politics and Public Service 25th Edition: March 22 – April 4, 2014,” Harvard University Institute of Politics.
11 “Survey of Young Americans’ Attitudes toward Politics and Public Service 17th Edition: January 29 – February 22, 2010,” Harvard University Institute of Politics.
12 Op. cit. 2014.
13 President Barack Obama, remarks at DSCC reception, private residence, Chicago, IL, May 22, 2014.
Recommended citation:
Jones, Robert P., Daniel Cox, E.J. Dionne Jr., William A. Galston, and Juhem Navarro-Rivera. “What Americans Want from Immigration Reform in 2014: Findings from the PRRI/Brookings Religion, Values, and Immigration Reform Survey, Panel Call Back.” PRRI. 2014. http://www.prri.org/research/immigration-reform-06-2014/.