Executive Summary
 Affinity for the Republican Party and the Democratic Party
Hispanics are three times more likely to identify as affiliated with the Democratic Party than with the Republican Party. Half of Hispanics identify with the Democratic Party (50%), compared to 15% who identify with the Republican Party. Roughly 1-in-4 (24%) Hispanics say they are politically independent.
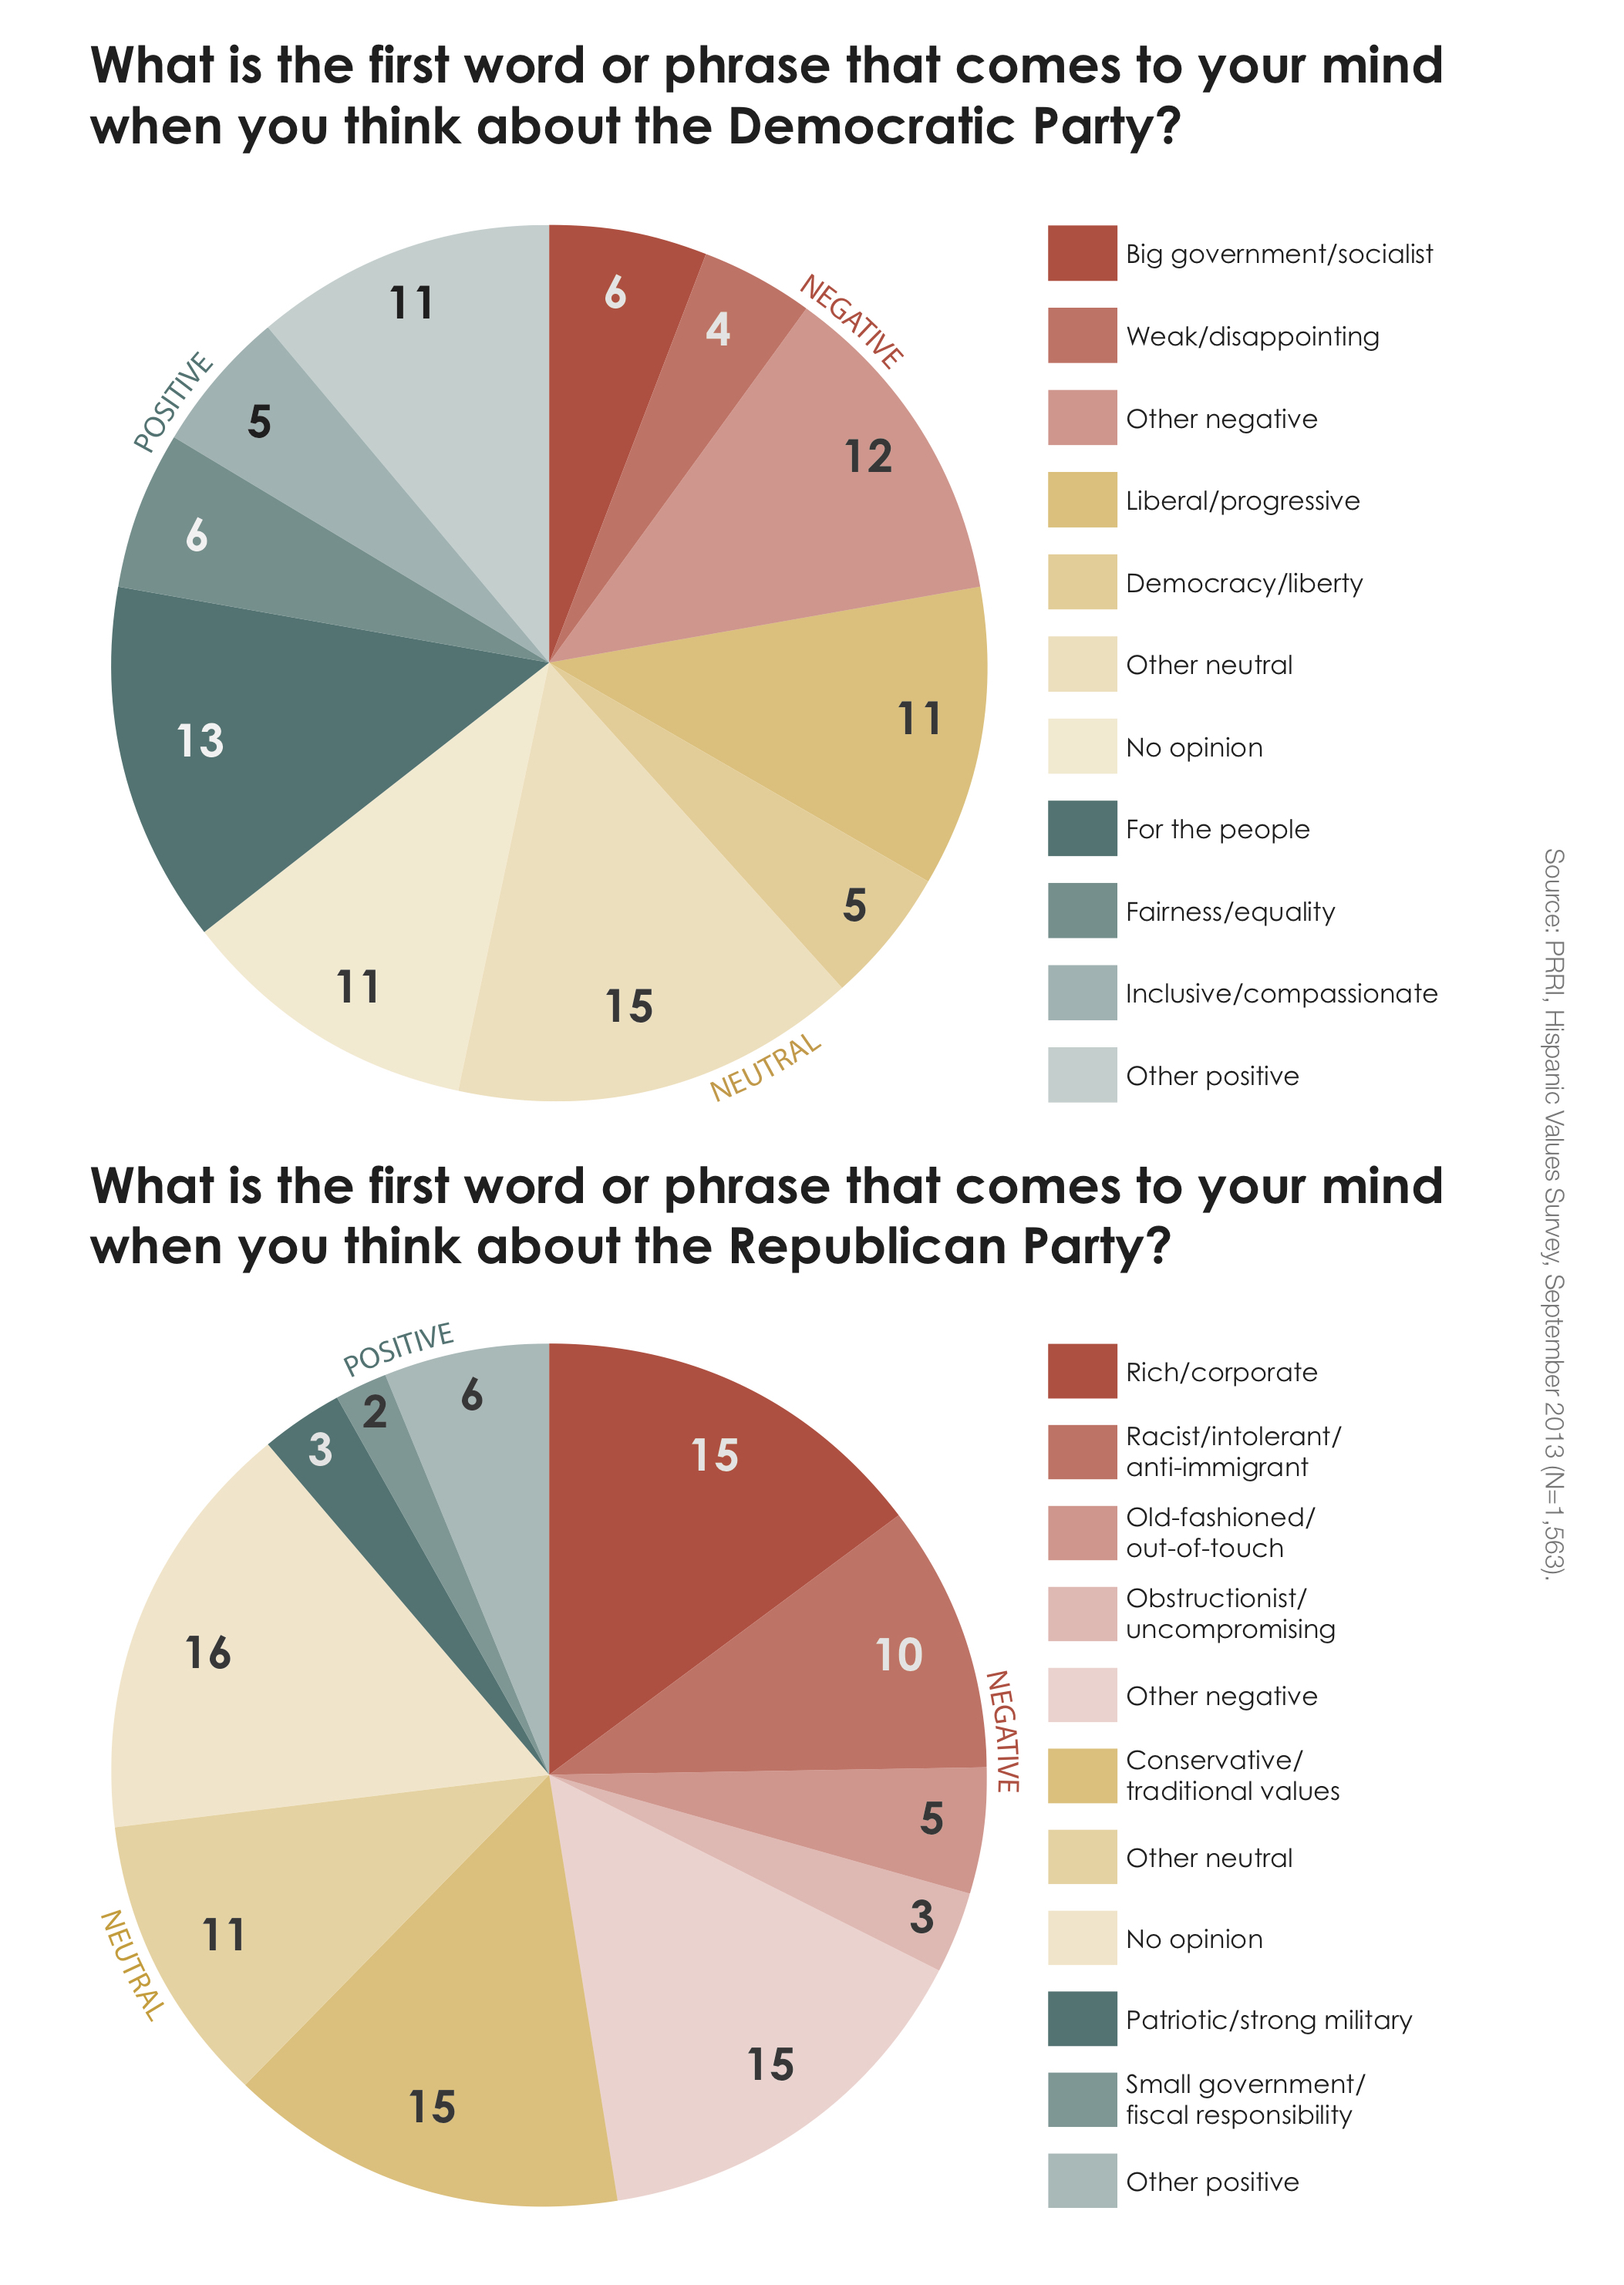
When asked to provide top-of-mind associations of the Republican Party and Democratic Party, Hispanics offer significantly more negative comments about the Republican Party than the Democratic Party. Nearly half (48%) of the associations Hispanics volunteered about the Republican Party were negative, about 4-in-10 (42%) were basically descriptive or neutral, and about 1-in-10 (11%) were positive. By contrast, more than one-third (35%) of the associations Hispanics volunteered about the Democratic Party were positive, 42% were basically neutral or descriptive, and 22% were negative.
The Democratic Party has a significant perception advantage over the Republican Party across a range of attributes. For example, 43% of Hispanics say the phrase “cares about people like you” better describes the Democratic Party, compared to 12% who say it better describes the Republican Party. Notably, about 3-in-10 (29%) say the phrase describes neither party, and 13% say it describes both parties.
Less than 3-in-10 (29%) Hispanics report that they feel closer to the Republican Party than they did in the past, while nearly two-thirds (63%) of Hispanics say the same about the Democratic Party.
At this very early stage in the 2014 election cycle, Hispanic likely voters report preferring Democratic congressional candidates to Republican congressional candidates by a 2-to-1 ratio (58% vs. 28%). Among likely Hispanic voters, a majority (54%) say they would be less likely to support a candidate who opposes immigration reform that includes a path to citizenship for immigrants who are currently living in the country illegally. One-in-four (25%) say they would be more likely to vote for such a candidate, and 19% report that the candidate’s views on immigration would make no difference in their vote.
A majority of Hispanics identify as Catholic (53%), one-quarter (25%) identify as Protestant—nearly evenly divided between evangelical Protestant (13%) and mainline Protestant (12%)—and 12% of Hispanics are religiously unaffiliated. Few Hispanics (6%) identify with a non-Christian religion.
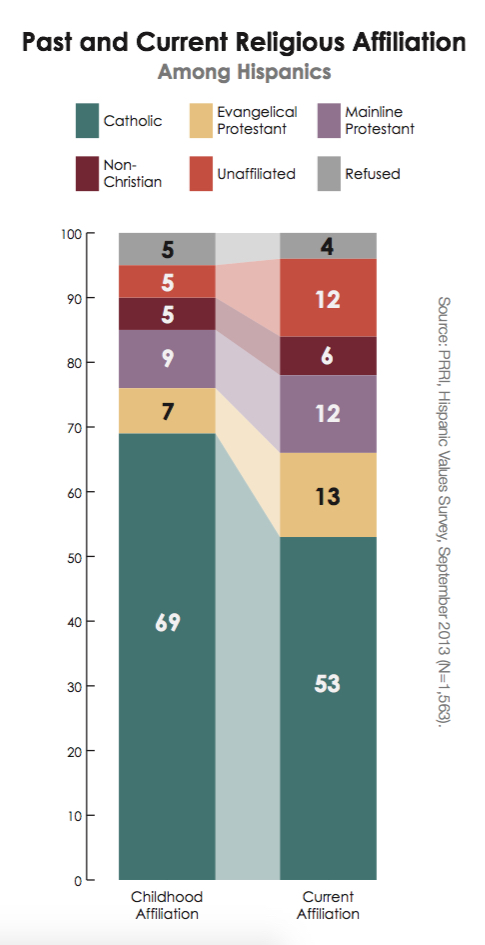 When comparing today’s Hispanic adults to their childhood religious affiliations, Catholic affiliation drops by 16 percentage points (from 69% to 53%). Evangelical Protestant affiliation has increased by 6percentage points (from 7% to 13%), while the percentage of those claiming no religious affiliation has increased by 7 percentage points (from 5% to 12%).
Hispanics generally have a more favorable impression of the current head of the Catholic Church than of the Church itself, although this favorability gap is smaller among Catholics. Nearly 7-in-10 (69%) Hispanics have a favorable view of Pope Francis, compared to 54% who have a favorable view of the Catholic Church. Among Catholics, more than 8-in-10 (84%) have a favorable view of the current pope, and roughly as many (81%) have a favorable view of the Catholic Church.
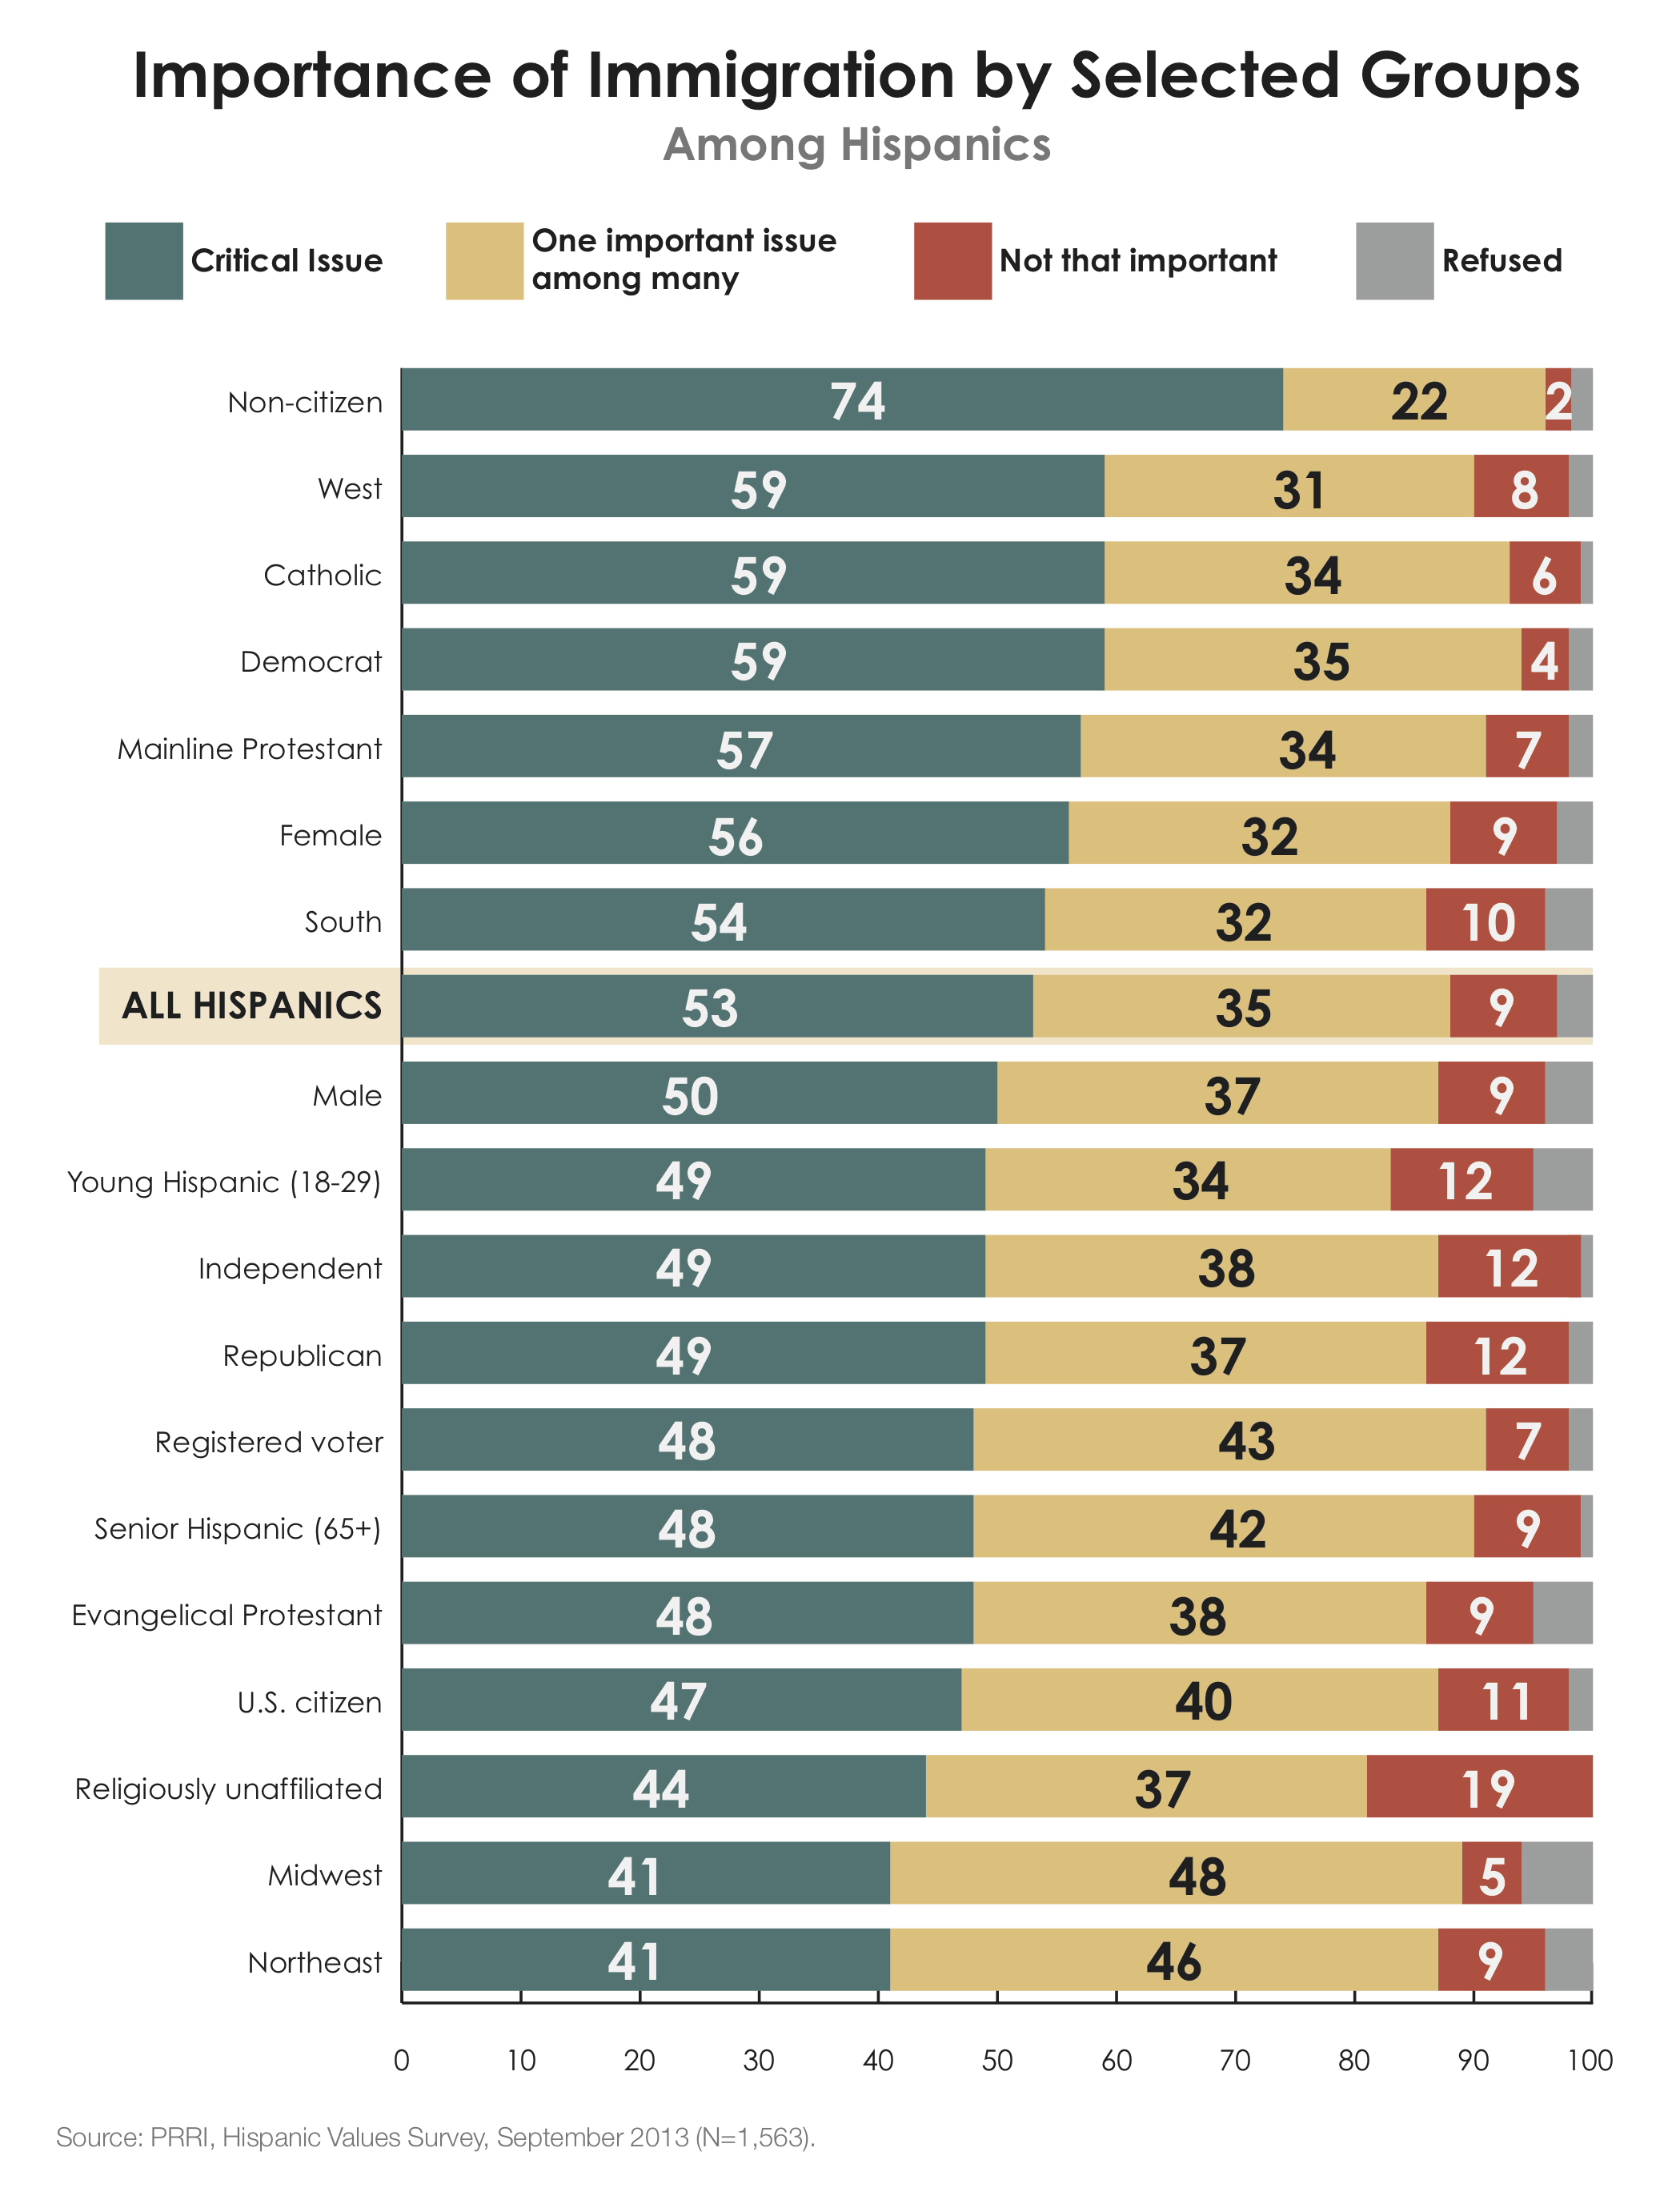
Like Americans overall, Hispanics are most likely to rank jobs and unemployment (72%) as a critical issue facing the country today. However, nearly as many Hispanics (65%) report that rising health care costs are also a critical issue facing the nation. Majorities of Hispanics say the quality of public schools (55%), the federal deficit (54%), the cost of college (53%), and immigration (53%) are critical issues facing the country. Fewer Hispanics say the growing gap between rich and poor (43%), abortion (32%), and same-sex marriage (22%) are critical issues in the country today.
Two-thirds (67%) of Hispanics say that immigrants currently living in the United States illegally should be allowed to become citizens provided they meet certain requirements. Roughly 1-in-5 (17%) say they should be allowed to become permanent legal residents but not citizens, while 1-in-10 (10%) say that they should be identified and deported. There is bipartisan and cross-religious support for immigration reform among Hispanics. For example, majorities of Hispanic Democrats (72%), independents (67%), and Republicans (53%) support a path to citizenship.
Strong majorities of Hispanics believe that the U.S. economic system unfairly favors the wealthy (72%) and that hard work and determination do not guarantee success for most people today (60%).
At the same time, a majority (56%) of Hispanics believe that children from all backgrounds have adequate opportunities to be successful in America today. Hispanics who are non-citizens (65%) and Hispanics who are naturalized citizens (63%), however, are significantly more likely than native-born Hispanics (51%) to believe that in the United States children from all income groups have adequate opportunities to be successful.
By a nearly 2-to-1 margin, Hispanics favor a public investment approach to spurring economic growth over a tax-cutting approach. Roughly 6-in-10 (58%) Hispanics believe spending more on education and the nation’s infrastructure and paying for it with higher taxes among wealthy individuals and businesses is the best way to promote economic growth. One-third (33%) of Hispanics disagree, saying the best way to boost economic growth is to lower taxes on individuals and businesses and to pay for those tax cuts by cutting spending on government services and programs.
More than 7-in-10 (72%) Hispanics agree the government should do more to reduce the gap between the rich and the poor, compared to 25% who disagree. Nearly 6-in-10 (57%) Hispanics agree that it is the responsibility of the government to take care of people who cannot take care of themselves, compared to 40% who disagree. However, there are notable concerns among Hispanics about people taking advantage of government benefits. A majority (56%) of Hispanics believe that most people who receive welfare are taking advantage of the system, while 30% think most welfare recipients are genuinely in need of help.
Most Hispanics support the principle of a government guarantee of health care, but they are divided on Obamacare. Nearly 6-in-10 (58%) Hispanics agree that the government should guarantee health care for all citizens, even if it means raising taxes, compared to 39% who disagree. At the same time, nearly half (48%) of Hispanics support repealing and eliminating the 2010 health care law known as Obamacare, while about as many (47%) oppose repealing the law.
Hispanics are on different sides of the cultural divide on the issues of same-sex marriage and abortion. A majority (55%) of Hispanics favor allowing gay and lesbian Americans to marry, compared to 43% who are opposed. By contrast, a majority (52%) of Hispanics say abortion should be illegal in all or most cases, compared to 46% who say abortion should be legal in all or most cases.
Hispanics appear willing to support allowing gay and lesbian couples to marry legally, even if they personally hold reservations about the morality of sex between two adults of the same gender. Hispanics are twice as likely to believe that sex between two adults of the same gender is morally wrong as believe it is morally acceptable (45% vs. 18%). Roughly one-third of Hispanics say either that it depends on the situation (8%) or that it is not a moral issue (26%).
Hispanics have a nuanced, situational view of the morality of having an abortion. Hispanics are three times more likely to say that abortion is morally wrong than to believe it is morally acceptable (32% vs. 9%). However, nearly half (48%) say their moral evaluation of abortion depends on the situation, and nearly 1-in-10 (9%) say that having an abortion is not a moral issue.
Hispanics are sharply divided by religion on the issue of same-sex marriage. More than 6-in-10 (62%) Hispanic Catholics and 8-in-10 (80%) religiously unaffiliated Hispanics favor allowing gay and lesbian couples to marry. Hispanic mainline Protestants are divided, with 47% supporting same-sex marriage and 50% opposing it. In stark contrast, 8-in-10 (79%) evangelical Protestants oppose same-sex marriage, while just 1-in-5 (21%) support it.
Hispanics are also sharply divided by religion on the issue of abortion. Less than half (47%) of Hispanic Catholics say abortion should be legal in all or most cases; a majority (52%) say abortion should be illegal in all or most cases. Mainline Protestants have a similar profile to Catholics on this issue. Evangelical Protestants have the most conservative footprint of any religious group on this issue, with nearly three-quarters (74%) saying abortion should be illegal in all or most cases. By contrast, nearly 7-in-10 (69%) religiously unaffiliated Hispanics say abortion should be legal in all or most cases.
Hispanic Catholics report more freedom to deviate from official church teachings on homosexuality than on abortion. A slim majority (51%) of Hispanic Catholics say it is possible to disagree with church teachings on the issue of homosexuality and remain a good Catholic, compared to 44% who say this is not possible. However, less than 4-in-10 (39%) Hispanic Catholics say it is possible to disagree with church teachings on abortion and still be considered a good Catholic, compared to a majority (55%) who say this is not possible.
I. A Profile of the Hispanic Community in the United States
Growth as Share of U.S. Population and Voters
In recent years, the U.S. Hispanic community has received significant attention from scholars and the media due to its explosive growth and rising political and cultural significance. Fifty-three million Americans—17% of the U.S. population—now identify ethnically as Hispanic or Latino, according to the U.S. Census Bureau, making Hispanics the largest ethnic minority group in the United States.(1) To put this into perspective, the Hispanic population in the United States is larger than the total population of any single country in the Americas with the exception of Mexico (population 116 million).(2) Additionally, the nearly 38 million Spanish-speaking U.S. residents make it the fourth-largest Spanish-speaking country in the Americas, after Mexico, Colombia, and Argentina.
During the past two decades, Hispanic voters have made up an increasingly large share of the American electorate in successive elections. In 2012, Hispanic voters accounted for nearly 1-in-10 (8%) voters overall, doubling the percentage of the Hispanic voting population from the 1992 presidential election.(3) Yet, the potential political clout of the Hispanic vote has not yet been fully realized due to relatively low registration and turnout rates among Hispanic adult citizens. Among the nearly two-thirds (67%) of Hispanic adults who are U.S. citizens, 59% are currently registered to vote.(4) Although Hispanics accounted for 8% of voters in the 2012 presidential election, Hispanic adult citizens account for 11% of all U.S. adult citizens.
Basic Demographic Profile: Age, Education, Income, and Region
According to U.S. Census figures, Hispanics are much younger than Americans overall. Nearly three-quarters (73%) of Hispanic adults are younger than 50, including more than 3-in-10 (31%) who are younger than 30. Roughly 3-in-10 (27%) Hispanic adults are age 50 or older while only 9% are 65 years or older. The median age for all Hispanics is 27.8, compared to 42.6 for non-Hispanic whites.(5)
Hispanics have much lower levels of educational attainment than Americans overall. A majority of Hispanic adults report they have a high school diploma (30%) or a high school education with no diploma (33%). Nearly 1-in-4 (23%) report having some college education or an associate’s degree, while roughly 1-in-10 Hispanic adults have graduated from a four-year college (9%) or hold a post-graduate degree (4%).(6)
On average, Hispanics also have lower household incomes than Americans overall. Six-in-ten Hispanic households report an annual income of $50,000 or less, including more than one-third (37%) which report incomes of less than $30,000 per year. About 3-in-10 (28%) Hispanic households report an annual income of between $50,000 and $100,000, and 13% report an annual household income of more than $100,000.(7)
The Hispanic Values Survey finds that despite having a lower socioeconomic status than Americans overall, Hispanics are not more negative in their evaluations of the economy or their own personal financial situations than Americans overall. A plurality of Hispanics say they have seen no change in the economy (40%) or their own financial situation (49%) during the last two years. About 3-in-10 (31%) Hispanics believe the economy has gotten better during the last two years, and 27% think it has gotten worse. Roughly 1-in-5 (22%) Hispanics say their personal financial situation has improved during the last two years, while 28% say it has gotten worse.
Hispanics live predominantly in the South and West regions of the United States, reflecting recent patterns of immigration. More than three-quarters of Hispanic adults live in the American South (36%) or West (40%), while 14% live in the Northeast and less than 1-in-10 (9%) live in the Midwest.(8)
National Heritage and Citizenship
There is considerable diversity in the ancestry of Hispanics currently living in the United States. Nearly two-thirds (64%) of Hispanics are from Mexico or have Mexican heritage. More than 1-in-10 (13%) report having Puerto Rican (9%) or Cuban (4%) ancestry or origins. Taken together, Mexicans, Puerto Ricans, and Cubans make up roughly four-fifths of the total Hispanic population. The remainder is comprised of Hispanics with Central American or other Caribbean ancestry such as Salvadorans, Guatemalans, and Dominicans (13%), followed by South American ancestry such as Argentinean or Colombian (6%), and Hispanics who claim Spanish ancestry (5%).
Half (50%) of Hispanic adults now living in the United States were born outside the country, while the other half are native-born. Two-thirds (67%) of Hispanic adults are U.S. citizens, compared to one-third (33%) of Hispanic adults who are not U.S. citizens.(9)
There is significant variation among Hispanics in their connection to immigrants living in the United States illegally. Overall, one-third (33%) of Hispanics report they currently have a close friend or family member living in the United States illegally. Hispanic citizens are half as likely as non-citizens to report that they have a close friend or family member living illegally in the United States (27% vs. 56%).
Language and Media Usage
More than 4-in-10 (42%) Hispanics report that they are bilingual, compared to one-third (33%) who report they are primarily Spanish speakers, and about one-quarter (26%) who report they are primarily English speakers.(10)
Despite the fact that a plurality of Hispanics are bilingual, they are more likely to get their news from English rather than Spanish sources. According to the Hispanic Values Survey, a majority of Hispanics follow news and current events in English (35%) or mostly in English (21%). Roughly 1-in-5 (17%) say they follow news in both Spanish and English equally. Nearly 1-in-4 Hispanics prefer Spanish language media, reporting that they are more likely to follow news in Spanish than in English (16%) or that they follow news only in Spanish (8%).
Political Profile: Ideology and Party Affiliation
The Hispanic Values Survey finds that, compared to Americans overall, Hispanics are less likely to identify as politically conservative and more likely to identify as moderate. Hispanics are about equally as likely as Americans overall to identify as liberal. Close to half (45%) of Hispanics identify as politically moderate, 27% identify as conservative, and 23% identify as liberal.(11)
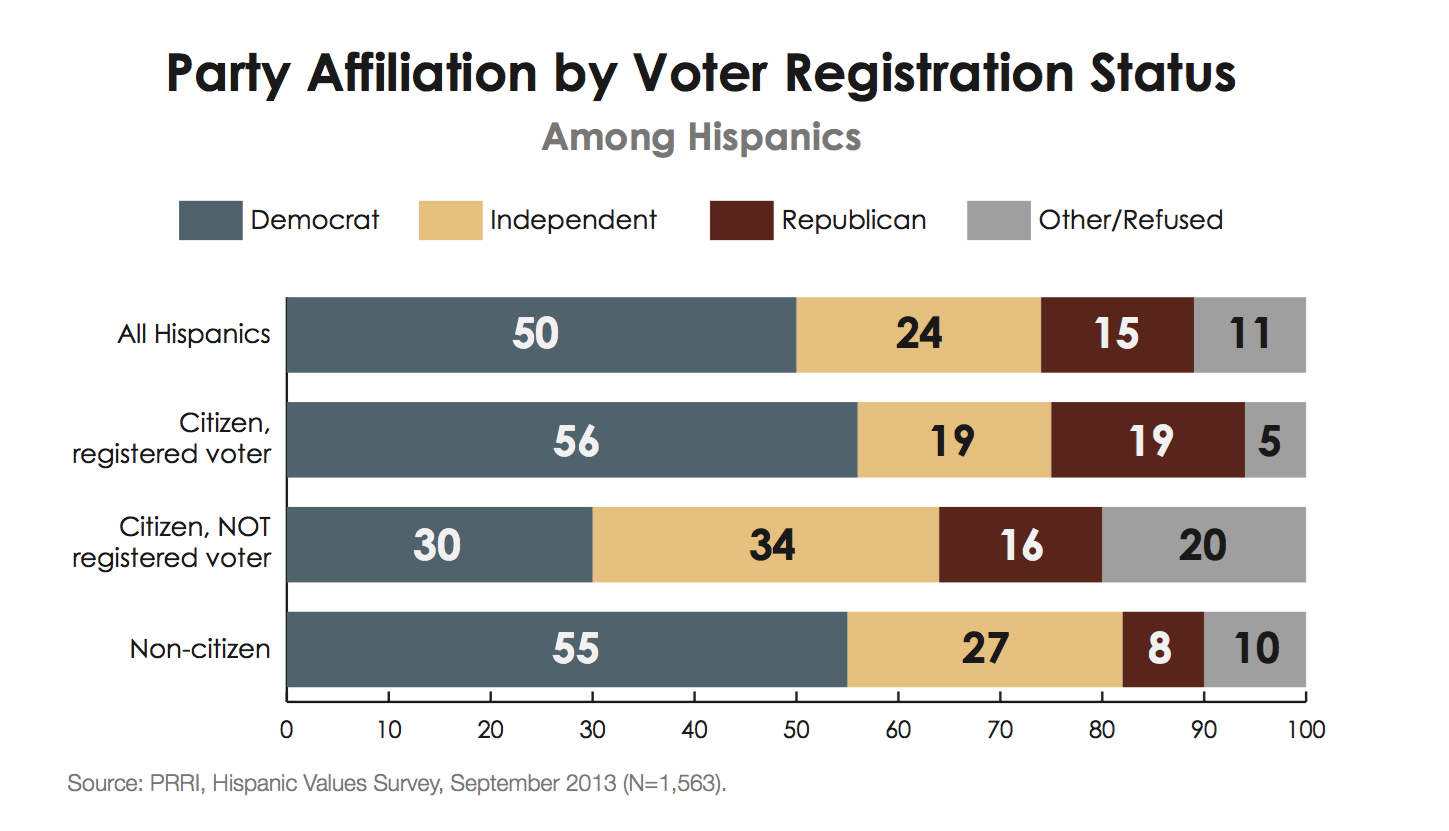 Hispanics are three times more likely to identify as affiliated with the Democratic Party than with the Republican Party. Half of Hispanics identify with the Democratic Party (50%), compared to 15% who identify with the Republican Party. Roughly 1-in-4 (24%) Hispanics say they are politically independent.
Among Hispanic registered voters, 56% identify with the Democratic Party, compared to 19% who identify with the Republican Party and 19% who identify as independent. Among Hispanic citizens who are not currently registered to vote, the Democratic advantage is significantly smaller; about one-third (30%) identify with the Democratic Party, compared to 16% who identify with the Republican Party. Nearly half (47%) of Hispanic citizens who are not registered to vote identify as independent (34%) or claim some other affiliation (14%).
II. A Religious Portrait of the Hispanic Community in the United States
Religious Belonging: Beyond the Catholic/Evangelical Divide
Today, Latin America is the most Catholic region in the world(12) due to its legacy of Spanish and Portuguese colonization. This Catholic heritage remains visible among Hispanics in America today. A majority of Hispanics identify as Catholic (53%), one-quarter (25%) identify as Protestant—nearly evenly divided between evangelical Protestant (13%) and mainline Protestant (12%)—and 12% of Hispanics are religiously unaffiliated. Few Hispanics (6%) identify with a non-Christian religion.
However, although Catholicism remains the majority religious affiliation among today’s Hispanic adults in the United States, its dominance has declined considerably when measured against respondents’ childhood affiliations. Today, Hispanic adults are significantly less Catholic, more Protestant, and more unaffiliated than they were as children. Nearly 7-in-10 (69%) Hispanics report they were raised Catholic, 16% report they were raised Protestant (9% as mainline, 7% as evangelical), and 5% report they were raised without a religious affiliation. Additionally, 5% say they were raised in other non-Christian religions.
While the media and academic literature have recently noted the declining proportion of Catholics and increasing number of Protestants in the U.S. Hispanic community over time, the narrative has often emphasized Catholics converting to evangelical or charismatic forms of Protestantism. The Hispanic Values Survey reveals that this is only half of the story. When comparing today’s Hispanic adults to their childhood religious affiliation, Catholic affiliation drops by 16 percentage points but growth does not merely accrue among evangelical Protestants. The ranks of both evangelical Protestants and the religiously unaffiliated have grown at roughly equal rates. Evangelical Protestant affiliation has increased by 6 percentage points (from 7% to 13%), while the percentage of those claiming no religious affiliation has increased by 7 percentage points (from 5% to 12%). The percentages of mainline Protestants have remained relatively steady; 12% of Hispanics identify as mainline Protestant today, compared to 9% who were raised as mainline Protestant.
There is evidence that this dynamic of becoming simultaneously less Catholic and more Protestant and unaffiliated is connected with the experience of immigrating to and living in the United States. Hispanics who were born outside of the United States are more likely to identify as Catholic (64%) than Hispanics overall, and are less likely to identify as Protestant (9% mainline, 11% evangelical) or religiously unaffiliated (11%). By contrast, among Hispanics born in the United States, 46% identify as Catholic, 31% as Protestant (16% mainline, 15% evangelical), and 14% as religiously unaffiliated.
Religious Behavior: Salience, Attendance, and Tradition
Overall, patterns of religious behavior and beliefs among Hispanics generally mirror those in the general American population. However, patterns vary widely by religious affiliation.
Nearly two-thirds of Hispanics say religion is the most important thing in their lives (17%) or that religion is one among many important things (48%). Three-in-ten Hispanics say religion is not as important as other things (17%) or that religion is not important in their lives (13%). Among Hispanic Catholics, nearly three-quarters say it is either the most important thing in their lives (12%) or one among many important things (62%). Hispanic mainline Protestants look like Hispanics overall, with about two-thirds reporting that religion is either the most important thing in their lives (22%) or one among many important things (46%). By contrast, nearly 9-in-10 Hispanic evangelicals report that religion is the most important thing in their lives (50%) or that it is one among many important things (36%).
Measures of religious attendance reveal similar patterns. Overall, approximately one-third (32%) of Hispanics report attending religious services weekly or more, and a similar number (28%) report attending monthly or a few times a year. About 4-in-10 (38%) Hispanics report that they seldom or never attend religious services. Catholics and mainline Protestants do not differ in the frequency of their religious attendance from Hispanics overall, while evangelical Protestants are significantly more likely to attend religious services regularly. Nearly two-thirds (64%) of Hispanic evangelical Protestants report attending religious services weekly or more, with an additional 23% reporting they attend monthly or at least a few times a year; only about 1-in-10 (13%) evangelical Protestants report they seldom or never attend religious services. Nearly 9-in-10 (87%) religiously unaffiliated Hispanics report seldom or never attending religious services.
Overall, religiously affiliated Hispanics are more likely to believe their church should preserve traditional beliefs and practices (43%) than they are to believe that their church should adjust traditional beliefs in light of new circumstances (32%) or adopt modern beliefs and practices (11%). Evangelical Protestants are particularly likely to believe that their church should preserve traditional beliefs and practices (70%), while the preferences of Hispanic Catholics and mainline Protestants mirror those of Hispanics overall.
Religious Beliefs: The Bible, God, and Morality
Nearly two-thirds of Hispanics believe that the Bible is the word of God, and half that number (33%) believe that it should be taken literally word for word, while similar numbers (28%) believe that not everything in the Bible should be taken literally. One-quarter (25%) of Hispanics believe the Bible is a book written by men and is not the word of God. Hispanic Catholics and Hispanic mainline Protestants generally resemble Hispanics overall. Hispanic evangelical Protestants and unaffiliated Hispanics, however, have distinct profiles. More than 6-in-10 (62%) Hispanic evangelical Protestants believe the Bible is the literal word of God, and an additional 25% believe that the Bible is the word of God but that not everything in it should be taken literally. In contrast, 7-in-10 (70%) religiously unaffiliated Hispanics believe that the Bible is a book written by men and is not the word of God.
About 6-in-10 (58%) Hispanics believe God is a person with whom one can have a relationship, while 27% say God is an impersonal force. Only 5% of Hispanics report that they do not believe in God. Hispanic Catholics closely resemble Hispanics overall, with 59% believing God is a person and 32% believing God is an impersonal force. Mainline Protestants are significantly more likely than Catholics to believe God is a person (69%) and less likely to believe God is an impersonal force (25%). More than 8-in-10 (85%) evangelical Protestants believe God is a person with whom one can have a relationship. Notably, just 30% of unaffiliated Hispanics report that they do not believe in God. A majority of religiously unaffiliated Hispanics believe God is a person with whom one can have a relationship (24%) or that God is an impersonal force in the universe (31%).
Hispanics closely associate a belief in God with moral behavior. More than 6-in-10 (62%) Hispanics say that it is necessary to believe in God to be moral and have good values, including 8-in-10 (80%) evangelical Protestants and 7-in-10 (70%) Catholics. Mainline Protestants are more divided (55% agree, 44% disagree). Not surprisingly, nearly 8-in-10 (78%) religiously unaffiliated Hispanics reject the idea that one must believe in God to be moral.
Institutions and Leadership: Views of the Catholic Church and Pope Francis
Hispanics generally have a more favorable impression of the current head of the Catholic Church than of the Church itself, although this favorability gap disappears among Catholics. Nearly 7-in-10 (69%) Hispanics have a favorable view of Pope Francis, compared to 54% who have a favorable view of the Catholic Church. However, views differ sharply on both the pope and the Church by religious affiliation.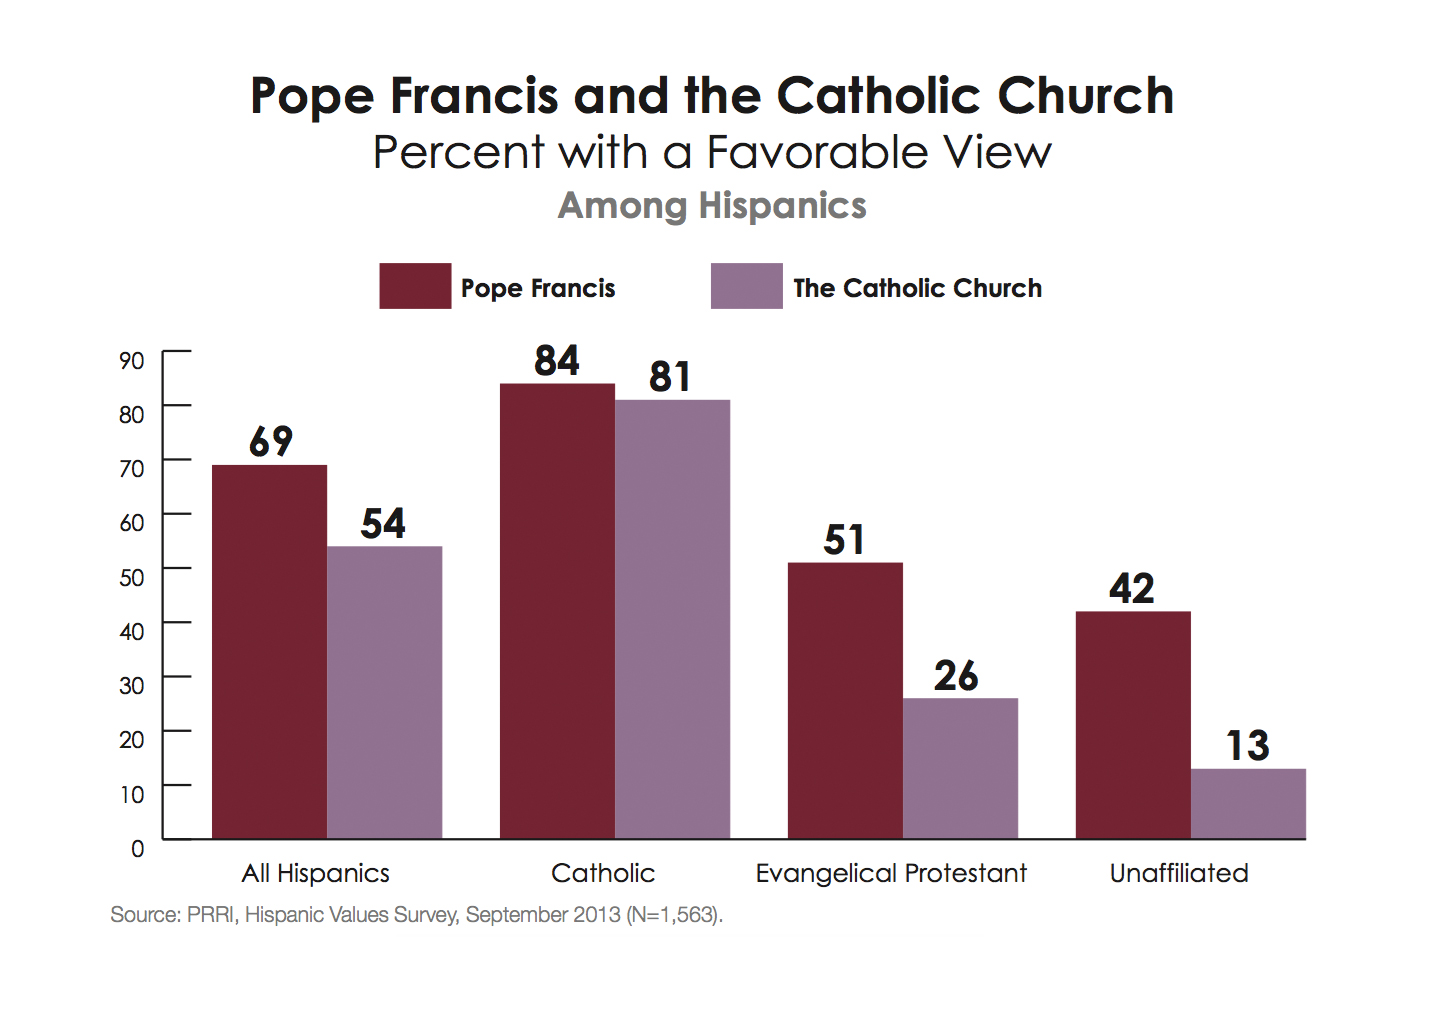 Among Catholics, more than 8-in-10 (84%) have a favorable view of Pope Francis, and roughly as many (81%) have a favorable view of the Catholic Church. Evangelical Protestants have much less favorable views of each than Catholics do, but they are about twice as likely to have a positive view of Pope Francis than the Catholic Church (51% vs. 26%). Unaffiliated Hispanics are also likely to see the pope more positively than the Catholic Church.(13) Roughly 4-in-10 (42%) unaffiliated Hispanics view the pope favorably, while only 13% view the Church favorably. Nearly three-quarters (74%) of unaffiliated Hispanics have an unfavorable view of the Catholic Church. In contrast, only about 1-in-5 (21%) unaffiliated Hispanics have an unfavorable view of the pope; one-third (33%) report that they have not heard of him.
Younger (age 18-29) Hispanics (59%) are significantly less likely than Hispanic seniors (85%) to hold a favorable view of Pope Francis, although 20% of young Hispanics report being unfamiliar with the pope. Roughly 4-in-10 (42%) younger Hispanics have a favorable view of the Catholic Church, compared to nearly 6-in-10 (58%) Hispanic seniors.
III. Political Priorities and Issues
Political Priorities
Like Americans overall, Hispanics are most likely to rank jobs and unemployment (72%) as a critical issue facing the country today. However, nearly as many Hispanics (65%) report that rising health care costs are also a critical issue facing the nation. Majorities of Hispanics report that the quality of public schools (55%), the federal deficit (54%), the cost of college (53%), and immigration (53%) are critical issues facing the country. Fewer Hispanics say that the growing gap between rich and poor (43%), abortion (32%), and same-sex marriage (22%) are critical issues in the country today.
Although Hispanics are more likely to believe immigration is a critical issue than Americans overall, there is considerable diversity of opinion among Hispanics by political affiliation, religious identity, education, and citizenship status.(14) Nearly 6-in-10 (59%) Hispanic Democrats say immigration is a critical issue, compared to less than half of Hispanic independents (49%) and Hispanic Republicans (49%). Hispanic Catholics (59%) and mainline Protestants (57%) are significantly more likely to say immigration is a critical issue than are evangelical Protestants (48%) or religiously unaffiliated Hispanics (44%). Nearly three-quarters (74%) of Hispanics who are not U.S. citizens say that immigration is a critical issue facing the country, compared to 62% of Hispanics who are naturalized citizens and only 40% of native-born Hispanic citizens.
Immigration Reform
Two-thirds (67%) of Hispanics say that immigrants currently living in the United States illegally should be allowed to become citizens provided they meet certain requirements. Roughly 1-in-5 (17%) say they should be allowed to become permanent legal residents but not citizens, while 1-in-10 (10%) say that they should be identified and deported. Support among Hispanics is only marginally higher than it is among all Americans, among whom 63% support a path to citizenship for immigrants living in the United States illegally.(15)
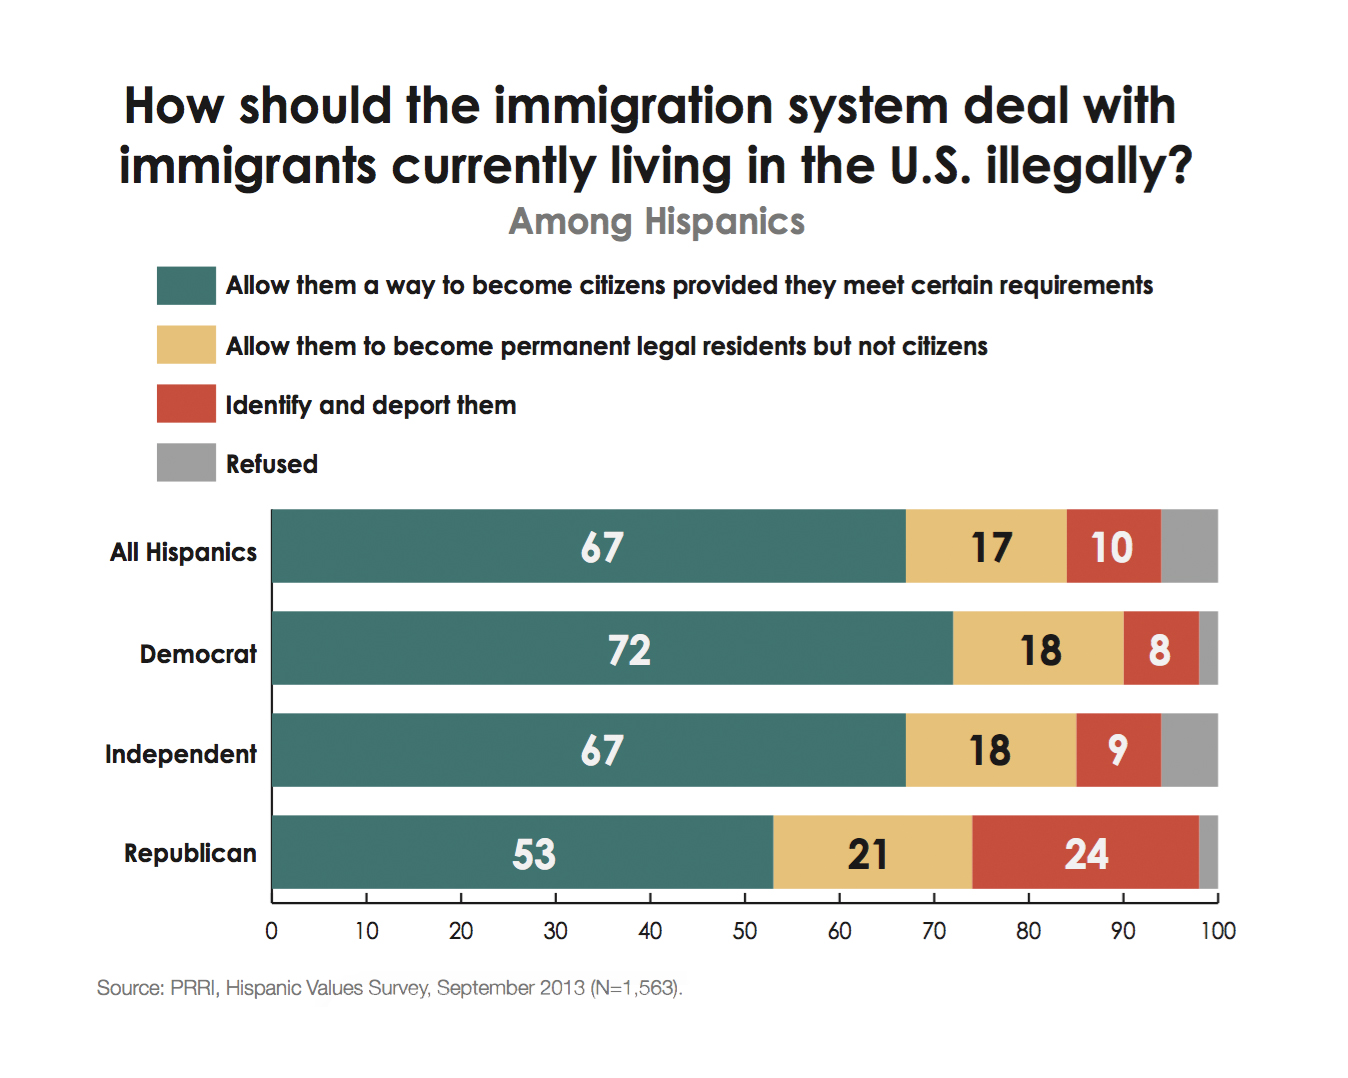 Majorities of virtually all demographic subgroups of Hispanics support a path to citizenship, although there are notable differences in intensity. For example, Hispanic Democrats (72%) and independents (67%) are significantly more likely than Hispanic Republicans (53%) to support a path to citizenship. Strong majorities of every major Hispanic religious group also support a path to citizenship for immigrants who are currently living the country illegally, including more than 7-in-10 Catholics (72%) and evangelical Protestants (75%), nearly two-thirds (65%) of mainline Protestants, and nearly 6-in-10 (59%) religiously unaffiliated Hispanics.
There is even stronger support among Hispanics for allowing immigrants brought to the United States illegally as children to gain legal resident status if they join the military or go to college. Eight-in-ten (80%) Hispanics favor this policy, including more than 7-in-10 Hispanic Republicans (72%), independents (81%), and Democrats (89%).
The American Dream: Fairness, Hard Work, and Opportunity
Strong majorities of Hispanics believe that the U.S. economic system unfairly favors the wealthy and that hard work is no guarantee of success for most people today. At the same time, a majority of Hispanics believe that children from all backgrounds have adequate opportunities to be successful in America today. Views on these issues vary considerably by immigrant generation.
More than 7-in-10 (72%) Hispanics agree that the economic system in this country unfairly favors the wealthy. There is broad agreement across Hispanic subgroups, but there are significant partisan differences. More than 8-in-10 (81%) Hispanic Democrats and nearly three-quarters (74%) of Hispanic independents agree that the economic system unfairly favors the wealthy. A majority (53%) of Hispanic Republicans disagree, compared to 44% who agree.
Consistent with these views, 6-in-10 (60%) Hispanics believe hard work and determination do not guarantee success for most people. On this question, there is also broad agreement across Hispanic subgroups, although there are significant differences by party affiliation and immigrant generation. More than 6-in-10 Hispanic Democrats (65%) and independents (62%) agree that hard work and determination are no guarantee of success for most people. Hispanic Republicans are nearly evenly divided (48% agree, 50% disagree). First-generation immigrant Hispanics (65%) are more likely than third-or-higher generation Hispanics (55%) to agree that hard work and determination are no guarantee of success for most people. (16) 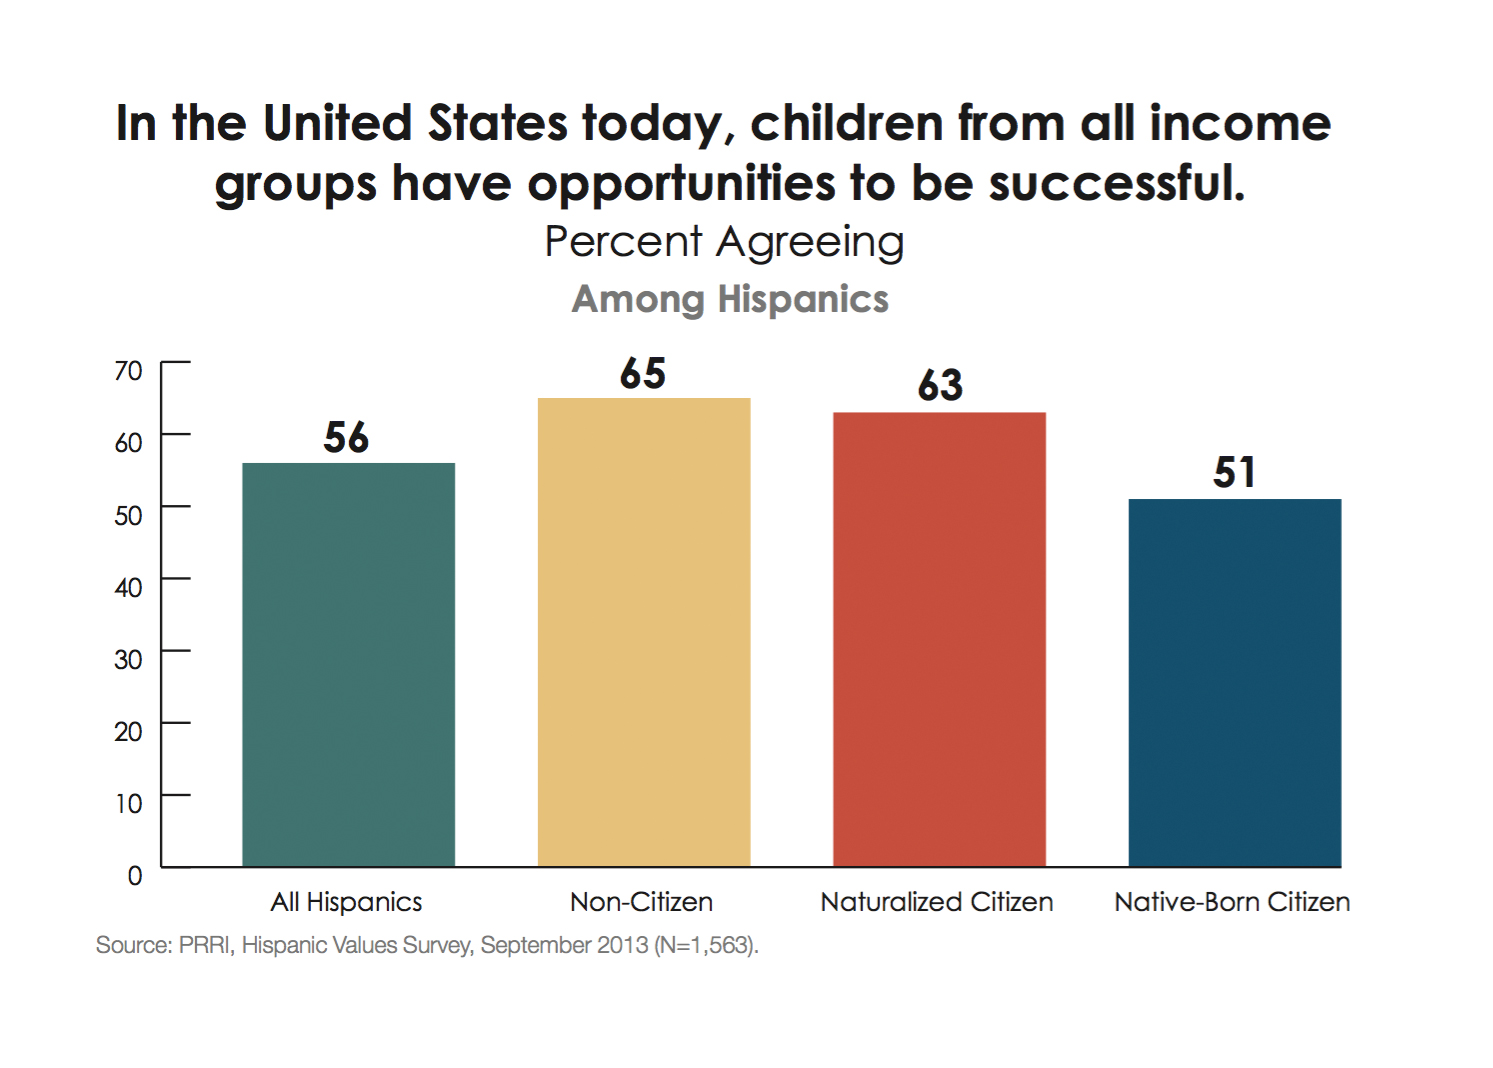 Although Hispanics broadly agree that the economic system is not fair and believe that hard work does not guarantee success, a majority (56%) of Hispanics nonetheless believe that in the United States children from all income groups have adequate opportunities to be successful. There are considerable differences in views of Hispanics by age and citizenship status. Hispanic seniors (64%) are significantly more likely than younger (age 18-29) Hispanics (52%) to believe that children from all income groups have adequate opportunities for success in the United States today. Nearly two-thirds of Hispanics who are non-citizens (65%) and Hispanics who are naturalized citizens (63%) believe that in the United States children from all income groups have adequate opportunities to be successful. However, Hispanics who were born in the United States are more pessimistic. A slim majority (51%) of native-born Hispanics believe that American children have sufficient opportunities to be successful regardless of their economic background, while nearly as many (47%) disagree.
Economic Issues: Growth Strategies, Taxes, Minimum Wage, and Health Care
Strategies for Promoting Economic Growth: Public Investment vs. Cutting Taxes
By a nearly 2-to-1 margin, Hispanics favor a public investment approach to spurring economic growth over a tax-cutting approach. Roughly 6-in-10 (58%) Hispanics believe that spending more on education and the nation’s infrastructure and paying for it with higher taxes among wealthy individuals and businesses is the best way to promote economic growth. One-third (33%) of Hispanics disagree, saying the best way to boost economic growth is to lower taxes on individuals and businesses and pay for those tax cuts by cutting spending on government services and programs. Majorities of most demographic and religious groups favor a public investment approach, although there are significant generational and political differences.
Nearly two-thirds of first-generation immigrant Hispanics (65%) think that the best way to promote economic growth is to increase spending on education and infrastructure. A plurality of third-or-higher generation Hispanics also favor a public investment approach to economic growth, but they are more divided. Half (50%) of third-generation Hispanics believe that increased spending on infrastructure projects is the best method to growing the economy, while nearly as many (42%) say that cutting spending and providing lower taxes on individuals and businesses is the best approach.
There are substantial political differences in views about how to maximize economic growth. Nearly three-quarters (73%) of Hispanic Democrats say increasing spending on education and infrastructure while raising taxes on the wealthy is the best approach to promoting economic growth. Nearly half (49%) of Hispanic independents say that more spending on education and infrastructure is the best way to encourage economic growth, while 4-in-10 (40%) say that lowering taxes and cutting government spending is the best approach. In contrast, nearly 6-in-10 (59%) Hispanic Republicans believe lowering taxes on individuals and businesses and cutting government spending is the best approach.
Raising Taxes on the Wealthy, Minimum Wage
Increasing taxes on wealthy Americans and increasing the minimum wage are exceedingly popular policies among Hispanics. Roughly 8-in-10 Hispanics favor increasing the tax rate on Americans earning more than $250,000 a year (77%) and increasing the minimum wage from $7.25 an hour to $10.00 an hour (83%). There are few differences among Hispanics, although Hispanic Republicans are somewhat less likely than Hispanic Democrats to support raising the minimum wage (67% vs. 93%).
Health Care
Hispanics overall are divided on the 2010 health care law known as Obamacare. Nearly half (48%) of Hispanics support repealing and eliminating the law, while about as many (47%) oppose it. On this issue there are stark political differences. More than 7-in-10 (72%) Hispanic Republicans favor repealing and eliminating the 2010 health care law. A majority (54%) of Hispanic Democrats oppose repealing the law, while more than 4-in-10 (44%) are in favor. Hispanic independents are roughly split, with 51% in favor of repealing and eliminating the law and 47% in opposition.
Although Hispanics are divided on Obamacare, there is strong support for the principle of government guaranteeing access to health care. Nearly 6-in-10 (58%) Hispanics agree that the government should guarantee health care for all citizens, even if it means raising taxes; roughly 4-in-10 (39%) disagree. The primary divisions in opinion occur along partisan lines, although there are modest religious differences as well.
More than 7-in-10 (71%) Hispanic Democrats agree that the government should guarantee health care for all citizens, while two-thirds (67%) of Republicans disagree. Hispanic independents are divided; half (50%) think it is the government’s responsibility to guarantee health care, while 49% disagree. More than 7-in-10 (72%) religiously unaffiliated Hispanics, about 6-in-10 Hispanic Catholics (61%), and a majority (53%) of mainline Protestants agree that guaranteeing health care for all citizens is the government’s responsibility. Evangelical Protestants are evenly divided about whether it is the government’s responsibility to guarantee health care for all citizens (50% agree and 50% disagree).
Beyond Culture War Stereotypes: Abortion, Contraception, Same-sex Marriage, and the Death Penalty
The Decoupling of Abortion and Same-sex Marriage
Hispanics do not fit neatly into liberal or conservative categories on cultural issues such as same-sex marriage, abortion, and the death penalty. On cultural issues, there are large cleavages in opinion by political affiliation, religion, age, and education, but not all of these differences are consistent across issues. 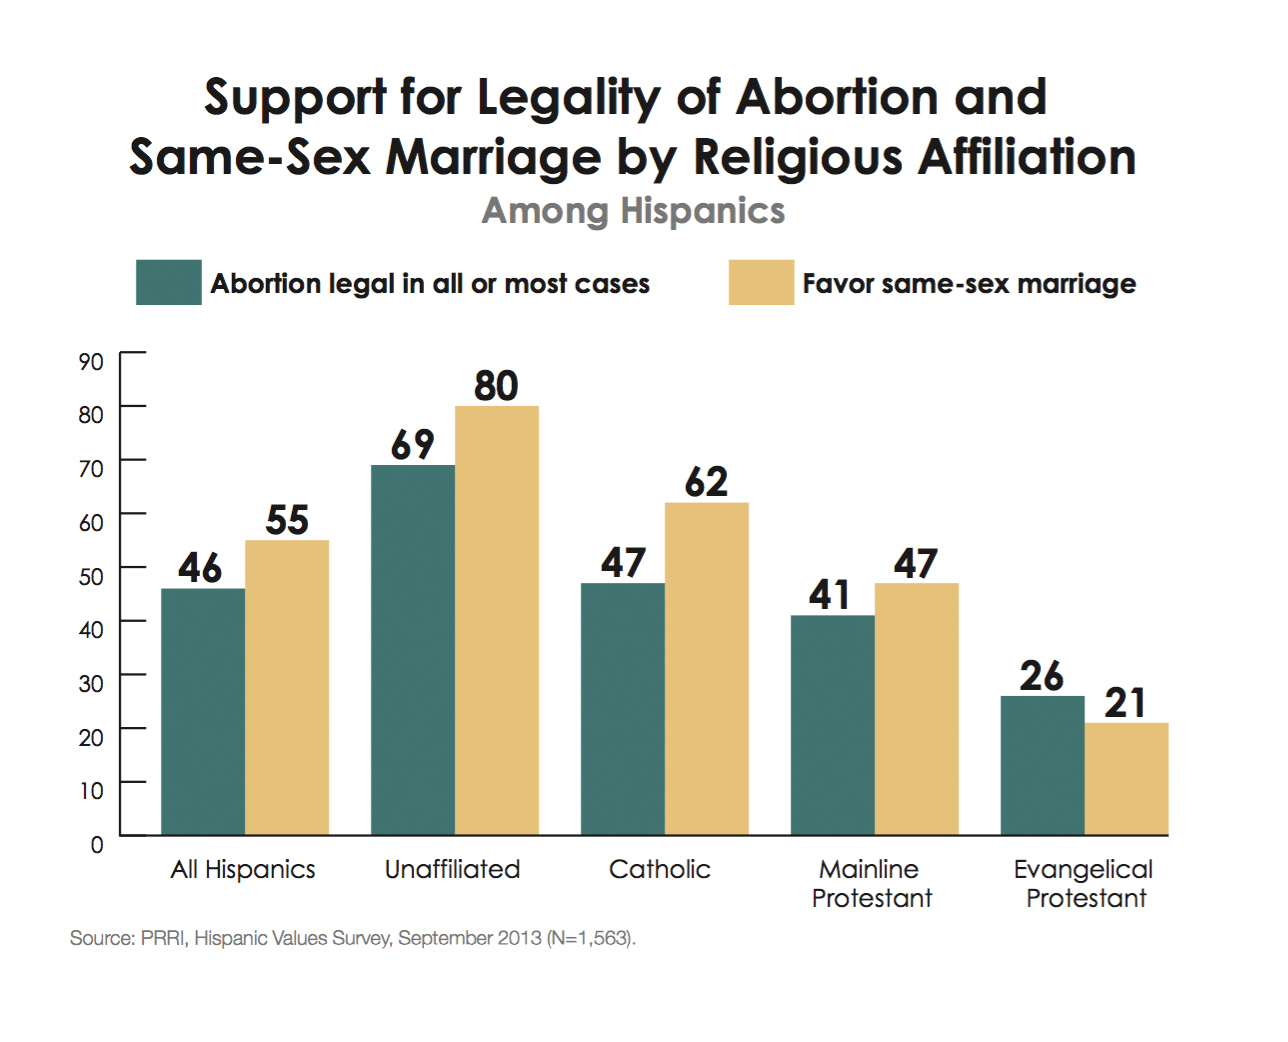 Hispanic views on same-sex marriage confound common stereotypes of Hispanics as culturally conservative. A majority (55%) of Hispanics, for example, favor allowing gay and lesbian Americans to marry, compared to 43% who are opposed. However, on the issue of abortion, the balance of opinion is reversed. A majority (52%) of Hispanics say abortion should be illegal in all or most cases, compared to 46% who say abortion should be legal in all or most cases.
Attitudes on Abortion among Hispanic Subgroups
Hispanics are sharply divided by religion on the issue of abortion. Less than half (47%) of Hispanic Catholics say abortion should be legal in all or most cases; a majority (52%) say abortion should be illegal in all or most cases. Mainline Protestants have a similar profile to Catholics on this issue (41% legal all/most cases vs. 54% illegal all/most cases). Evangelical Protestants have the most conservative footprint on the issue, with nearly three-quarters (74%) saying abortion should be illegal in all or most cases, including nearly half (48%) who say it should be illegal in all cases. By contrast, nearly 7-in-10 (69%) religiously unaffiliated Hispanics say abortion should be legal in all or most cases.
There are significant differences in attitudes about abortion by generation of immigration. Nearly 6-in-10 (58%) first-generation immigrant Hispanics say abortion should be illegal in all or most cases, while a majority (54%) of third-or-higher generation Hispanics say abortion should be legal in all or most cases.
There are no significant generational differences between younger Hispanics and older Hispanics on the issue of abortion.
Although few Hispanics believe that abortion is a critical issue facing the country, the roughly one-third who do are more likely to say abortion should be illegal than legal. Among Hispanics who say abortion is a critical issue in the country, nearly three-quarters (74%) say abortion should be illegal in all or most cases.
Abortion: Morality and Influence of Church Teachings
Questions about the legality of abortion only capture part of the complexity of Hispanic public opinion on this issue. Hispanics have a nuanced, situational view of the morality of having an abortion. On the one hand, Hispanics are three times more likely to say that abortion is morally wrong than to believe it is morally acceptable (32% vs. 9%). On the other hand, nearly half (48%) say their moral evaluation of abortion depends on the situation, and nearly 1-in-10 (9%) say that having an abortion is not a moral issue.
The beliefs of Hispanic Catholics mirror the beliefs of Hispanics overall. A majority (55%) of Hispanic Catholics believe the morality of having an abortion depends on the situation at hand, and 7% say it is not a moral issue. Three-in-ten (30%) say that having an abortion is morally wrong, compared to 7% who say it is morally acceptable. Close to half (45%) of mainline Protestants also say the morality of having an abortion depends on the circumstances, while another 5% say it is not a moral issue. At the same time, Hispanic mainline Protestants are four times more likely to say it is morally wrong (38%) than to say it is morally acceptable (8%). Among evangelical Protestants, nearly 6-in-10 (59%) say that having an abortion is morally wrong, compared to only 4% who say it is morally acceptable. More than one-third of evangelical Protestants say that the morality depends on the situation (26%) or that it is not a moral issue (10%). Religiously unaffiliated Hispanics are the only religious group more likely to believe that abortion is morally acceptable than morally wrong (20% vs. 8%), but half (50%) say it depends on the circumstances, and 21% say it is not a moral issue.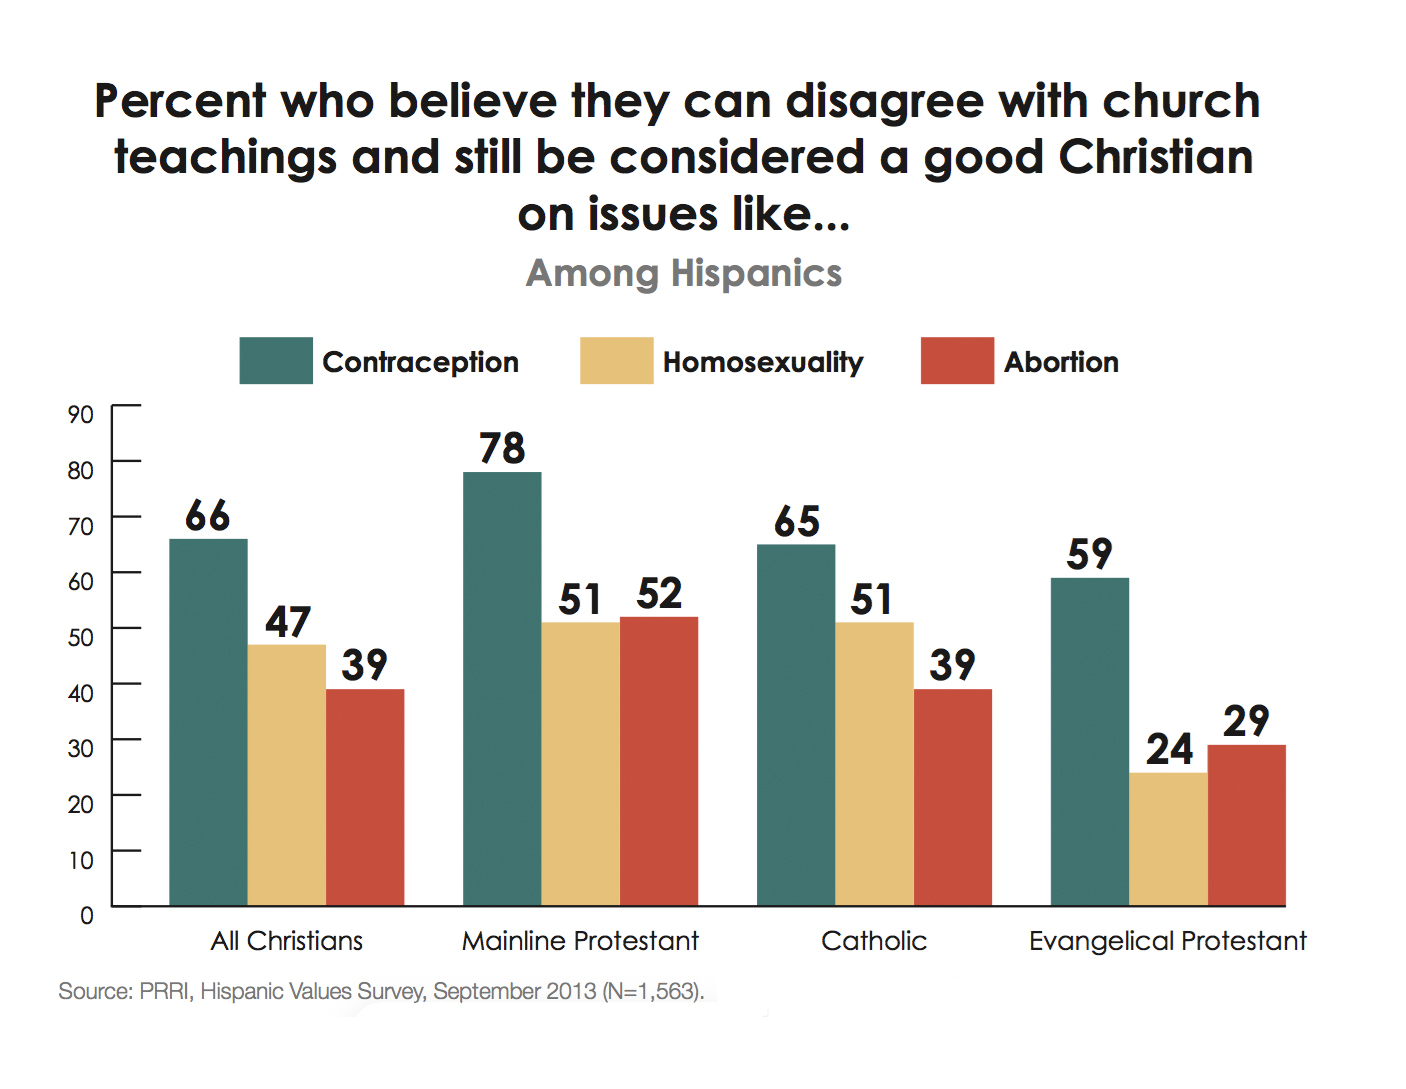 A majority (55%) of Hispanic Christians overall say it is not possible to disagree with the church’s teachings on abortion and still be considered a good Christian, compared to nearly 4-in-10 (39%) who say it is possible. There are significant variations among Christian subgroups. Catholic beliefs on this issue are identical to Hispanics beliefs overall (55% say it is not possible, while 39% say it is possible). Nearly two-thirds (65%) of evangelical Protestants say that it is not possible to disagree with the church’s teachings on abortion and still be considered a good Christian, compared to 29% who say it is possible. By contrast, a majority (52%) of mainline Protestants say it is possible to disagree with your church’s teachings on abortion and remain a good Christian, compared to 39% who say it is not possible.
Contraception: Morality and Influence of Church Teachings
Overall, Hispanics are about seven times more likely to say that using artificial birth control is morally acceptable (48%) than they are to say that it is morally wrong (7%). About 1-in-5 (17%) say the morality of birth control use depends on the situation, and one-quarter (25%) say the use of birth control is not a moral issue at all.
There is broad agreement about the morality of the use of artificial birth control across religious groups. For example, nearly half (49%) of Hispanic Catholics say that using artificial birth control is morally acceptable, while only 7% say it is morally wrong. One-in-five (20%) Hispanic Catholics say the morality of birth control use depends on the situation, and nearly one-quarter (23%) say it is not a moral issue. Views of evangelical Protestants and mainline Protestants are similar. Religiously unaffiliated Hispanics differ from other Hispanics only in that they are more likely to say the use of contraceptives is not a moral issue (36%).
Nearly two-thirds (66%) of Hispanic Christians say that it is possible to disagree with church teachings on the issue of contraception and remain a good Christian. Views across religious subgroups are fairly consistent. For example, nearly two-thirds (65%) of Hispanic Catholics say that it is possible to disagree with church teachings on birth control and remain a good Catholic.
Attitudes on Same-sex Marriage among Hispanic Subgroups
Hispanics are sharply divided by religion on the issue of same-sex marriage. More than 6-in-10 (62%) Hispanic Catholics and 8-in-10 (80%) religiously unaffiliated Hispanics favor allowing gay and lesbian couples to marry. Hispanic mainline Protestants are divided, with 47% supporting same-sex marriage and 50% opposing it. In stark contrast, 8-in-10 (79%) evangelical Protestants oppose same-sex marriage, while just 1-in-5 (21%) support it.
There are also notable differences by generational status. First-generation Hispanics are closely divided on the issue of same-sex marriage; 51% favor allowing gay and lesbian couples to marry, and 48% are opposed. Hispanics who are at least third-generation are much more likely to favor same-sex marriage than oppose it (57% vs. 42%).
Mirroring the general public, younger Hispanics (age 18 to 29) are significantly more likely than Hispanic seniors (age 65 and older) to favor allowing gay and lesbian couples to marry (63% vs. 43%).
As with abortion, Hispanics who rank same-sex marriage as a critical issue facing the country are more likely than other Hispanics to oppose it. Among Hispanics who believe same-sex marriage is a critical issue, 61% oppose allowing gay and lesbian couples to marry.
Same Gender Sexual Activity: Morality and Influence of Church Teachings
Hispanics appear willing to support allowing gay and lesbian couples to marry legally, even if they personally hold reservations about the morality of sex between two adults of the same gender. Even though a majority of Hispanics support same-sex marriage, Hispanics are twice as likely to believe that sex between two adults of the same gender is morally wrong as they are to believe it is morally acceptable (45% vs. 18%). Roughly one-third of Hispanics say either that it depends on the situation (8%) or that it is not a moral issue (26%).
The views of Hispanic Catholics and mainline Protestants are similar to the views of Hispanics overall. Approximately half of Hispanic Catholics (45%) and mainline Protestants (51%) say that sex between two adults of the same gender is morally wrong, compared to fewer than 1-in-5 Catholics (16%) and mainline Protestants (19%) who say it is morally acceptable. Few Catholics (10%) or mainline Protestants (4%) believe the morality of same gender sexual activity depends on the situation, but about one-quarter of Catholics (27%) and mainline Protestants (23%) say it is not a moral issue. Evangelical Protestants and religiously unaffiliated Hispanics have starkly different beliefs about the morality of sex between adults of the same gender. More than 7-in-10 (72%) evangelical Protestants say that sex between two adults of the same gender is morally wrong, while fewer than 1-in-10 (8%) say it is morally acceptable. One-in-five evangelical Protestants say either that the morality of the behavior depends on the situation (6%) or that it is not a moral issue (14%). One-third (33%) of religiously unaffiliated Hispanics believe that same gender sexual activity is morally acceptable, compared to 1-in-5 (20%) who believe it is morally wrong. Nearly half of religiously unaffiliated Hispanics say either that it depends on the situation (7%) or that sex between adults of the same gender is not a moral issue (40%).
Hispanic Christians are evenly divided on whether it is possible to disagree with church teachings on homosexuality and remain a good Christian; 47% say it is possible, and 47% say it is not. Slim majorities of Hispanic Catholics (51%) and mainline Protestants (51%) say that it is possible to disagree with church teachings on homosexuality and remain a good Catholic or Christian, while roughly 4-in-10 say it is not (44% Catholic, 41% mainline Protestant). Evangelical Protestants, however, hold significantly different beliefs on this issue. Fully 7-in- 10 (70%) evangelical Protestants say it is not possible to disagree with church teachings on the issue of homosexuality and remain a good Christian, compared to about one-quarter (24%) who say it is possible.
Fairness in the Criminal Justice System and the Death Penalty
Nearly 6-in-10 (58%) Hispanics disagree that blacks and other minorities receive equal treatment as whites in the criminal justice system, compared to 39% who agree. There are notable political divides in the views of Hispanics on this issue. About 6-in-10 (57%) Hispanic Republicans agree that blacks and other minorities receive treatment equal to whites in the criminal justice system, while approximately two-thirds (66%) of Hispanic Democrats disagree. Hispanic independents are divided (53% disagree, 45% agree).
A majority (54%) of Hispanics believe that people convicted of murder should face life in prison without the possibility of parole, compared to 37% who prefer the death penalty. There is broad consensus across Hispanic subgroups on this issue, although there are a few notable exceptions.
Compared to abortion and same-sex marriage, the issue of the death penalty produces different patterns of support among religious groups. Approximately 6-in-10 Hispanic Catholics (60%) and evangelical Protestants (57%) prefer life in prison without the chance of parole to the death penalty. Mainline Protestants are divided (45% prefer the death penalty; 47% prefer life in prison without parole). In contrast, a majority (52%) of religiously unaffiliated Hispanics believe the death penalty is the preferable punishment for people convicted of murder, compared to 38% who prefer life in prison. Across affiliation lines, church attendance rates are positively correlated with preferences for life in prison over the death penalty. Among those who attend religious services weekly or more, 60% prefer life in prison without parole for those convicted of murder, compared to 51% of those who report seldom or never attending religious services.
There are modest differences by gender and age. Hispanic women are more likely than Hispanic men to believe that life in prison is the more appropriate punishment for people convicted of murder (59% vs. 50%). Younger Hispanics are also more likely than Hispanic seniors to prefer life imprisonment to the death penalty (53% vs. 43%).
IV. The Role of Government: Providing Services and Addressing Inequality
Most Hispanics support an active role of government in society, particularly when it comes to addressing systemic problems like economic inequality. However, there are notable concerns among Hispanics about people taking advantage of government benefits.
Government Services and the Social Safety Net
Hispanics are divided what level of services the government should provide. Roughly one-third (31%) say government should provide more services, even if it results in higher taxes, while nearly (27%) as many say the government should provide fewer services and lower taxes. Four-in-ten (40%) Hispanics do not support either approach or support both equally. There are few differences among Hispanic subgroups.
Most Hispanics support the idea of government providing a safety net for people who are unable to take care of themselves, although there are significant differences by age, education, and generation of immigration. Nearly 6-in-10 (57%) Hispanics agree that it is the responsibility of the government to take care of people who cannot take care of themselves, compared to 40% who disagree. Younger Hispanics (age 18-29) are more divided: half (50%) support government taking care of people who cannot take care of themselves, while 45% do not. By contrast, nearly three-quarters (73%) of Hispanic seniors (age 65 and older) say the government should provide for those who cannot take care of themselves. Similar divisions are evident along educational lines. More than 6-in-10 (63%) Hispanics with less than a high school education agree that the government should take care of those who cannot take care of themselves, while Hispanics with a college degree are more divided (51% agree and 44% disagree).
Nearly two-thirds (65%) of Hispanics who are first-generation immigrants agree that it is the government’s responsibility to take care of those who cannot take care of themselves, while second- and third-or-higher generation Hispanics are more divided. Among second-generation Hispanics, 47% agree and 50% disagree; among third-generation Hispanics, 51% agree and 48% disagree.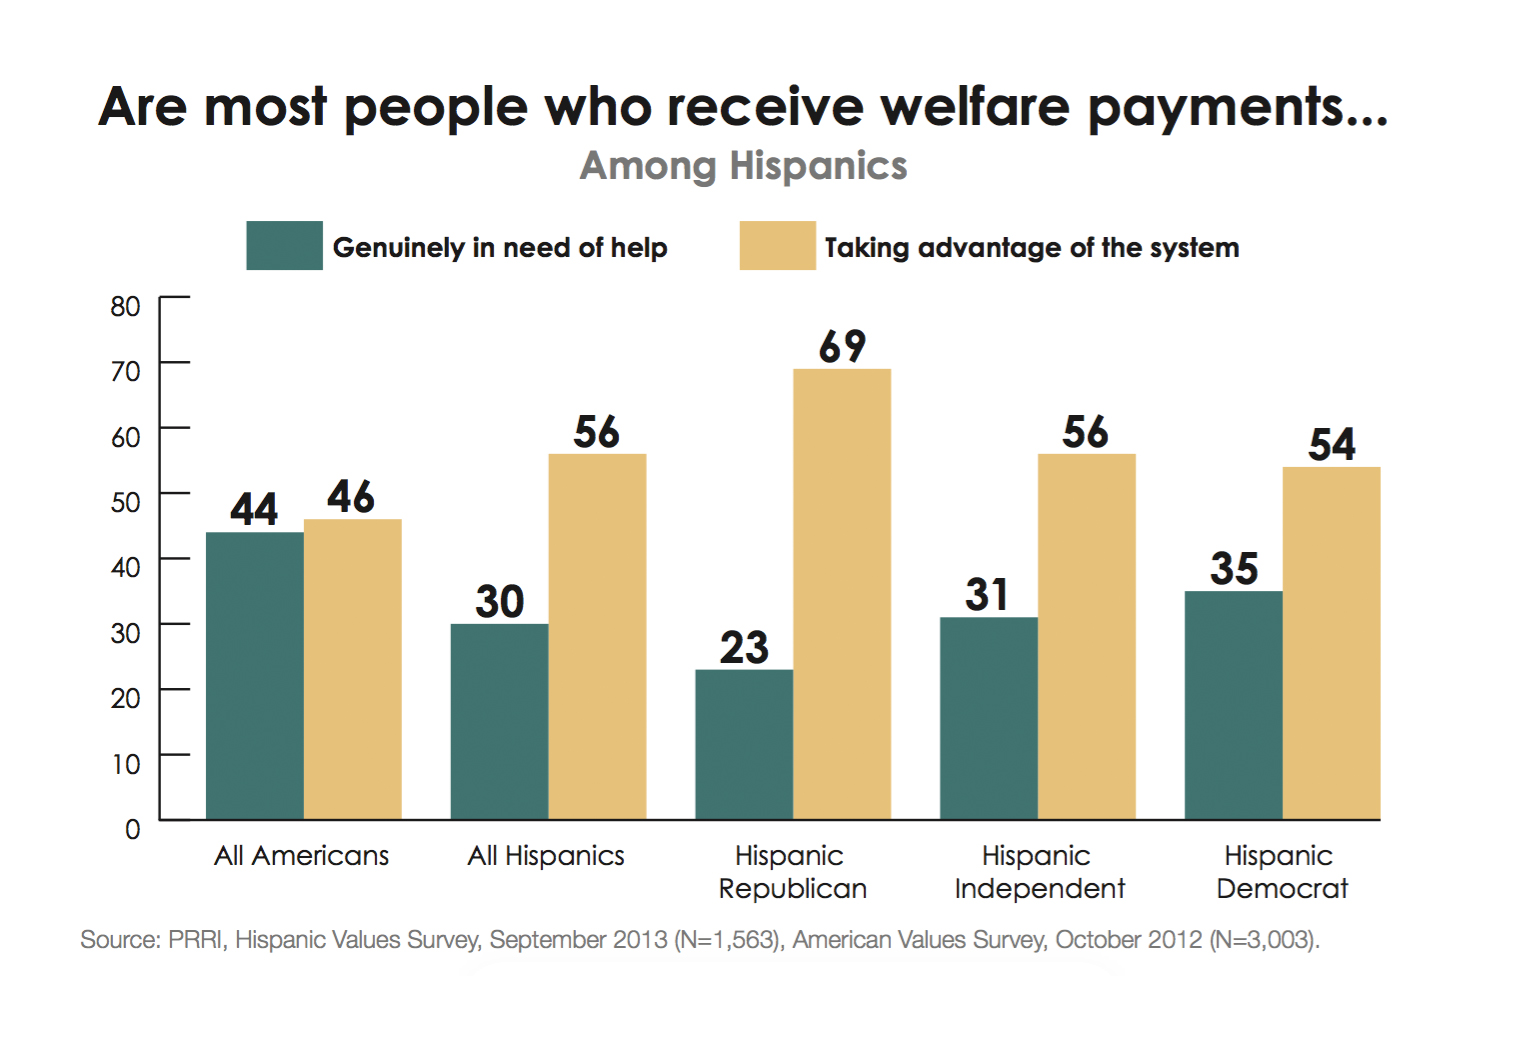 While most Hispanics believe government should support those unable to help themselves, Hispanics have concerns about whether those receiving services are taking advantage of the system. A majority (56%) of Hispanics believe that most people who receive welfare are taking advantage of the system, while 30% think most welfare recipients are genuinely in need of help. In fact, Hispanics are more likely to believe people are taking advantage of the system than Americans overall; among the American general population, 46% believe most welfare recipients are taking advantage of the system, compared to 44% who believe they are genuinely in need of help.(17) Views among Hispanics are broadly shared across demographic subgroups. For example, majorities of Hispanic Democrats (54%), independents (56%), and Republicans (69%) agree that most welfare recipients are taking advantage of the system.
Government’s Role in Addressing Inequality
Hispanics strongly support greater government involvement in addressing economic inequality. More than 7-in-10 (72%) Hispanics agree the government should do more to reduce the gap between the rich and the poor, compared to 25% who disagree. While majorities of Hispanics across demographic, religious, social, and political groups favor an increased governmental role in addressing economic inequality, there are differences in the degree of intensity. For example, more than 8-in-10 (83%) Hispanic Democrats and roughly 7-in-10 (71%) Hispanic independents agree that the government should do more to reduce the gap between rich and poor. A majority (53%) of Republicans also agree, while nearly half (46%) disagree.
V. Looking Back: The 2012 Election
Although Hispanic voters accounted for less than 1-in-10 (8%) voters in 2012, they significantly affected the outcome due to their heavy support of Democratic candidates. The Hispanic Values Survey finds that roughly 7-in-10 (68%) Hispanic voters report having voted for Barack Obama, while about 3-in-10 (29%) report having voted for Mitt Romney.(18) Obama’s advantage among Hispanic voters was fairly strong across most demographic subgroups. For example, while it is no surprise that Obama had the support of 95% of liberal voters, Obama also had the support of 77% of moderate voters and even the support of nearly 4-in-10 (39%) Hispanic voters who identify as conservative. Hispanic partisans were fairly loyal to their party’s candidates, but Obama kept an advantage here also. While 88% of Hispanic Republic voters reported supporting Romney, 96% of Hispanic Democratic voters reported supporting Obama. Obama also held a 10-point advantage over Romney among Hispanic independent voters, who reported supporting Obama over Romney 52% to 42%.
Obama enjoyed strong support among most Hispanic religious subgroups, with the exception of evangelical Protestants. More than 7-in-10 (71%) Hispanic Catholic voters report casting ballots for Obama, while roughly 1-in-4 (26%) say they supported Romney. Mainline Protestant voters also report supporting Obama over Romney by a factor of 3-to-1 (75% vs. 25%). Obama held the largest advantage over Romney among religiously unaffiliated Hispanic voters (82% vs. 13%). By contrast, among Hispanic evangelical voters, a slim majority (51%) say they supported Romney, while 44% say they voted for Obama.
Obama voters and Romney voters point to somewhat different motivations for supporting their preferred candidate. Among Hispanics who report voting for Obama, more than 8-in- 10 (82%) say their vote was primarily a vote supporting Obama, compared to 17% who say their vote was primarily a vote against Romney. A majority (55%) of Hispanics who reported voting for Romney also say their vote was primarily in support of Romney, but more than 4-in-10 (42%) say their vote was primarily in opposition to Obama.
VI. The Current Political Context: Views of the Political Parties
Top-of-Mind Associations with the Republican Party and Democratic Party
When asked to provide top-of-mind associations of the Republican Party and Democratic Party, Hispanics offered significantly more negative comments about the Republican Party than the Democratic Party.
Nearly half of the open-ended associations Hispanics gave about the Republican Party were negative; these included being rich or beholden to corporations (15%); being racist, intolerant, or anti-immigrant (10%); being old-fashioned and out-of-touch (5%); being obstructionist and uncompromising (3%); and a range of other negative comments that defied easy categorization (15%). About 4-in-10 (42%) offered associations that were basically descriptive or neutral, including being conservative or holding traditional values (15%) or other neutral terms (11%), or they offered no opinion (16%). About 1-in-10 (11%) Hispanics offered positive associations with the Republican Party; these included being patriotic or supporting a strong military (3%); supporting small government and fiscal responsibility (2%); and other positive comments that could not be easily categorized (6%).
Hispanics hold more positive associations about the Democratic Party. More than one-third (35%) of the open-ended associations Hispanics gave about the Democratic Party were positive, including being populist and for the people (13%), supporting fairness and equality (6%), being inclusive and compassionate (5%), and other positive associations that were difficult to categorize (11%). More than 4-in-10 (42%) Hispanics offered basically neutral or descriptive associations with the Democratic Party, including being liberal or progressive (11%), supporting democracy and liberty (5%), other miscellaneous neutral associations (15%), or they offered no opinion (11%). Approximately 1-in-5 (22%) Hispanics offered negative associations with the Democratic Party, including favoring big government or being socialist (6%), being weak or disappointing (4%), or other negative associations that defied easy classification (12%).
Favorability of the Republican and Democratic Parties
Shortly after George W. Bush won reelection in 2004 with 44% of the Hispanic vote, nearly half (47%) of Hispanics reported having a favorable view of the Republican Party. Roughly as many Hispanics (48%) said they had an unfavorable view of the GOP that year.(19) Since 2004, negative views of the GOP have increased dramatically. In 2008, nearly 4-in-10 (39%) Hispanics reported having a favorable view of the GOP. Today, only about 1-in-4 (24%) Hispanics say they view the Republican Party favorably, while nearly two-thirds (65%) have an unfavorable view of the GOP. Hispanics have somewhat less negative views of the Tea Party than the Republican Party, although a majority (53%) report that they have an unfavorable opinion of the group. Twenty percent have a favorable view of the Tea Party, while 23% say they are not familiar with the Tea Party.
Views of the Democratic Party have been fairly stable during the same time period. In 2004, about 6-in-10 (61%) said they viewed the Democratic Party favorably, identical to the percentage of Hispanics who view the party favorably today. However, there is some evidence that these views, while favorable, are somewhat tepid; only 20% of Hispanics have a very favorable view of the Democratic Party, while 3-in-10 (30%) Hispanics report having an unfavorable view of the Democratic Party.
Favorability measures of both parties are fairly stable across Hispanic subgroups, but there are some significant differences by religious affiliation. Nearly 7-in-10 (68%) Hispanic Catholics report having a favorable view of the Democratic Party, as do 60% of mainline Protestants and 57% of religiously unaffiliated Hispanics. Evangelical Protestants are much more divided (50% favorable, 44% unfavorable). By contrast, majorities of all Hispanic religious communities have unfavorable views of the GOP. Evangelical Protestants hold the most favorable views of the Republican Party, but only 35% report having a favorable view.
Less than 3-in-10 (29%) Hispanics report that they feel closer to the Republican Party than they did in the past, while about two-thirds (63%) Hispanics say the same about the Democratic Party. Hispanic partisans are about equally as likely to say they have moved closer to their respective parties. Eighty-six percent of Hispanic Republicans report feeling closer to the GOP, while 90% of Hispanic Democrats say they feel closer to the Democratic Party than they did in the recent past. Roughly 4-in-10 (41%) Hispanic independents say they now feel closer to the GOP than they did in the past, compared to 52% who say they now feel closer to the Democratic Party.
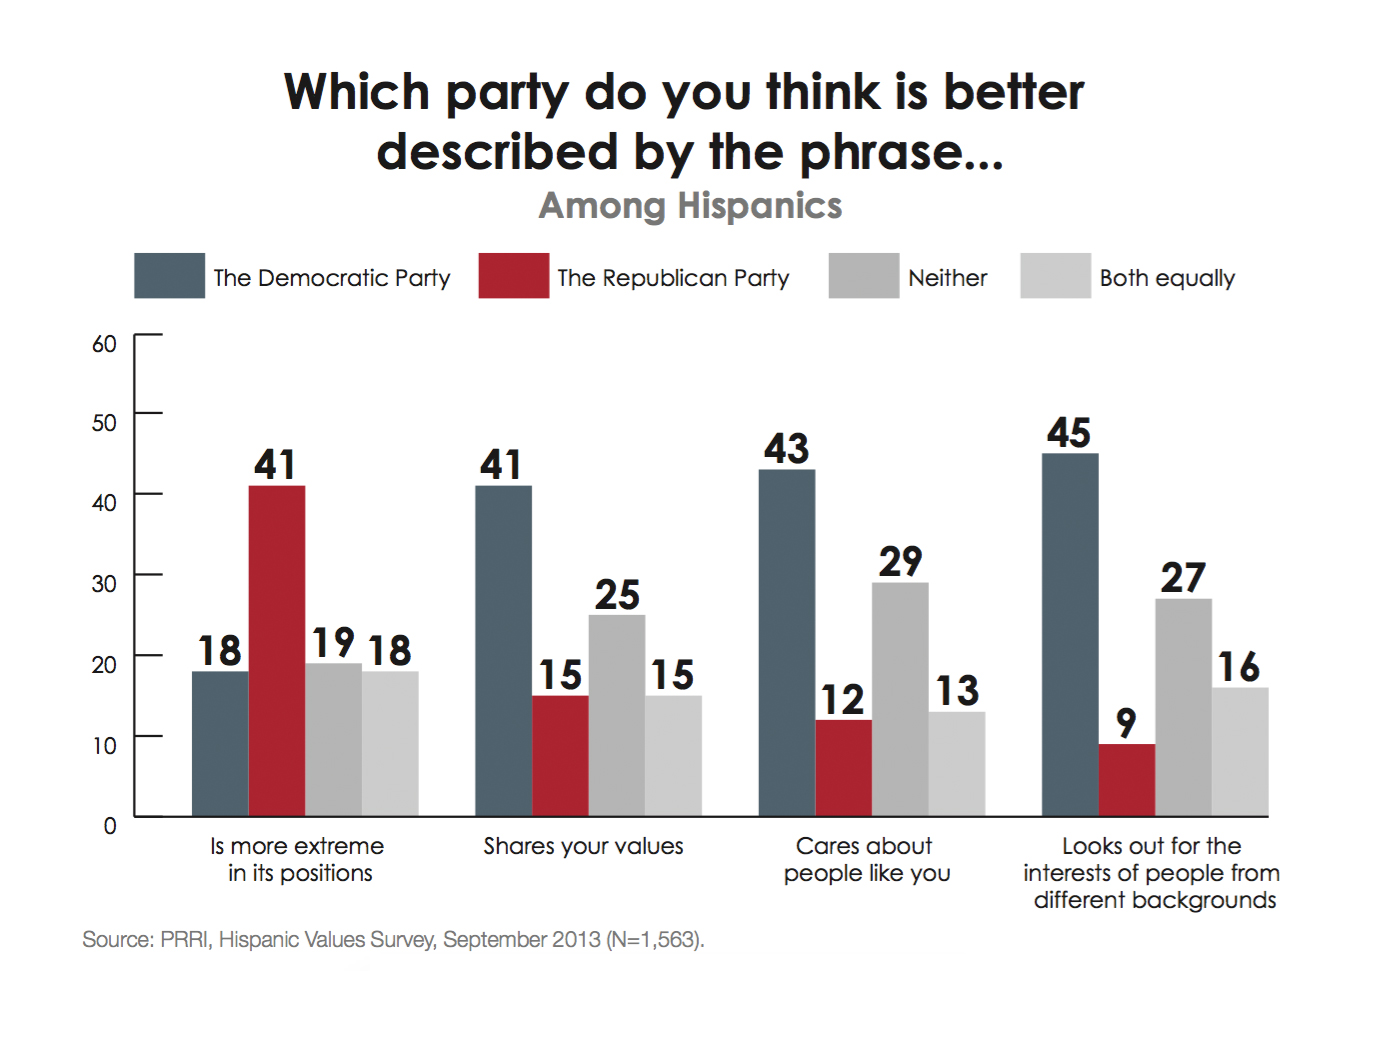 The Democratic Party retains a significant edge over the Republican Party across a range of positive qualities. Roughly 4-in-10 (41%) Hispanics report that the phrase “shares your values” better describes the Democratic Party, while 15% say it better describes the GOP. Fifteen percent say it describes both equally, and one-quarter (25%) say it does not describe either party. The Democratic Party has a similar advantage in being viewed as sympathetic; 43% say the phrase “cares about people like you” better describes the Democratic Party, while 12% say it better describes the Republican Party. Notably, about 3-in-10 (29%) say it describes neither party, and 13% say it describes both parties. Close to half (45%) of Hispanics say the phrase “looks out for the interests of people from different backgrounds” better describes the Democratic Party, while fewer than 1-in-10 (9%) say it better describes the Republican Party. However, nearly 3-in-10 (27%) Hispanics say the phrase describes neither party and another 16% say it describes both parties equally well. More than twice as many Hispanics believe the phrase “is more extreme in its positions” better describes the Republican Party than the Democratic Party (41% vs. 18%). Nearly 4-in-10 Hispanics believe that the phrase describes both parties equally well (18%) or neither party (19%).
The Democratic Party has a more modest advantage in how well it is trusted relative to the Republican Party to handle specific issues in the country, with the exception of immigration. One-third (33%) of Hispanics say the Democratic Party could do a better job of improving the job situation in the country, compared to 1-in-5 (20%) who say the Republican Party could do a better job in this area. More than 4-in-10 (44%) Hispanics do not perceive either party to have an advantage in improving the job situation. Close to 4-in-10 (37%) Hispanics say the Democratic Party could do a better job improving the education system, compared to 15% who say the Republican Party could do a better job on this issue. Again, more than 4-in-10 (44%) Hispanics do not believe either party would do a better job improving the education system. The Democratic Party is also viewed as better able to deal with the issue of abortion than the Republican Party (33% vs. 15%). However, nearly half (48%) of Hispanics report that they do not believe either party is better able to handle this issue. On the issue of immigration, the Democratic Party has a larger advantage over the GOP. More than 4-in-10 (42%) Hispanics say the Democratic Party is better able to deal with the issue of immigration, compared to 16% who believe the Republican Party is better on this issue. Roughly 4-in-10 (38%) Hispanics do not believe either party is better able to handle the issue of immigration.
Notably, while the Democratic Party is perceived as being much better able to handle the issue of abortion among Hispanics who believe abortion should be legal, the GOP does not enjoy a similar advantage among those who say it should be illegal. Among Hispanics who say abortion should be legal in all or most cases, close to half (45%) say the Democratic Party is better able to deal with the issue, compared to 9% who say the Republican Party would handle it better. Among Hispanics who say abortion should be illegal in all or most cases, nearly equal numbers say the Democratic Party (22%) would be better able to handle the issue as say the GOP (23%) would handle it better. A majority of Hispanics who say abortion should be illegal say both parties are equally able to deal with the issue (26%) or that neither one is better able to handle it (28%).
VII. Looking Ahead: The 2014 Election and Views of Political Leaders
The 2014 Election
At this very early stage in the 2014 election cycle, Hispanic likely voters report preferring Democratic congressional candidates to Republican congressional candidates by a 2-to-1 ratio (58% vs. 28%).(20) Approximately 1-in-10 (12%) Hispanic likely voters report that they would prefer to vote for a third-party candidate.
Among Hispanic voters, a majority (54%) say they would be less likely to support a candidate who opposes immigration reform that includes a path to citizenship for immigrants who are currently living in the country illegally. One-in-four (25%) say they would be more likely to vote for such a candidate, and 19% report that the candidate’s views on immigration would make no difference in deciding their vote. Nearly 4-in-10 (39%) Hispanic voters report that they would be less likely to support a candidate who is in favor of allowing gay and lesbian couples to marry, while 3-in-10 (30%) say they would be more inclined to support such a candidate. About 3-in-10 (29%) likely Hispanic voters say that a candidate’s position on same-sex marriage would not make a difference. Similar numbers of Hispanic likely voters (38%) report that they would be less likely to back a candidate who supports legalized abortion, compared to about one-third (32%) who say they would be more likely to back such a candidate. More than 1-in-4 (27%) say that a candidate’s position on the issue of abortion would not matter to them.
Political Leaders
Among Democratic leaders who are likely 2016 presidential candidates, former Secretary of State Hillary Clinton enjoys a significant favorability advantage over Vice President Joe Biden. Two-thirds (68%) of Hispanic likely voters report having a favorable view of Clinton, compared to 30% who say they have an unfavorable view of her. By contrast, fewer than half (49%) of likely Hispanic voters have a favorable view of Joe Biden, while nearly as many (44%) report having a negative view. More than 6-in-10 (62%) Hispanic likely voters have a favorable view of President Barack Obama, while 36% say they have an unfavorable view.
Republican Senators Marco Rubio and Ted Cruz—both of whom are Hispanic—are not viewed as favorably as any of the Democratic leaders, but they are also not nearly as well known. Three-in-ten (30%) Hispanic likely voters have a favorable view of Rubio, compared to nearly half (49%) who have an unfavorable view. One-in-five (20%) Hispanic likely voters are not familiar with the Republican senator from Florida. Senator Ted Cruz is even less well known. Roughly 1-in-5 (21%) Hispanic likely voters have a favorable view of Cruz, compared to 31% who have an unfavorable view of him. Close to half (45%) of Hispanic likely voters report that they do not know Cruz well enough to rate him either favorably or unfavorably.
Endnotes
1 U.S. Census Bureau, Population Division, Annual Estimates of the Resident Population by Sex, Single Year of Age, Race, and Hispanic Origin for the United States: April 1, 2010 to July 1, 2012.
2 U.S. Census Bureau, International Database.
3 According to the U.S. Census, the percentage of Hispanic voters has roughly doubled since the early 1990s; Hispanics accounted for 4.7% of voters in 1992 and 8.4% of voters in 2012.
4 U.S. Census Bureau, Current Population Survey, November 2012.
5 U.S. Census Bureau, Population Division, Annual Estimates of the Resident Population by Sex, Single Year of Age, Race, and Hispanic Origin for the United States: April 1, 2010 to July 1, 2012.
6 U.S. Census Bureau, Current Population Survey, 2012 Annual Social and Economic Supplement.
7 U.S. Census Bureau, 2012 American Community Survey.
8 Ibid.
9 Ibid.
10 U.S. Census Bureau, 2012 American Community Survey.
11 Among Americans overall, 36% identify as conservative, 36% as moderate and 23% as liberal. See Public Religion Research Institute/Brookings Institution, Economic Values Survey, July 2013 (N=2,002).
12 Pew Research Center, The Global Catholic Population, February 2013, http://www.pewforum.org/2013/02/13/ the-global-catholic-population/.
13 Because questions about the Catholic Church were only asked of half the sample, analysis of religiously unaffiliated attitudes in this section is based on slightly fewer than 100 respondents (N=99).
14 About 4-in-10 (42%) Americans reported that immigration was a critical issue in 2011. See Public Religion Research Institute, Millennials, Religion, & Gay and Lesbian Issues Survey, August 2011 (N=3,000).
15 Public Religion Research Institute, Religion, Values and Immigration Reform Survey, March 2013 (N=4,465).
16 Third-generation Hispanics include all those who are at least third-generation defined as Hispanics who were born in the U.S. and whose parents were both born in the U.S. as well.
17 Public Religion Research Institute, American Values Survey, October 2012 (N=3,003).
18 The reported vote figures found in the Hispanic Values Survey are nearly identical to the figures reported in the exit poll. According to the 2012 National Election Exit Poll, 71% of Hispanic voters supported Obama, compared to 27% who supported Romney.
19 Pew Research Center for the People and the Press, December 2004 (N=2,000).
20 Likely voters are defined as those who are currently registered to vote, reported voting in 2012, and who report that in general they always or nearly always vote. This definition produces a likely voting group that is 74% of Hispanic registered voters and 40% of the total Hispanic population.
21 The parameter for Internet access was obtained from the most recent special CPS supplemental survey (October 2010).
Recommended citation:
Jones, Robert P., Daniel Cox, and Juhem Navarro-Rivera. “How Shifting Religious Identities and Experiences Are Influencing Hispanic Approaches to Politics.” PRRI. 2013. http://www.prri.org/research/hispanic-values-survey-2013/.