Executive Summary
 Two issues top Ohio voters’ list of the most critical issues facing the state: jobs and unemployment, and the cost of health care.
Roughly two-thirds of Ohio voters report that unemployment (68%) and the cost of health care (66%) are critical issues facing Ohio.
- A majority (55%) of Ohio voters also report that the cost of education is a critical issue. Fewer voters cite the issue of immigration (30%) or same-sex marriage (24%) as critical issues. Nearly half (49%) of Ohio voters say that the issue of same-sex marriage is not that important compared to other issues.
Ohio voters strongly support laws that would protect gay and lesbian people against job discrimination.
Nearly 7-in-10 (68%) Ohio voters favor laws protecting gay and lesbian people against job discrimination, compared to one-quarter (25%) who oppose such a policy. Solid majorities of voters in both political parties and in every major religious group support workplace nondiscrimination laws for gay and lesbian people.
- Majorities of Ohio Republican voters (61%), independent voters (67%) and Democratic voters (75%) favor laws protecting gay and lesbian people against employment discrimination. Ohio Tea Party voters are the notable exception; Tea Party voters are divided (45% favor, 45% oppose).
- A majority of white evangelical voters (56%), approximately 7-in-10 white mainline Protestant voters (69%), Catholic voters (69%), and minority Protestant voters (72%), and nearly 8-in-10 (79%) religiously unaffiliated voters favor laws protecting gay and lesbian people against job discrimination.
The vast majority of Ohio voters incorrectly believe it is currently illegal under Ohio and federal law to discriminate on the basis of sexual orientation or gender identity in a range of areas.
At least 8-in-10 Ohio voters think, incorrectly, that it is currently illegal under Ohio law (84%) and under federal law (80%) to fire or refuse to hire someone because they are gay, lesbian, bisexual, or transgender. Similar numbers think that it is currently illegal in Ohio to refuse to rent an apartment or house to someone (81%) or to refuse to provide someone with a business service (78%) because they are gay, lesbian, bisexual, or transgender.
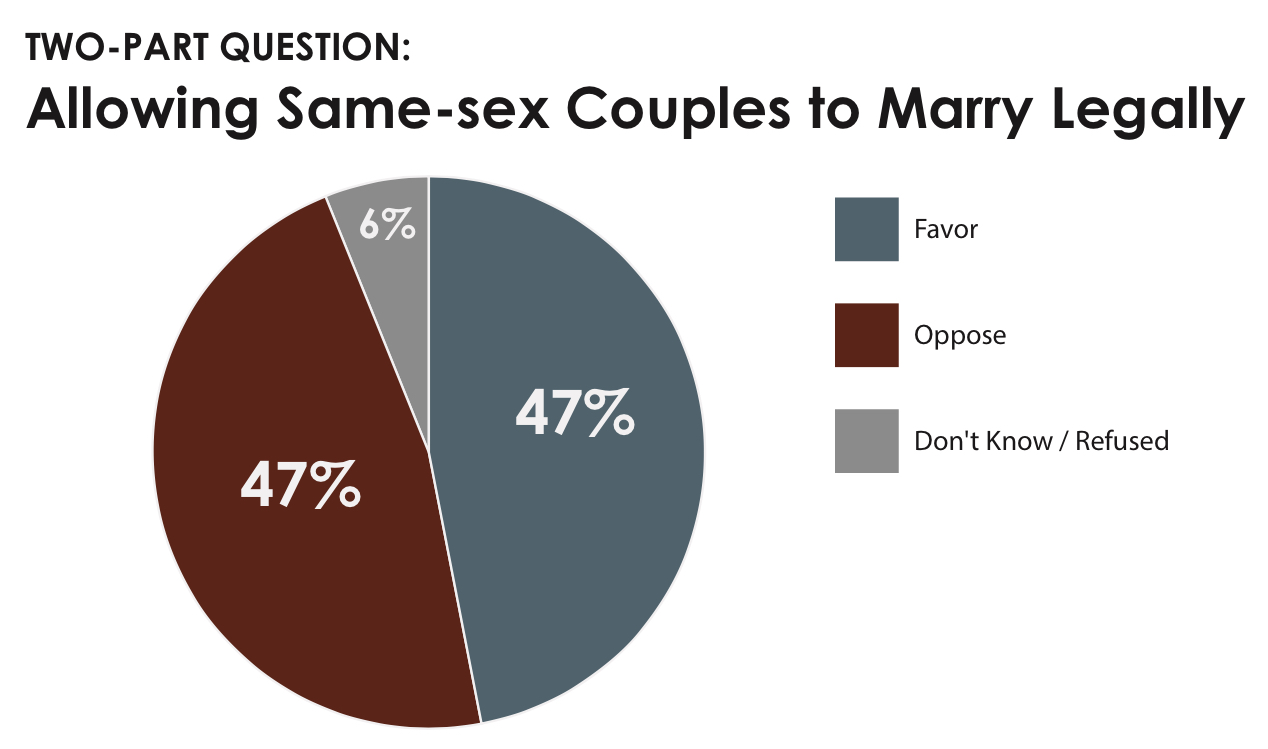
Ohio voters are evenly divided in their views on same-sex marriage. Forty-seven percent of voters favor allowing gay and lesbian couples to marry legally, compared to an equal number (47%) who are opposed. Support is essentially unchanged since the 2012 presidential election, when PRRI post-election polling found Ohio voters evenly divided on the legality of same-sex marriage (45% favored, 46% opposed).
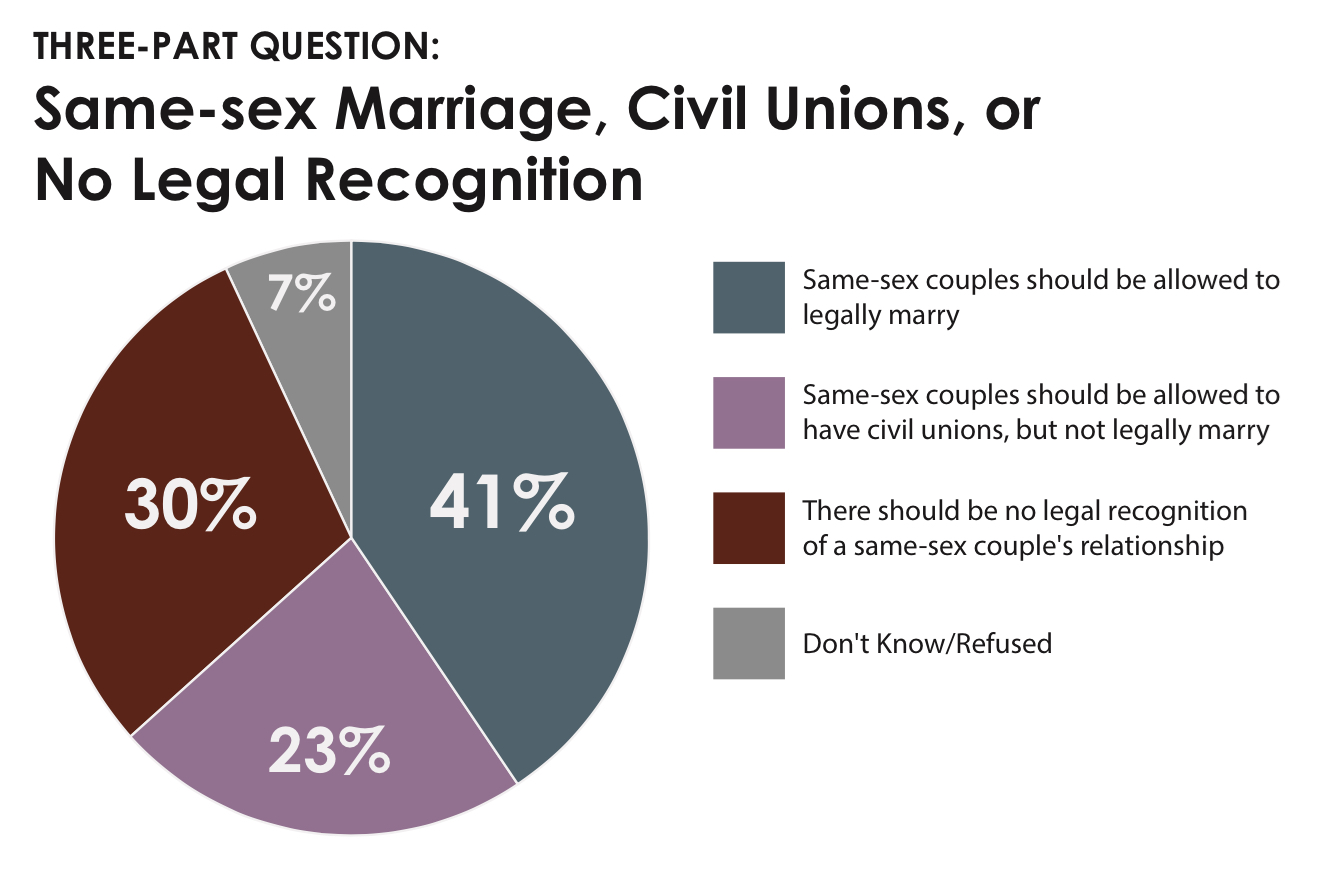
While Ohio voters are evenly divided on the issue of same-sex marriage when presented a binary choice, when voters are offered a three-way choice between marriage, civil unions, and no legal recognition, a more nuanced picture emerges.
When presented a three-way question, 41% of Ohio voters support allowing gay and lesbian couples to marry legally, 23% say same-sex couples should be allowed to form civil unions but not marry, and 30% say there should be no legal recognition of a same-sex couple’s relationship.
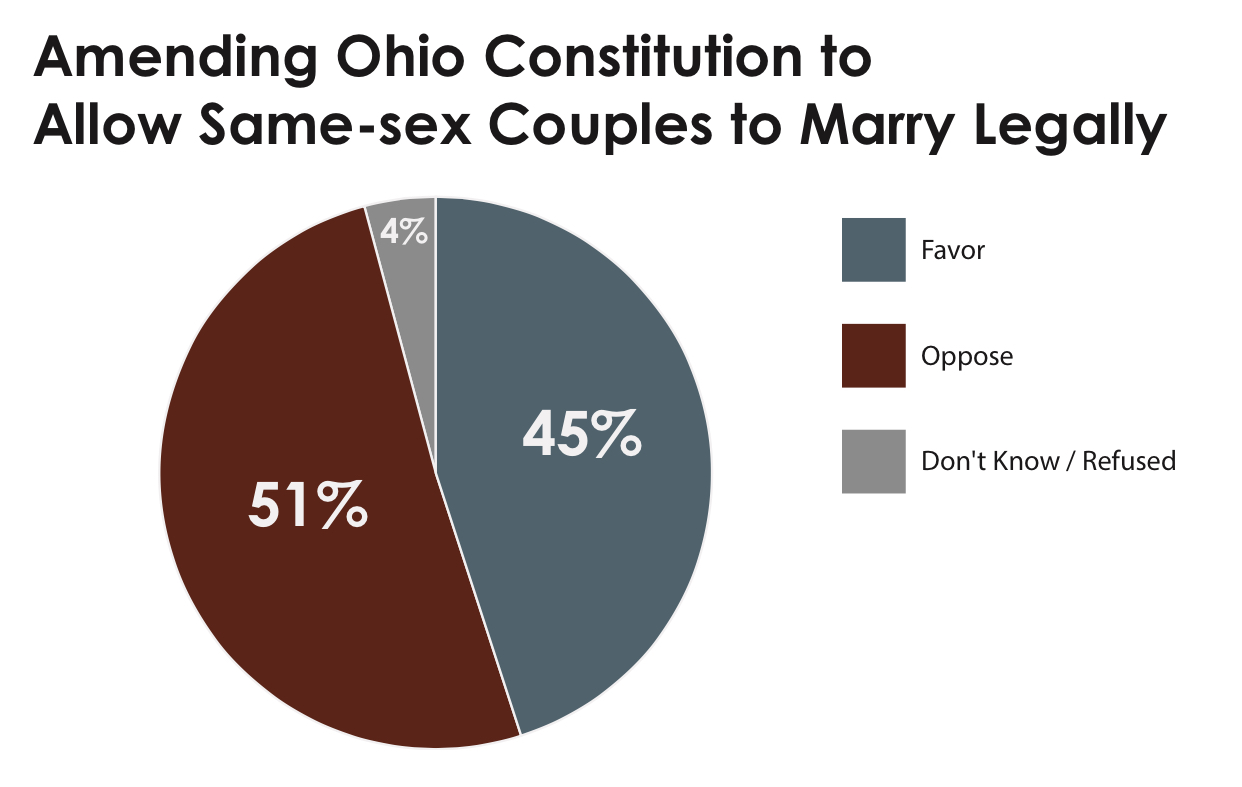
A slim majority of Ohio voters oppose amending Ohio’s constitution to allow same-sex marriage. If the election were held today, less than half (45%) of Ohio voters report that they would support a ballot measure to amend Ohio’s constitution to allow same-sex couples to legally marry. A slim majority (51%) of Ohio voters say they would oppose such an amendment.
- If the election were held today, six-in-ten (61%) Ohio Democratic voters would support amending Ohio’s constitution to allow same-sex couples to marry legally, while independents are equally divided (47% favor, 48% oppose), and Ohio Republican voters are strongly opposed (24% favor, 73% oppose).
- Seven-in-ten (70%) religiously unaffiliated voters support amending the constitution to allow same-sex marriage, but there is no major religious group in which a majority of voters support amending Ohio’s constitution. White mainline Protestants (45% favor, 50% oppose) and Catholics (46% favor, 51% oppose) are closely divided, but with a plurality or slim majority of each group opposing the amendment. A majority (53%) of minority Protestant voters and three-quarters (75%) of white evangelical Protestant voters oppose amending the state constitution to allow same-sex couples to marry.
- Younger and older voters are near mirror images of one another in their support for a constitutional amendment. Six-in-ten (59%) Ohio voters under the age of 50 favor amending the Ohio constitution to allow same-sex couples to marry legally, compared to 38% who are opposed. Among Ohio voters age 50 or older, 63% oppose amending the state’s constitution to legalize same-sex marriage, compared to 33% who would support it.
Ohio voters oppose taking away collective bargaining rights for public unions. Fewer than 3-in-10 (28%) Ohio voters say they would support a law in their state taking away some collective bargaining rights for most public employee unions, including state teachers unions. More than 6-in-10 (62%) voters report that they oppose such a law.
Ohio voters support immigration reform that includes a path to citizenship. More than 6-in-10 (61%) Ohio voters support allowing immigrants currently living in the U.S. illegally an opportunity to become citizens provided they meet certain requirements. Roughly 1-in-10 (12%) say immigrants living in the U.S. illegally should be allowed to become permanent residents but not citizens, while about 1-in-4 (23%) say that these immigrants should be identified and deported.
Ohio voters are divided on the issue of abortion. Forty-seven percent of Ohio voters believe that abortion should be legal in all or most cases, compared to 45% of voters who say abortion should be illegal in all or most cases.
Introduction
The 2013 Ohio Values Survey, a follow-up survey to the 2012 Ohio Values Survey, was designed to gauge Ohio voters’ opinions on three important issue areas as they begin to look toward the 2014 mid-term elections. These issues—same-sex marriage, workplace issues such as discrimination protections for gay and lesbian workers and collective bargaining rights, and immigration reform—are important in Ohio and have national implications.
I. The Ohio Context: Direction and Issue Priorities
Direction of the Country and Ohio
More than 6-in-10 (62%) Ohio voters believe things in the country have gotten pretty seriously off on the wrong track. Only 1-in-4 (25%) Ohio voters believe that the country is generally moving in the right direction, while about 1-in-10 (9%) report having mixed views about the direction of the country.
Ohio voters report more positive assessments about their state, although a plurality still believe that Ohio is heading in the wrong direction. Nearly 4-in-10 (39%) Ohio voters say that the state is moving in the right direction, while nearly half (48%) say things in the state are off on the wrong track. Roughly 1-in-10 (9%) Ohio voters report a mixed opinion about the direction of the state.
Issue Priorities
Two issues top Ohio voters’ list of the most critical issues facing the state: jobs and unemployment, and the cost of health care. Roughly two-thirds of Ohio voters report that unemployment (68%) and the cost of health care (66%) are critical issues facing Ohio. A majority (55%) of Ohio voters also report that the cost of education is a critical issue. Fewer voters cite the issue of immigration (30%) or same-sex marriage (24%) as critical issues. Nearly half (49%) of Ohio voters say that the issue of same-sex marriage is not that important compared to other issues.
There are few differences among Ohio voters by party in perceptions of the importance of unemployment and health care. However, there are significant differences in how important the issues of same-sex marriage and immigration are to Ohio voters.
Although nearly half (46%) of Republican voters in Ohio say the issue of same-sex marriage is not that important compared to other issues, Republican voters (29%) and Tea Party voters (31%) are more likely than Democratic voters (23%) or independent voters (21%) to say it is a critical issue.
Ohio Tea Party voters are more likely than any other political group to say that immigration is a critical issue. Four-in-ten (40%) Tea Party voters say that immigration is a critical issue facing the state, compared to less than one-third of Democratic (31%) and Republican voters (31%). Fewer than 3-in-10 (27%) Ohio independent voters say that immigration is a critical issue in the state.
II. Support for Same-sex Marriage
Direction of the Country and Ohio
Ohio voters are evenly divided in their views on same-sex marriage. Forty-seven percent of voters favor allowing gay and lesbian couples to marry legally, compared to an equal number (47%) who are opposed. Support is essentially unchanged since the 2012 presidential election, when PRRI post-election polling found Ohio voters evenly divided on the legality of same-sex marriage (45% favored, 46% opposed).(1)
There are strong fissures in support for same-sex marriage by political and religious affiliation. About 6-in-10 (61%) Ohio Democratic voters favor allowing gay and lesbian couples to marry legally, as do 51% of independent voters. In contrast, only 28% of Republican voters favor same-sex marriage; nearly 7-in-10 Republican voters (69%) and Tea Party voters (68%) oppose same-sex marriage.
The issue of same-sex marriage also divides Ohio voters along religious lines. More than 7-in-10 (71%) religiously unaffiliated voters favor allowing gay and lesbian couples to marry legally. A slim majority (51%) of white mainline Protestant voters also favor same-sex marriage, compared to 43% who are opposed. Two major religious groups are closely divided: Catholic voters (46% favor, 49% oppose) and minority Protestant voters (45% favor, 47% oppose), a category that includes black and Hispanic Protestants. An overwhelming majority (70%) of white evangelical voters oppose same-sex marriage.
Ohio Voters Less Supportive of Same-sex Marriage When Offered Civil Unions Option
While Ohio voters are evenly divided on the issue of same-sex marriage when presented a binary choice, when voters are offered a three-way choice between marriage, civil unions, and no legal recognition, a more nuanced picture emerges. When presented a three-way question, 41% of Ohio voters support allowing gay and lesbian couples to marry legally, 23% say same-sex couples should be allowed to form civil unions but not marry, and 30% say there should be no legal recognition of a same-sex couple’s relationship. Thus, while nearly two-thirds of Ohio voters say they support some form of legal recognition of same-sex couples’ relationships, that support is divided between support for marriage and civil unions.
Compared to the binary question, in the three-way question support for same-sex marriage drops 6 points, from 47% to 41%. On the other side of the spectrum, opposition to same-sex marriage declines 17 points, from 47% in the binary question to 30% in the three-way question.
Most Ohio Voters Certain their Position on Same-sex Marriage is Right One
Most Ohio voters (57%) report that they are absolutely certain their position on the issue of same-sex marriage is the right one. One-quarter (25%) report that they feel fairly certain their position is correct on the issue, while 12% say they are not too or not at all certain their position is right.
Overall, Ohio voters who favor and oppose same-sex marriage report similar levels of certainty about their views: approximately 6-in-10 of both those who favor and oppose same-sex marriage say they are absolutely certain their view is the right one (59% and 61% respectively).
Roughly equal numbers of Ohio Democratic voters (56%) and Republican voters (60%) and independent voters (56%) say they are absolutely certain about their position. Tea Party voters report even greater certitude, with 74% saying they believe their view is absolutely correct.
Slim Majority of Ohio Voters Oppose Constitutional Amendment to Allow Same-sex Marriage
If the election were held today, less than half (45%) of Ohio voters report that they would support a ballot measure to amend Ohio’s constitution to allow same-sex couples to legally marry. A slim majority (51%) of Ohio voters say they would oppose such an amendment.
There is also some indication that those opposed to a constitutional amendment might have an advantage in turning out voters on this issue. Ohio voters who oppose amending the constitution to allow same-sex couples to marry are nearly twice as likely as those who favor the amendment to say that same-sex marriage is a critical issue facing the state (31% vs. 16% respectively). A majority (57%) of Ohio voters who favor the amendment say that the issue of same-sex marriage is not that important compared to other issues, compared to 41% of Ohio voters who oppose the amendment.
There are significant differences in support for a constitutional amendment by party, religion, age, region and social class.
If the election were held today, six-in-ten (61%) Ohio Democratic voters would support amending Ohio’s constitution to allow same-sex couples to marry legally, while independents are equally divided (47% favor, 48% oppose), and Ohio Republican voters are strongly opposed (24% favor, 73% oppose).
Seven-in-ten (70%) religiously unaffiliated voters support amending the constitution to allow same-sex marriage, but there is no major religious group in which a majority of voters support amending Ohio’s constitution. White mainline Protestants (45% favor, 50% oppose) and Catholics (46% favor, 51% oppose) are closely divided, but with a plurality or slim majority opposing the amendment. A majority (53%) of minority Protestant voters and three-quarters (75%) of white evangelical Protestant voters oppose amending the state constitution to allow same-sex couples to marry.
Younger and older voters are near mirror images of one another in their support for a constitutional amendment. Six-in-ten (59%) Ohio voters under the age of 50 favor amending the Ohio constitution to allow same-sex couples to marry legally, compared to 38% who are opposed. Among Ohio voters age 50 or older, 63% oppose amending the state’s constitution to legalize same-sex marriage, compared to 33% who would support it. The full magnitude of the generation gap can be seen by looking at the differences between the youngest and oldest Ohio voters. Among Millennial Ohio voters (ages 18-33), 64% favor amending the Ohio constitution to allow same-sex couples to marry legally, compared to only 28% of senior Ohio voters (ages 65 and older).
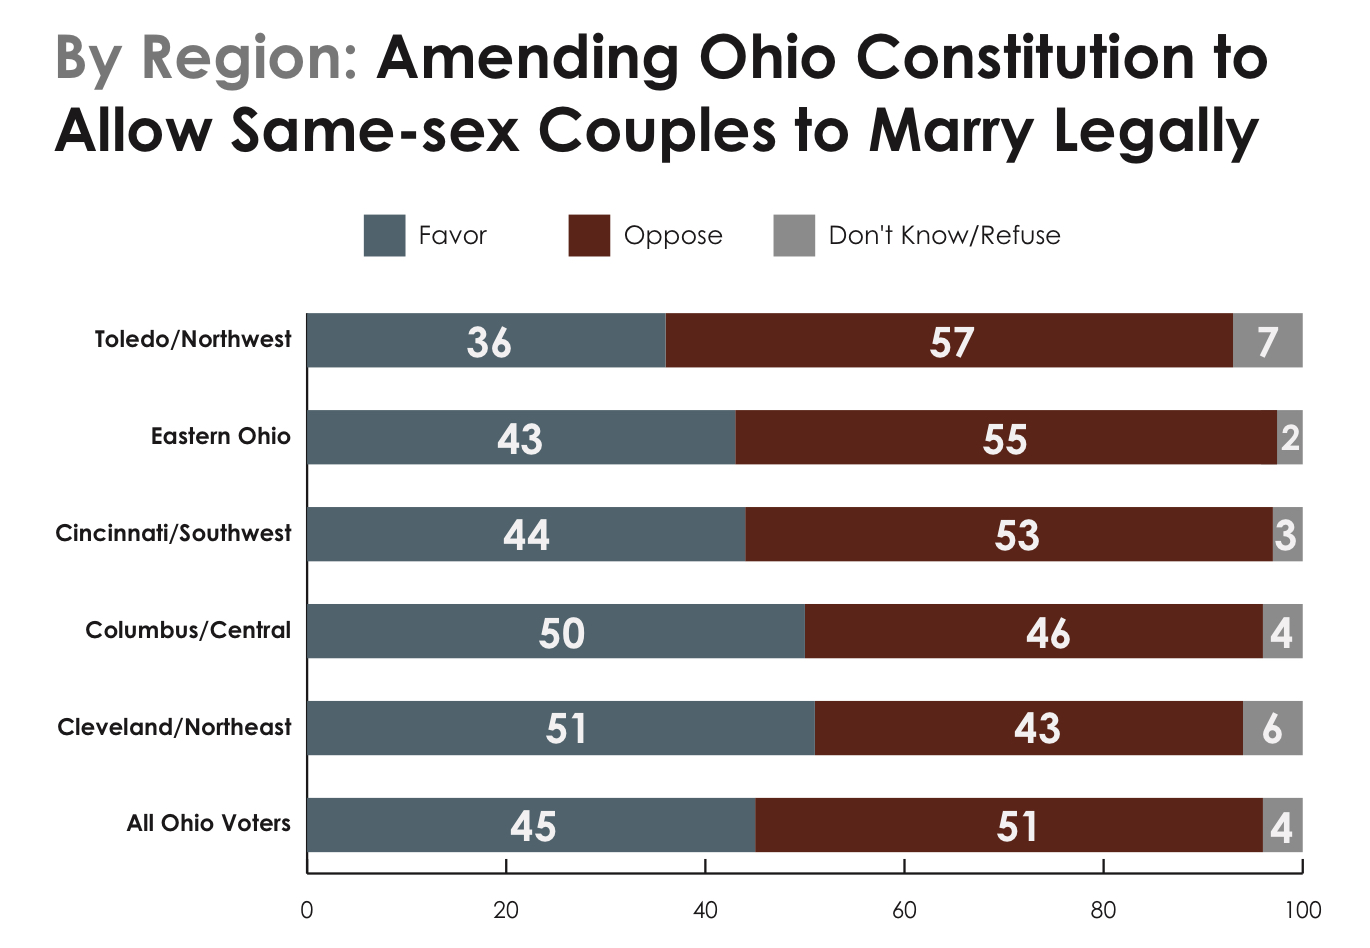
There are also significant regional differences.(2) The strongest support for a constitutional amendment to allow same-sex couples to marry legally exists in the Cleveland area in the northeast (51% favor, 43% oppose) and the Columbus area in central Ohio (50% favor, 46% oppose). Majorities of Ohio voters in all other regions of the state oppose a constitutional amendment to allow same-sex couples to marry legally: the Cincinnati area of southwestern Ohio (44% favor, 53% oppose), rural eastern Ohio (43% favor, 55% oppose), and the Toledo area of northwestern Ohio (36% favor, 57% oppose).
White Ohio voters are also divided on the issue by social class. A slim majority (51%) of white college-educated voters say they would support a constitutional amendment that would allow same-sex couples to marry legally, compared to 43% who would oppose such a change. In contrast, a majority (54%) of white working-class voters would oppose such an amendment, compared to 42% who report that they would support it.
III. Employment Nondiscrimination Laws for Gay and Lesbian People
Strong Support for Employment Nondiscrimination Laws for Gay and Lesbian People
Despite being divided on this issue of same-sex marriage, Ohio voters strongly support laws that would protect gay and lesbian people from employment discrimination. Nearly 7-in-10 (68%) Ohio voters favor laws protecting gay and lesbian people against job discrimination, compared to one-quarter (25%) who oppose such a policy. Solid majorities of voters in both political parties and in every major religious group support workplace nondiscrimination laws for gay and lesbian people.
Majorities of Ohio Republican voters (61%), independent voters (67%) and Democratic voters (75%) favor laws protecting gay and lesbian people against employment discrimination. Ohio Tea Party voters are the notable exception; Tea Party voters are divided (45% favor, 45% oppose).
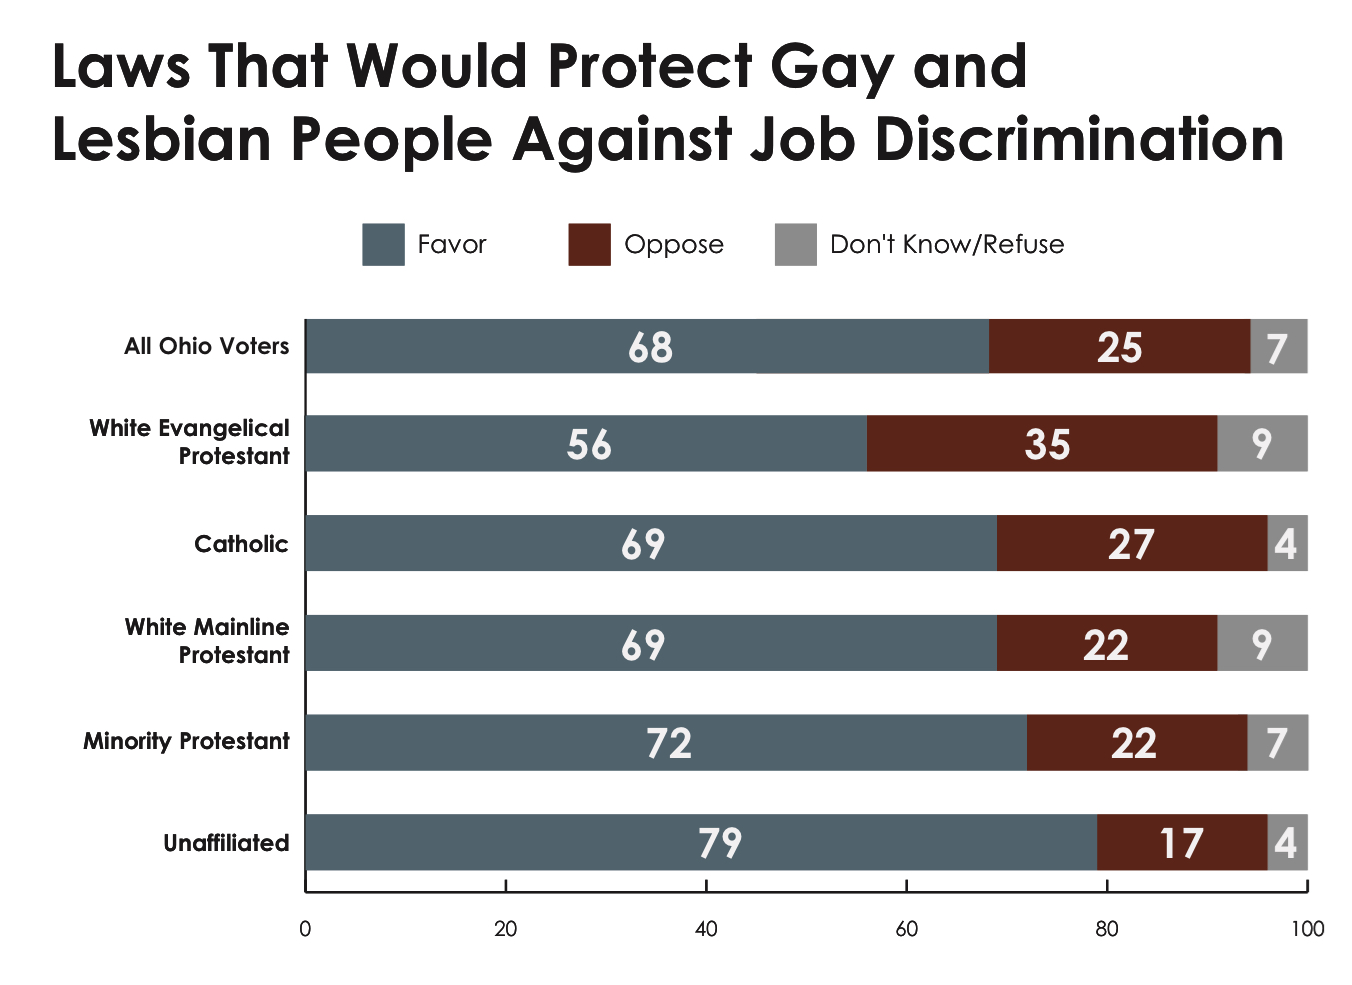
A majority of white evangelical voters (56%), approximately 7-in-10 white mainline Protestant voters (69%), Catholic voters (69%), and minority Protestant voters (72%), and nearly 8-in-10 (79%) religiously unaffiliated voters favor laws protecting gay and lesbian people against job discrimination.
In contrast to the issue of same-sex marriage, there are no significant differences in support across different regions of the state on this issue.
Most Ohio Voters Incorrectly Believe it is Illegal under Ohio and Federal Law to Discriminate on the Basis of Sexual Orientation or Gender Identity
The vast majority of Ohio voters incorrectly believe it is currently illegal under Ohio and federal law to discriminate on the basis of sexual orientation or gender identity in a range of areas. At least 8-in-10 Ohio voters think it is currently illegal under Ohio law (84%) and under federal law (80%) to fire or refuse to hire someone because they are gay, lesbian, bisexual, or transgender. Similar numbers think that it is currently illegal in Ohio to refuse to rent an apartment or house to someone (81%) or to refuse to provide someone with a business service (78%) because they are gay, lesbian, bisexual, or transgender.
IV. Other Issues: Collective Bargaining for Public Unions, Immigration Reform, and Abortion Ohio Voters Oppose Taking Away Collective Bargaining Rights for Public Unions
Fewer than 3-in-10 (28%) Ohio voters say they would support a law in their state taking away some collective bargaining rights for most public employee unions, including state teachers unions. More than 6-in-10 (62%) voters report that they oppose such a law. There are significant differences in strength of opinion by political affiliation.
Roughly 1-in-5 (18%) Democratic voters, 3-in-10 (31%) independent voters and 4-in-10 (41%) Republican voters report that they would favor a law removing some bargaining rights for public sector employee unions. Half (50%) of Republican voters would oppose such a law, as would the majority of independent voters (60%), and Democratic voters (73%). Ohio Tea Party voters are evenly divided over a law that would take away collective bargaining rights for most public employee unions (49% favor, 45% oppose).
White working-class voters in Ohio are more likely than white college-educated voters to oppose a law that would take away collective bargaining rights from public unions, although majorities of both groups say they would oppose it (64% and 56% respectively).
Ohio Voters Support Immigration Reform that Includes a Path to Citizenship
More than 6-in-10 (61%) Ohio voters support allowing immigrants currently living in the U.S. illegally an opportunity to become citizens provided they meet certain requirements. Roughly 1-in-10 (12%) say immigrants living in the U.S. illegally should be allowed to become permanent residents but not citizens, while about 1-in-4 (23%) say that these immigrants should be identified and deported.
There is bipartisan support for immigration reform policy that includes a path to citizenship for immigrants who are currently in the country illegally. A majority of Republican voters (53%), independent voters (56%), and Democratic voters (69%) favor allowing immigrants living in the U.S. illegally an opportunity to become citizens, provided they meet certain requirements. Less than half (45%) of Tea Party voters favor a pathway to citizenship for these immigrants, while nearly as many (41%) say immigrants living in the United States illegally should be identified and deported.
A majority of all religious voters in Ohio support a path for citizenship for immigrants currently living in the U.S. illegally, including 56% of white evangelical voters, 58% of white mainline Protestant voters, 61% of Catholic voters, 77% of minority Protestant voters, and 60% of religiously unaffiliated voters.
Similar numbers of voters (59%) in Ohio favor allowing immigrants who were brought to the United States illegally as children the opportunity to gain legal resident status if they join the military or go to college, a policy known as the DREAM Act.
Ohio Voters Divided on Abortion
Ohio voters are divided on the issue of abortion. Forty-seven percent of Ohio voters believe that abortion should be legal in all or most cases, compared to 45% of voters who say abortion should be illegal in all or most cases. Similar to the issue of same-sex marriage, there are strong divisions on this issue by political affiliation, religion, and region.
Endnotes
1 Public Religion Research Institute, Post-election 2012 Ohio Values Survey (November 2012). Click here for topline and methodology.
2 Ohio regions were defined by county. For a list of which counties were included in each region, see Appendix 1.
3 Ohio population density is based on county-level population density (i.e., total population divided by total land area in square miles). County is based on self-reported zip code, and counties are divided into density quintiles where 1=lowest density and 5=highest density.
4 Telephone usage refers to whether respondents have only a landline telephone, only a cell phone or both types.
Recommended citation:
Jones, Robert P., Daniel Cox, and Juhem Navarro-Rivera. “The 2013 Ohio Values Survey.” PRRI. 2013. http://www.prri.org/research/2013-ohio-values-survey/.