Executive Summary
 The top four most important economic issues cited by Americans today are the lack of jobs (26%), the budget deficit (17%), the rising cost of health care (18%), and the increasing gap between the rich and poor (15%). About 1-in-10 say that social security (9%) or the rising costs of education (9%) is the country’s most important economic problem.
- While roughly one-quarter of Republicans (26%) and Democrats (25%) say the lack of jobs is America’s most important economic problem, Republicans and Democrats strongly differ in their views of the importance of the budget deficit (31% vs. 7% most important) and the increasing gap between the rich and the poor (6% vs. 21% most important).
Americans are generally pessimistic about upward economic mobility. Nearly half (47%) of Americans believe that their generation is worse off financially than their parents’ generation, compared to 16% who believe their generation is doing about the same, and 36% who believe they are better off than their parents’ generation.
- The Silent Generation (ages 66-88) is the only generation in which a majority (59%) believe they are better off than their parents’ generation. Only one-quarter (26%) of the Silent Generation believe their generation is worse off than their parents’ generation. Baby Boomers (ages 49-67) are divided (45% worse off vs. 40% better off). Majorities of younger Americans in Generation X (ages 34-48) (51%) and Millennials (ages 18-33) (58%) believe they are worse off than their parents’ generation.
A majority (54%) of Americans agree that hard work and determination are no guarantee of success for most people, while 45% disagree.
- There are substantial divisions by income level. Nearly 6-in-10 (59%) Americans with household incomes under $30,000 a year believe hard work and determination are no guarantee of success, a view held by less than half (48%) of Americans with household incomes in excess of $100,000 a year.
Less than one-third of Americans believe the federal government is either generally working (7%) or working with some major problems (24%). Roughly two-thirds say the federal government is broken but working in some areas (40%) or completely broken (26%).
More than 6-in-10 (63%) Americans agree that government should be doing more to reduce the gap between rich and poor. Similar numbers (62%) say it is the responsibility of government to take care of people who cannot take care of themselves. A majority (56%) of Americans also believe the government should guarantee health insurance for all citizens, even if it would require tax increases.
A majority of Americans believe American capitalism is working very well (9%) or somewhat well (45%), while more than 4-in-10 say it is working not too well (26%) or not at all well (16%).
- Among Americans who say American capitalism is working, one-third (33%) believe this is because the system encourages personal responsibility, while a similar number say capitalism is working because it provides equal opportunities for everyone (29%). About 1-in-4 (24%) say capitalism is working well because it promotes individual freedom, and roughly 1-in-10 (11%) cite the creation of wealth.
- Among Americans who say American capitalism is not working, more than one-third (34%) say this is because the system encourages greed. Roughly 3-in-10 (28%) say that American capitalism is not working because it does not provide equal opportunities for everyone. More than 1-in-10 say the primary reason capitalism is not working is because it creates poverty (14%), or because it creates lasting inequalities (11%).
Americans are nearly evenly divided on whether capitalism and the free market system are consistent with (41%) or at odds with (44%) Christian values. There are only modest differences among religious groups in views about American capitalism’s compatibility with Christian values.
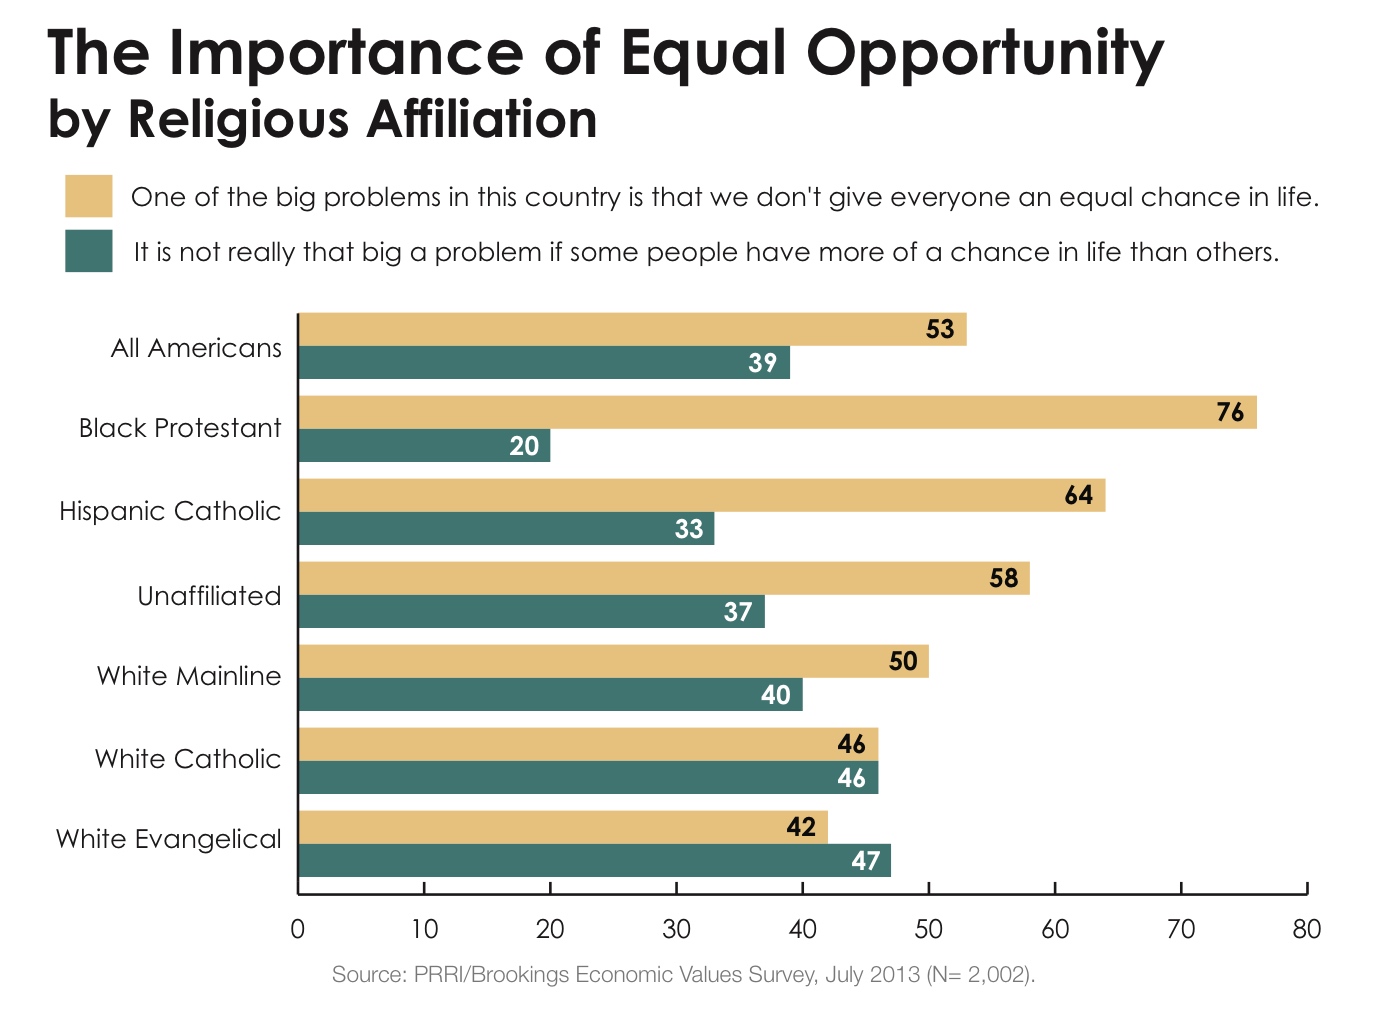
A majority of Americans (53%) believe that “one of the big problems in this country is that we don’t give everyone an equal chance in life.” By contrast, nearly 4-in-10 (39%) agree that “it is not really that big a problem if some people have more of a chance in life than others.”
- Nearly 7-in-10 (69%) Democrats and a majority of independents (54%) agree that one of the biggest problems in this country is that we do not give everyone an equal chance in life. By contrast, a majority of Republicans (58%) and Americans who identify with the Tea Party (57%) think that it is not really a big problem if some people have more of a chance in life than others.
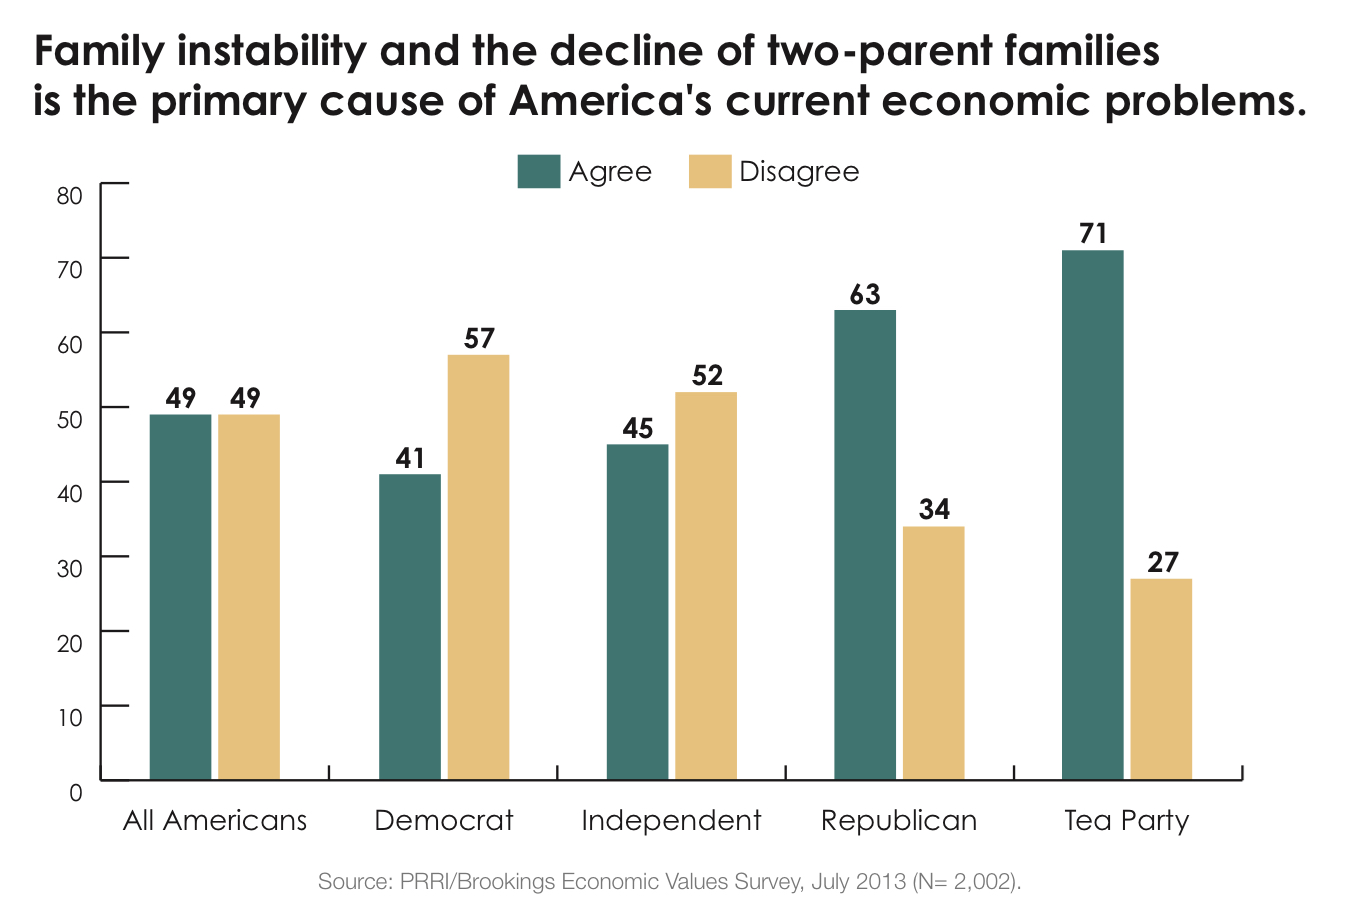
Americans are divided on the economic impact of family structure and instability. Nearly half (49%) of Americans agree that family instability and the decline of two-parent families is a primary cause of America’s current economic problems, while an equal number (49%) disagrees.
- There are significant racial and ethnic divisions. About 6-in-10 Hispanic Americans (62%) agree that family instability and the decline of the two-parent family are primary causes of America’s current economic problems, while white Americans are divided: 49% agree and 48% disagree. Roughly 6-in-10 (59%) black Americans disagree that family instability and the decline of two-parent families is the primary cause of America’s current economic problems.
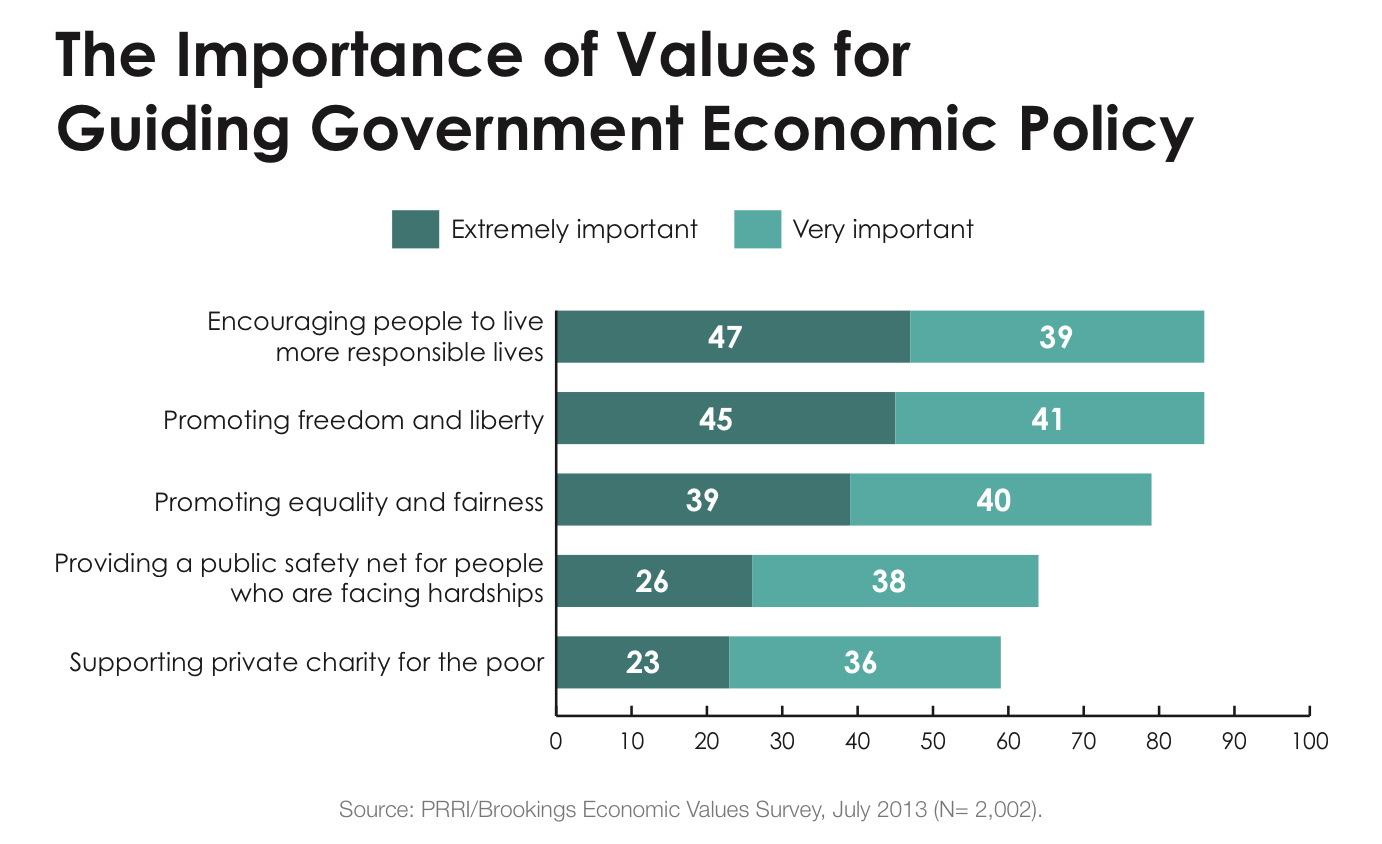
There is a broad consensus about the values that should guide the government’s economic policy, with approximately 8-in-10 Americans agreeing that promoting freedom and liberty (86%), encouraging people to live more responsible lives (86%), and promoting equality and fairness (79%) are extremely important or very important values for guiding government economic policy. More than 6-in-10 Americans cite providing a public safety net for people facing hardships (64%) as an extremely or very important guide, while fewer Americans (59%) say the same of supporting private charity for the poor.
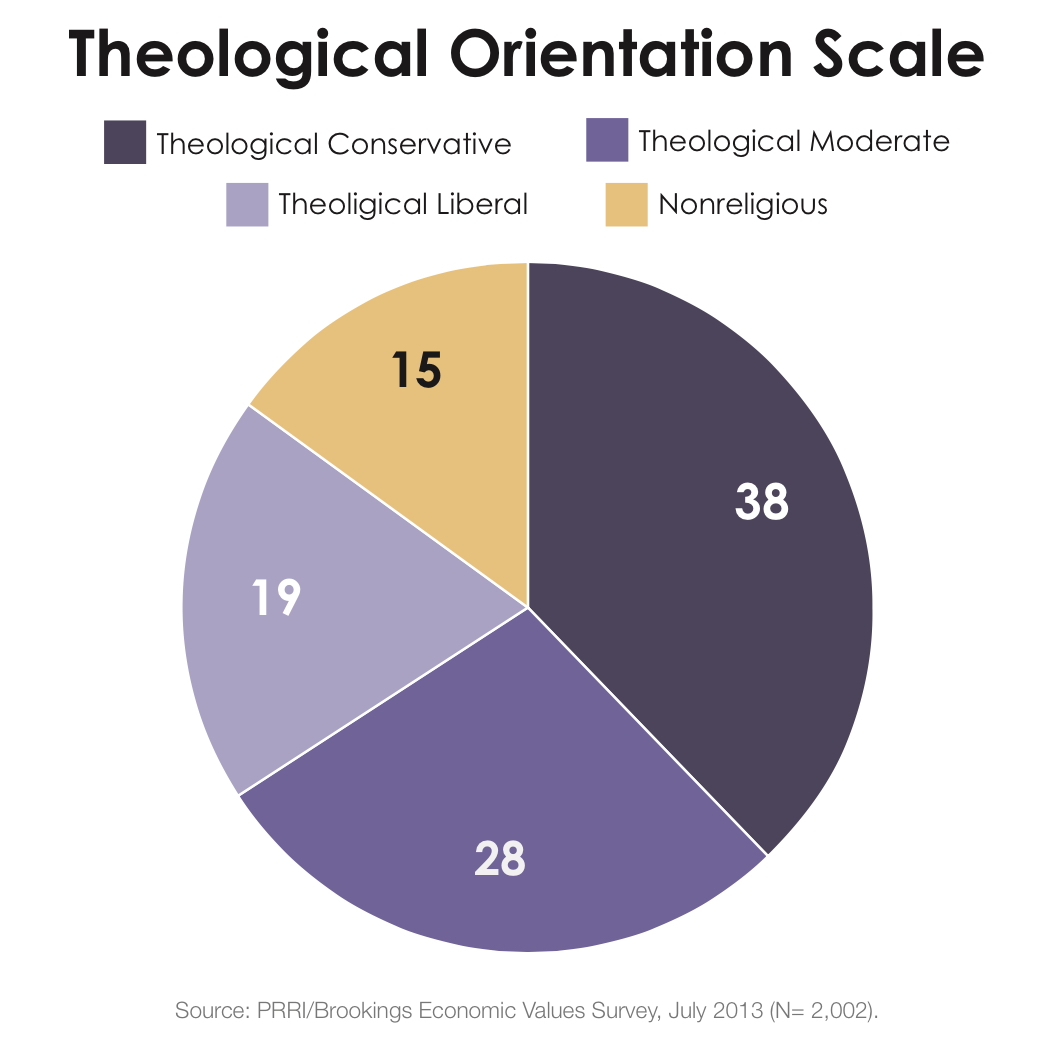
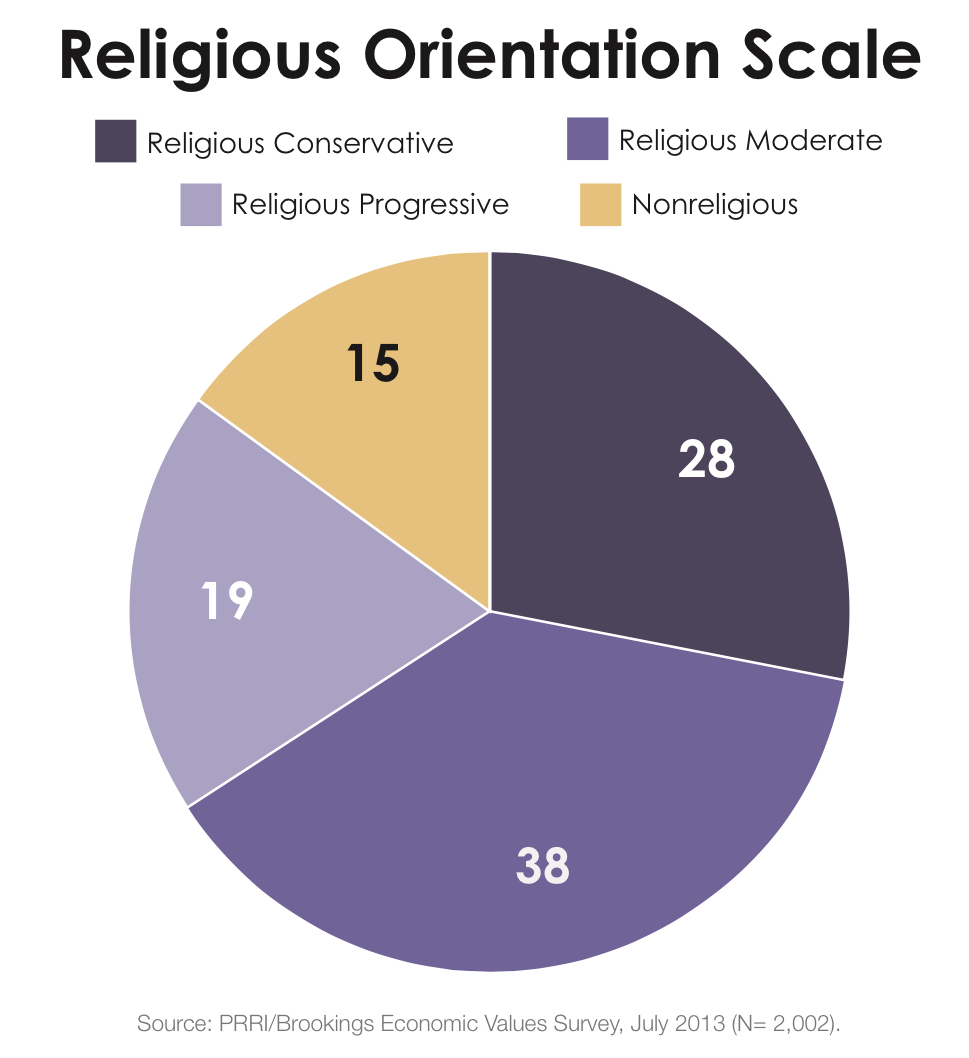
A newly developed religious orientation scale that combines theological, economic and social outlooks finds that 28% of Americans are religious conservatives, 38% are religious moderates, and 19% of Americans are religious progressives; additionally, 15% of Americans are nonreligious.
- Religious progressives and conservatives are distributed in very different ways within the two major political parties. Among Democrats, 28% are religious progressives,42% are religious moderates, and 13% are religious conservatives; additionally, 17% are nonreligious. Among Republicans, a majority (56%) are religious conservatives, 33% are religious moderates, five percent are religious progressives, and six percent are nonreligious.
- Religious progressives are significantly younger than religious conservatives. The mean age of religious progressives is 44—just under the mean age in the general population of 47—while the mean age of religious conservatives is 53. The mean age of the nonreligious is 42.
- Religious conservatives make up smaller proportion of each successive generation, from 47% of the Silent Generation, 34% of Baby Boomers, 23% of Generation X, and 17% of Millennials.
- Religious progressives constitute nearly twice the proportion of Millennials (23%), compared to the Silent Generation (12%). Among Millennials, there are also roughly as many nonreligious (22%) as religious progressives.
Religious progressives are significantly more heterogeneous than religious conservatives in terms of religious affiliation. Catholics (29%) constitute the largest single group among religious progressives, followed by white mainline Protestants (19%), those who are not formally affiliated with a religious tradition but who nevertheless say religion is at least somewhat important in their lives (18%), and non-Christian religious Americans such as Jews, Buddhist, Hindus, and Muslims (13%). Notably, white evangelical Protestants constitute only four percent of religious progressives. By contrast, white evangelical Protestants constitute more than 4-in-10 (43%) of religious conservatives, followed by Catholics (17%) and white mainline Protestants (15%). Black Protestants comprise about 1-in-10 of both the religious progressive (9%) and religious conservative (8%) coalitions.
Religious progressives and religious conservatives also hold different views about what being a religious person means.
Nearly 8-in-10 (79%) religious progressives say being a religious person is mostly about doing the right thing, compared to 16% who say it is about holding the right beliefs. By contrast, a majority (54%) of religious conservatives say being a religious person is primarily about having the right beliefs, while less than 4-in-10 (38%) say it is mostly about doing the right thing.
Religious conservatives and religious progressives disagree about the degree to which social problems stem from individual actions and decisions. More than 8-in-10 (82%) religious conservatives agree that if enough people had a personal relationship with God, social problems would take care of themselves. By contrast, nearly 7-in-10 (68%) religious progressives disagree that if enough people had a personal relationship with God, social problems would take care of themselves, compared to 31% who agree.
On questions related to economic policy and the role of government, religious progressives generally hold similar views to nonreligious Americans and religious moderates, while religious conservatives stand apart. For example, 37% of religious conservatives agree that the government should do more to reduce the gap between the rich and the poor, compared to 69% of religious moderates, 72% of the nonreligious, and nearly 9-in-10 (88%) religious progressives.
I: Economic Outlook, Policy, and Values
The Current Economic Context
Economic Priorities
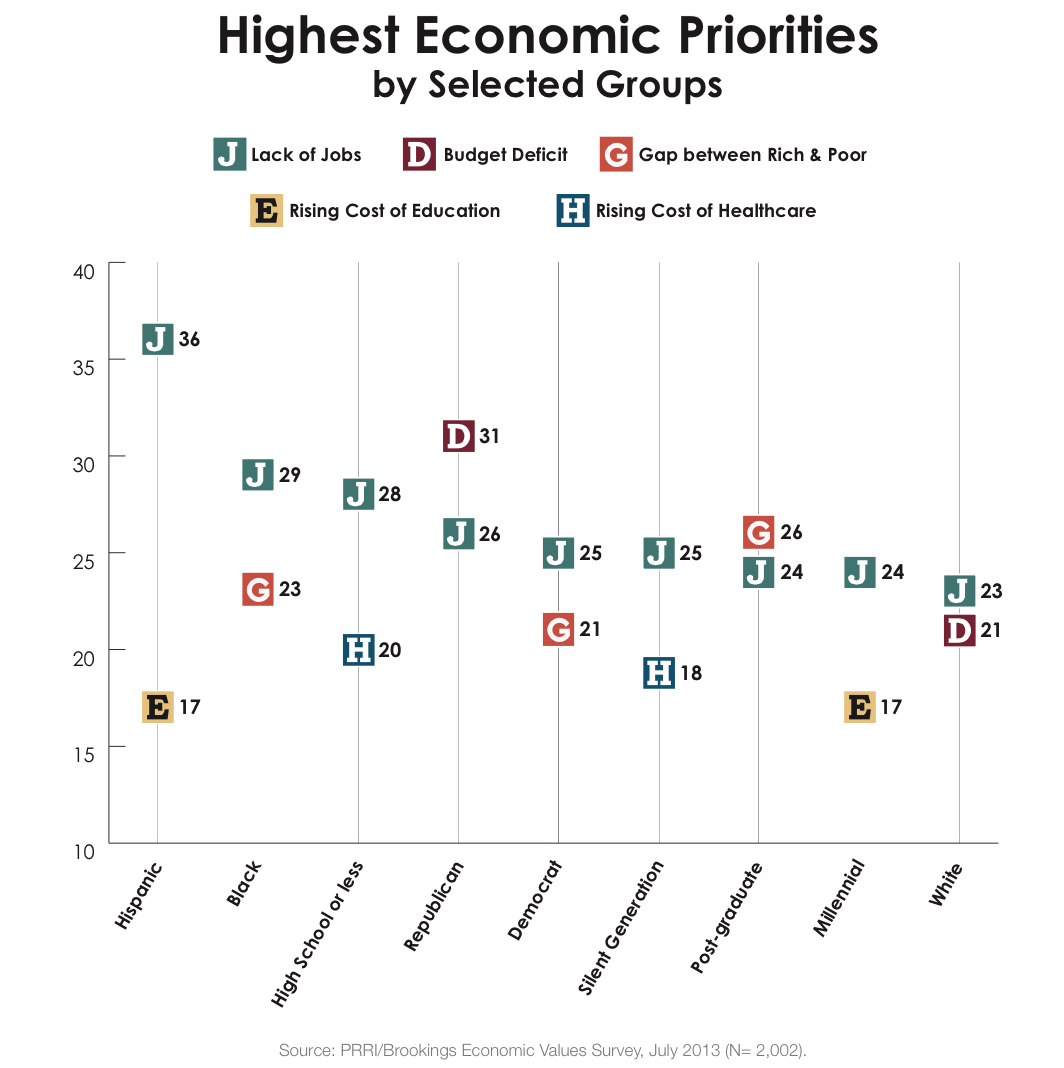
While the economy is showing some signs of recovery, Americans continue to say the lack of jobs is the most important economic issue facing the country, and they remain fairly pessimistic in their personal economic outlook. The most important economic issues cited by Americans today are the lack of jobs (26%), the budget deficit (17%), the rising cost of health care (18%), and the increasing gap between the rich and poor (15%). About 1-in-10 say social security (9%) or the rising costs of education (9%) is the country’s most important economic problem.
There are substantial differences by race and political affiliation. Hispanic Americans (36%) are more likely than black non-Hispanic Americans (29%) and white non-Hispanic Americans (23%) to say the lack of jobs is the country’s most pressing economic problem. (1) White Americans (21%), on the other hand, are more likely than black Americans (4%) and Hispanic Americans (9%) to say the budget deficit is the most important problem. Hispanic Americans are more likely to mention the rising cost of education (17%), while black Americans are significantly more likely to cite the increasing gap between rich and poor (23%) as America’s most important economic problem.
Although roughly one-quarter of Republicans (26%) and Democrats (25%) say the lack of jobs is America’s most important economic problem, Republicans and Democrats strongly differ in their views of the importance of the budget deficit (31% vs. 7%) and the increasing gap between the rich and the poor (6% vs. 21%).
Religiously unaffiliated Americans are more likely than any religious group to say the gap between the rich and poor is America’s most serious economic issue. Religiously unaffiliated Americans (27%) are three times as likely as white evangelical Protestants (9%) and Catholics (7%) and nearly twice as likely as white mainline Protestants (15%) to say that economic inequality is America’s most important economic problem. Religiously unaffiliated Americans are also more likely than black Protestants (22%) to say this is America’s most pressing economic issue.
Americans’ views about which economic issue is most important are, not surprisingly, influenced by the challenges most relevant to their own lives. For instance, Millennials (age 18 to 33) are three times more likely than members of the Silent Generation (age 68 and older)(2) to say the rising cost of education is the most serious economic issue (17% vs. 5%), while members of the Silent Generation are twice as likely as Millennials to cite social security (13% vs. 7%).
Looking Back, Looking Ahead: Economic Inequality and Mobility
Knowledge of Increasing Economic Inequality
Seven-in-ten (70%) Americans believe the income gap between the rich and poor has gotten larger during the past 10 years. Only 5% say it has gotten smaller, and roughly 1-in-5 (21%) say it has stayed about the same.
Knowledge about the growth of economic inequality in America varies significantly by political affiliation, level of educational attainment, and ethnicity. Democrats (74%) and independents (72%) are more likely than Republicans (62%) and Americans who identify with the Tea Party (62%) to say the income gap has increased during the past decade. Americans with a 4-year college degree (80%) are significantly more likely than those with a high school education or less (60%) to believe that the income gap has grown during the last 10 years. Notably, Hispanics (52%) are much less likely than white (72%) or black (75%) Americans to believe the economic disparity between the rich and poor has gotten larger.
Awareness of the rising gap between the rich and poor is also strongly associated with concerns about the issue. Americans who say the economic gap has increased during the last 10 years are more likely to say that this is the most serious issue facing the United States (20%), compared to those who say the gap has gotten smaller (6%) or stayed the same (4%).
Perceptions of Economic Recovery and Personal Financial Situation
The public is divided on whether the American economy has recovered during the last two years. Roughly equal numbers of Americans say during the last two years the economy has gotten better (35%) as say it has gotten worse (34%), and nearly 3-in-10 (28%) say the American economy has stayed about the same during this time period.
Perceptions of America’s recent economic performance are tied closely to political worldviews. Groups that are most supportive of President Obama are more optimistic in their appraisal of the economy. Democrats (56%) and black Americans (52%) are more likely than any other groups to say the economy has improved during the last two years. The following groups are also more likely to say the economy has gotten better than to say it has gotten worse: white college-educated Americans (42% vs. 29%), Millennials (39% vs. 26%), and Hispanics (38% vs. 20%). Conversely, a majority of Tea Party members (68%), Republicans (59%), and white working-class Americans (51%) say the economy has gotten worse during the last two years.
Across the board, Americans are more likely to believe the U.S. economy has improved (35%) than to believe their own personal financial situation has improved (23%) during the last two years. This is particularly true among Democrats, 56% of whom say the U.S. economy is improving, while only 31% say their personal situation is improving. Black Americans (52%) are also much more likely to see economic improvement in the country than in their own lives (32%).
Perceptions of Economic Mobility across Generations
Americans are generally pessimistic about upward economic mobility, both when comparing their generation to their parents’ generation and when comparing their generation to their children’s generation.
Looking to the past, nearly half (47%) of Americans believe their generation is worse off financially than their parents’ generation, compared to 16% who believe their generation is doing about the same and 36% who believe they are better off than their parents’ generation. Notably, each successive generation is significantly more likely to believe they are worse off than their parents’ generation. Only about one-quarter (26%) of the Silent Generation believe they are worse off than their parents’ generation, and Baby Boomers (age 49 to 67) are divided (45% worse off vs. 40% better off). But a majority (51%) of Generation X (age 34 to 48) and nearly 6-in-10 (58%) Millennials believe they are worse off than their parents’ generation. Only one-quarter (25%) of Millennials believe their generation will be better off than their parents’ generation, compared to nearly 6-in-10 (59%) of the Silent Generation.
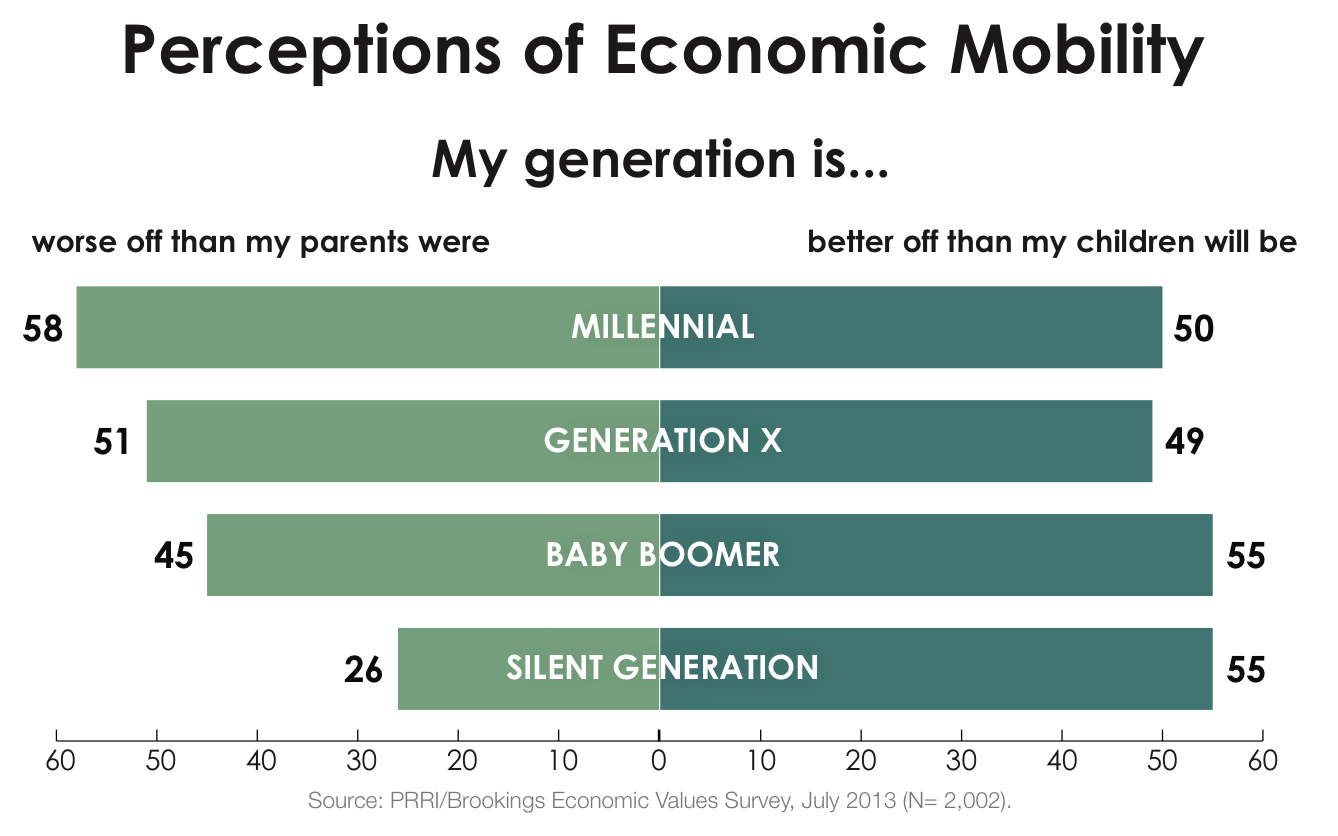
Looking to the future, Americans across generational lines exhibit substantial pessimism. Overall, Americans are twice as likely to believe their generation is better off financially than their children’s generation will be (52%) than they are to believe that their generation is worse off than their children’s generation (26%); 18% believe their children’s prospects are the same as their own. About half of Millennials (50%) and members of Generation X (49%) say their generation is better off than their children’s will be, as do 55% of Baby Boomers and members of the Silent Generation.
The American Economic System
The Role of the Federal Government
American attitudes about the size and role of government are complicated, reflecting in part the complex and evolving nature of the institution itself. Most Americans perceive government expansion negatively, reporting the government is inefficiently run and government does little in the way of assisting people like them. However, Americans simultaneously demonstrate a strong preference for government action in addressing large social problems like economic inequality and providing for the social welfare of Americans.
Is the Federal Government Broken?
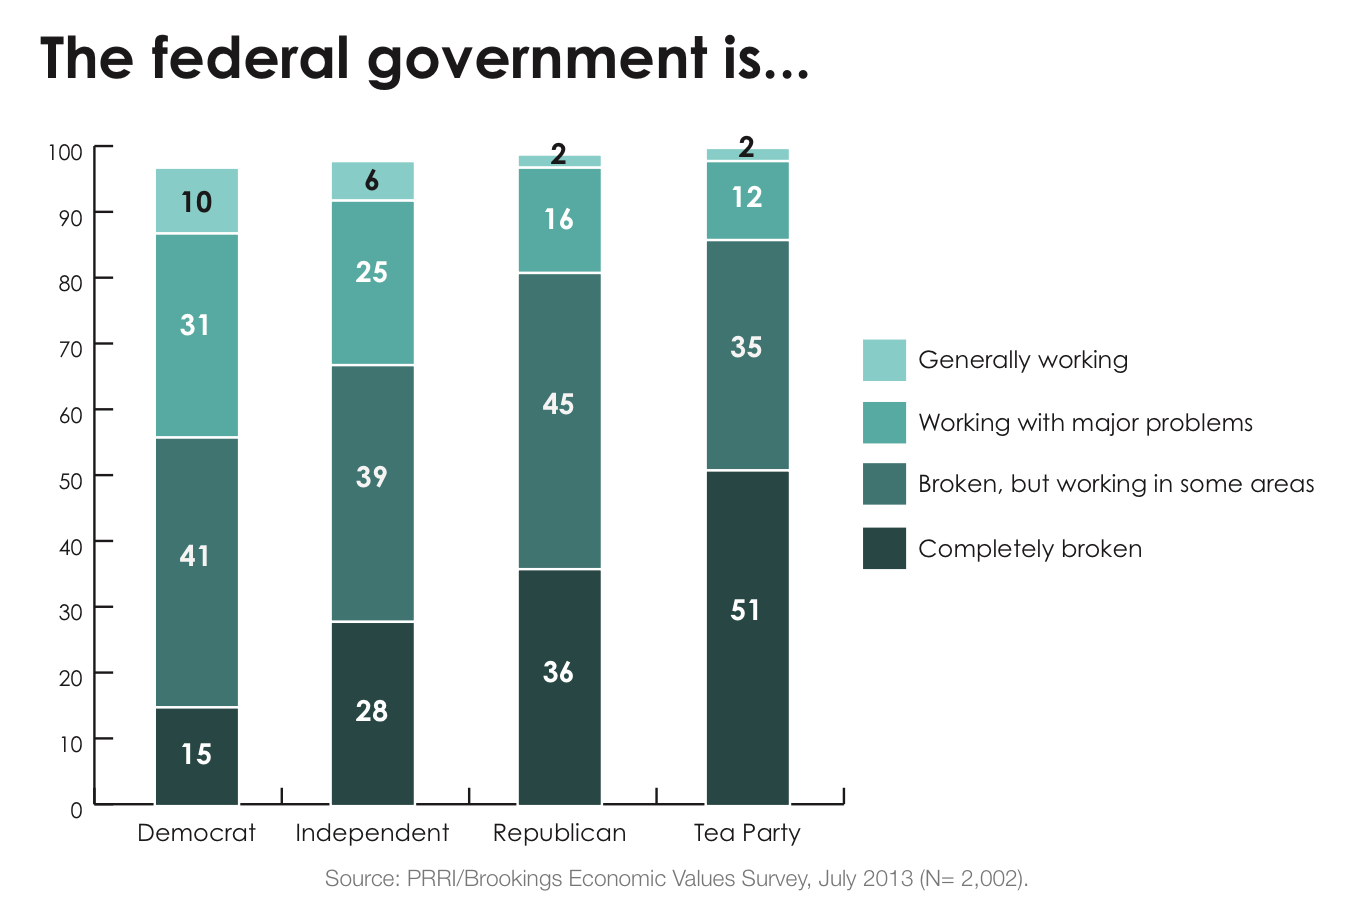
Americans’ assessments of the health of the federal government are generally negative. Less than one-third of Americans believe that the federal government is either generally working (7%) or working with some major problems (24%). Roughly two-thirds say the federal government is broken but working in some areas (40%) or completely broken (26%).
Views about government differ sharply by political affiliation, race and ethnicity, and generation. While majorities of all parties believe the federal government is mostly or completely broken, there are significant differences in intensity. Americans who identify with the Tea Party movement stand out in their views about government. Nearly 9-in-10 Tea Party members say the government is either broken but working in some areas (35%) or completely broken (51%). Similarly, 8-in-10 Republicans say the government is either mostly (45%) or completely (36%) broken. A majority of Democrats also believe the government is mostly (41%) or completely (15%) broken, but a substantial minority believe the government is working with some major problems (31%) or generally working (10%).
No group gives higher marks to the federal government than Hispanic Americans. More than 4-in-10 say the government is either generally working (15%) or working but with some major problems (29%). By contrast, less than one-third of white Americans (27%) or black Americans (31%) say the government is generally working or working with some problems. White Americans (31%) and black Americans (22%) are more likely than Hispanic Americans (12%) to believe the U.S. government is completely broken.
Millennials express more positive assessments of government performance. Roughly 4-in-10 say the federal government is generally working (8%) or working with some major problems (31%). Among members of the Silent Generation, only about one-quarter say government is generally working (5%) or working with some problems (19%). They are more than twice as likely as Millennials to say the government is completely broken (34% vs. 16%). Baby Boomers are by far the most likely to believe government is broken, with more than 7-in-10 reporting the government is broken but working in some areas (37%) or completely broken (36%).
Most Americans also believe the increased size of the government is not justified. About 6-in-10 (59%) Americans say the government has become bigger over the years because it has gotten involved in things that people should do for themselves. Fewer than 4-in-10 (38%) say growth in government has occurred because the problems America faces are now bigger.
Federal Government Assistance
Most Americans believe they receive at least some assistance from the government. Seventeen percent of Americans say people like them receive a lot of help from the government, while 56% say they receive a little assistance. Roughly one-quarter (26%) of Americans say people like them receive no help from the government at all.
Strong divisions are evident between Americans by political affiliation and race. Democrats (26%), black Americans (26%), and Hispanic Americans (24%) are the groups most likely to report people like them receive a lot of help from the government. Fewer than 1-in-5 Democrats (16%), black Americans (19%) and Hispanic Americans (14%) say people like them receive no assistance. Conversely, only 7% of Tea Party members, 10% of Republicans, and 12% of white working-class Americans say they receive a lot of help from the government. Close to half (44%) of Tea Party members say they receive no help at all from the federal government, while more than one-third of Republicans (37%) and white working-class Americans (35%) say the same.
The Social Safety Net and Economic Inequality
Despite concerns about government growth and perceptions of operational deficiencies, most Americans agree there are certain things that government has a responsibility to address. More than 6-in-10 (63%) Americans agree government should be doing more to reduce the gap between rich and poor. Similar numbers (62%) say it is the responsibility of government to take care of people who cannot take care of themselves. A majority (56%) of Americans also believe that government should guarantee health insurance for all citizens, even if doing so would require tax increases.
There is widespread agreement on government’s responsibility to take care of people who cannot take care of themselves. Strong majorities of Millennials (63%) and Baby Boomers (63%), white working-class Americans (56%) and white college-educated Americans (63%) say the government has a responsibility to assist those less well off. There is also significant agreement across racial lines, with 58% of white Americans, 74% of black Americans, and 69% of Hispanic Americans reporting that the government has an obligation to assist those in need. A majority of white evangelical Protestants (56%), white mainline Protestants (54%), Catholics (68%) and the religiously unaffiliated (62%) believe it is the responsibility of government to help those who cannot take care of themselves.
There is, however, a large partisan gap on this question. There is a 30-point gap between Republicans and Democrats on the issue: 73% of Democrats agree that the government should do more to help those who cannot help themselves, compared to 43% of Republicans.
On the more general question of government’s responsibility to address the more specific problem of economic inequality, there are larger divisions by generation, class, and political affiliation. More than 7-in-10 (71%) Millennials believe the government should do more to reduce the gap between rich and poor, compared to 53% of Silent Generation members. More than 6-in-10 (61%) white working-class Americans also agree that government has a responsibility to reduce economic inequality, while less than half (49%) of white college-educated Americans agree. There is a yawning 52-point divide between Democrats and Republicans on this question. Eighty-five percent of Democrats say the government should do more to address economic inequality, a view shared by only one-third (33%) of Republicans.
There are also large opinion gaps regarding the government’s role in providing health insurance for all U.S. citizens. About 7-in-10 (68%) Millennials believe the government should provide health insurance to all citizens, compared to 52% of Baby Boomers and less than half (45%) of those who belong to the Silent Generation. Forty-seven percent of white Americans support the government providing health insurance for all Americans, compared to 70% of black Americans and 75% of Hispanic Americans. Nearly 7-in-10 (69%) low-income Americans (those with annual household incomes of less than $30,000) agree that the government should provide health insurance for all citizens, while all other income groups are more divided.
Americans are split on whether the government is currently providing too many services that would be better left to religious groups and private charities: 50% say it is, and 48%
say it is not. More than two-thirds (68%) of white evangelicals and a majority (53%) of Catholics agree the government is performing services that would be better left to religious groups and private charities. White mainline Protestants are closely divided (50% agree and 46% disagree), while more than 6-in-10 (63%) religiously unaffiliated Americans disagree.
Evaluations of American Capitalism
Most Americans believe American capitalism is functioning, but few give it high marks. A majority of Americans believe American capitalism is working very well (9%) or somewhat well (45%), while more than 4-in-10 say it is working not too well (26%) or not at all well (16%). There is significant agreement across the political spectrum, with majorities of Democrats (56%), independents (54%), and Republicans (52%) reporting American capitalism is working well.
However, there are significant differences by income and education level. Two-thirds (67%) of high-income Americans (those with annual household incomes of $100,000 or more) say American capitalism is working well, compared to less than half (47%) of low-income Americans (those with annual household incomes of $30,000 or less). More than 6-in-10 (61%) Americans with a college education believe America’s economic system is working well, compared to less than half (49%) of those with a high school education or less.
When asked to specify the most important reason why they believe capitalism is working well, Americans offer a number of different explanations. One-third (33%) of Americans say capitalism is working because it encourages personal responsibility, while 29% say capitalism is working because it provides equal opportunities for everyone. About one-quarter (24%) say capitalism is working well because it promotes individual freedom, and roughly 1-in-10 (11%) cite the creation of wealth.
There are significant differences in the reasons Americans give for why capitalism is working by political affiliation, educational attainment, and social class. Republicans (42%) are much more likely than Democrats (25%) to point to capitalism encouraging personal responsibility, while Democrats (36%) are more likely than Republicans (24%) to cite capitalism providing equal opportunities for everyone. Americans with four-year college degrees (18%) are more than twice as likely as those with a high school education or less (7%) to say capitalism is working because it creates wealth. In contrast, Americans with a high school education or less (36%) are much more likely than college graduates (21%) to say providing equal opportunities for everyone is the reason capitalism is working. White college-educated Americans (16%) are also more likely than white working-class Americans (7%) to point to the creation of wealth as the most important reason capitalism is working.
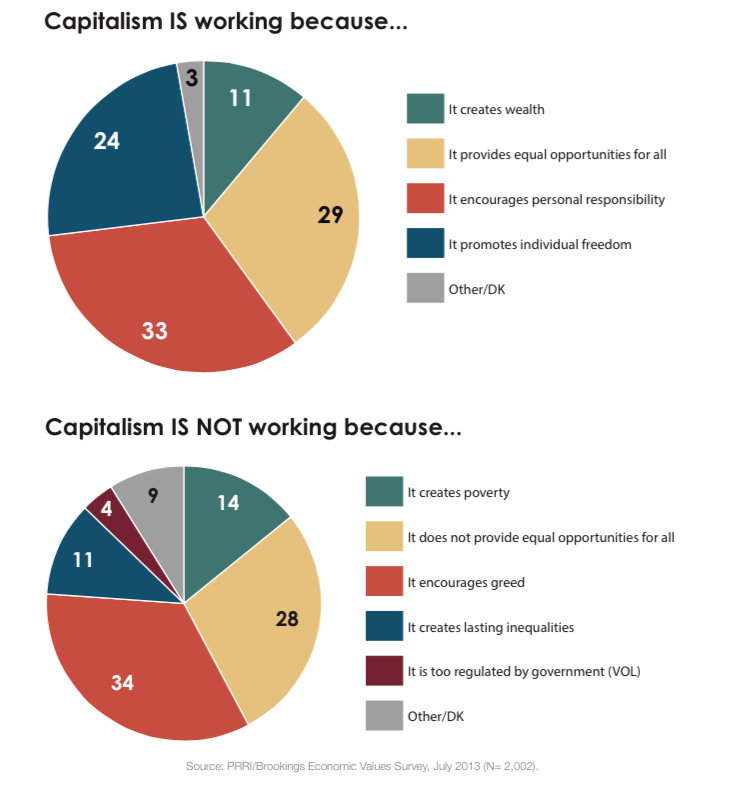
The 4-in-10 (42%) Americans who believe capitalism is not working well cite a wide range of reasons. More than one-third (34%) say capitalism is not working because it encourages greed. Roughly 3-in-10 (28%) say American capitalism is not working because it does not provide equal opportunities for everyone. More than 1-in-10 say the primary reason capitalism is not working is because it creates poverty (14%), or because it creates lasting inequalities (11%). A small number of Americans (4%) say American capitalism is not working because of excessive government interference and regulation.
High-income Americans and low-income Americans have different perspectives on why capitalism is not working well. Nearly 4-in-10 (38%) Americans with household incomes of $30,000 or less say capitalism does not work because it does not provide equal opportunities for everyone, while just 12% of Americans with incomes of $100,000 or more cite this as a reason. Low-income Americans (16%) are also three times more likely than high-income Americans (5%) to say capitalism is not working because it creates poverty. By contrast, high-income Americans (40%) are more likely than low-income Americans (29%) to say capitalism is not working well because it encourages greed.
Americans are nearly evenly divided on whether capitalism and the free market system are consistent with (41%) or at odds with (44%) Christian values. Not surprisingly, there is a significant association between views about capitalism’s compatibility with Christian values and whether capitalism is working. Among those who believe American capitalism is mostly working, 53% believe it is consistent with Christian values. By contrast, among those who believe American capitalism is mostly broken, 27% believe it is consistent with Christian values.
There are only modest differences among religious groups in views about American capitalism’s compatibility with Christian values. Pluralities of white evangelical Protestants (50%), black Protestants (49%), and religiously unaffiliated Americans (46%) believe capitalism and the free market system are at odds with Christian values. White mainline Protestants and Catholics are more closely divided, with 41% of each group believing capitalism is at odds with Christian values, and 46% of each group believing capitalism is consistent with Christian values.
The Opportunity Society?
The Importance and Reality of Equal Opportunity Today
A majority of Americans (53%) believe that “one of the big problems in this country is that we don’t give everyone an equal chance in life.” By contrast, nearly 4-in-10 (39%) say that “it is not really that big a problem if some people have more of a chance in life than others.”
There are substantial differences in Americans’ views along political, racial, religious, and generational lines. Nearly 7-in-10 (69%) Democrats and a majority of independents (54%) agree one of the biggest problems in this country is we do not give everyone an equal chance in life. By contrast, a majority of Republicans (58%) and Tea Party members (57%) think it is not really a big problem if some people have more of a chance in life than others.
White, black, and Hispanic Americans also differ in their views about the importance of equal opportunity. More than three-quarters (77%) of black Americans and more than 6-in-10 (62%) Hispanic Americans think it is a big problem that not everyone has an equal chance in life. White Americans are more divided: 47% say it is a big problem that everyone does not get an equal chance, while 44% disagree.
Majorities of black Protestants (76%), Hispanic Catholics (64%), religiously unaffiliated Americans (58%), and half of white mainline Protestants (50%) think it is a big problem that not everyone has an equal chance in life. White evangelical Protestants (42% big problem vs. 47% not a big problem) and white Catholics (46% big problem vs. 46% not a big problem) are closely divided.
Members of the Silent Generation and Millennials are also at odds on this issue. A majority (58%) of Millennials think it is a big problem that not everyone has an equal chance in life, compared to 36% who say it is not that big a problem. By contrast, members of the Silent Generation are divided: 44% think some people having more opportunities is a big problem, and 47% think it is not that big a problem. The outlook of Baby Boomers more closely resembles Millennials with a majority (53%) reporting one of the big problems in the country is that not everyone has an equal chance in life.
Similar patterns exist on the question of whether equal opportunity is a reality in America today. A majority (53%) do not believe that children from all income groups have adequate opportunities to be successful, compared to 47% who agree.
Perceptions of whether equal opportunity is a reality in contemporary America are closely related to opinions about the importance of the principle. Among those who say that some having more opportunities than others is not that big a problem, 63% believe children from all economic backgrounds currently have adequate opportunities to be successful.
Americans are sharply divided along political and racial lines about the reality of economic opportunity in America. More than 6-in-10 (62%) Democrats do not believe that all children have adequate opportunities to be successful regardless of their economic background. By contrast, majorities of Republicans (56%) and Tea Party members (59%) believe that children from all income groups have adequate opportunities to be successful. Independents are nearly evenly divided (49% agree, 51% disagree).
Two-thirds (67%) of black Americans and a majority (53%) of white Americans do not believe that, in the United States today, children from all income groups have adequate opportunities to be successful. By contrast, more than 6-in-10 (62%) Hispanic Americans believe children from all income groups have adequate opportunities to be successful.
There are modest class divisions on the question of equal opportunity. White working-class Americans are divided on whether children from all income groups have adequate opportunities (49% agree, 50% disagree). However, nearly 6-in-10 (58%) white college-educated Americans do not believe children from different economic backgrounds all have adequate opportunities for success.
Personal Responsibility: Work and Family
Work Ethic and Success
Most Americans are pessimistic about the relationship between hard work and success and doubtful about the existence of a strong work ethic in America today. A majority (54%) of Americans agree that hard work and determination are no guarantee of success for most people, while 45% disagree.
There are substantial divisions on this question by political affiliation and race. More than 6-in-10 Democrats (62%) and a majority (54%) of independents agree that hard work and determination offer no guarantee of success for most people. By contrast, a majority of Republicans (55%) and Tea Party members (56%) disagree.
Nearly 6-in-10 black (57%) and Hispanic (59%) Americans agree that hard work and determination are no guarantee of success for most people. White Americans are more divided: a slim majority (52%) agree that hard work and determination are no guarantee of success for most people, while 47% disagree.
There are substantial divisions by income level. Nearly 6-in-10 (59%) low-income Americans (those with annual household incomes of $30,000 or less) believe hard work and determination are no guarantee of success, a view held by less than half (48%) of high-income Americans (those with annual household incomes of $100,000 or more).
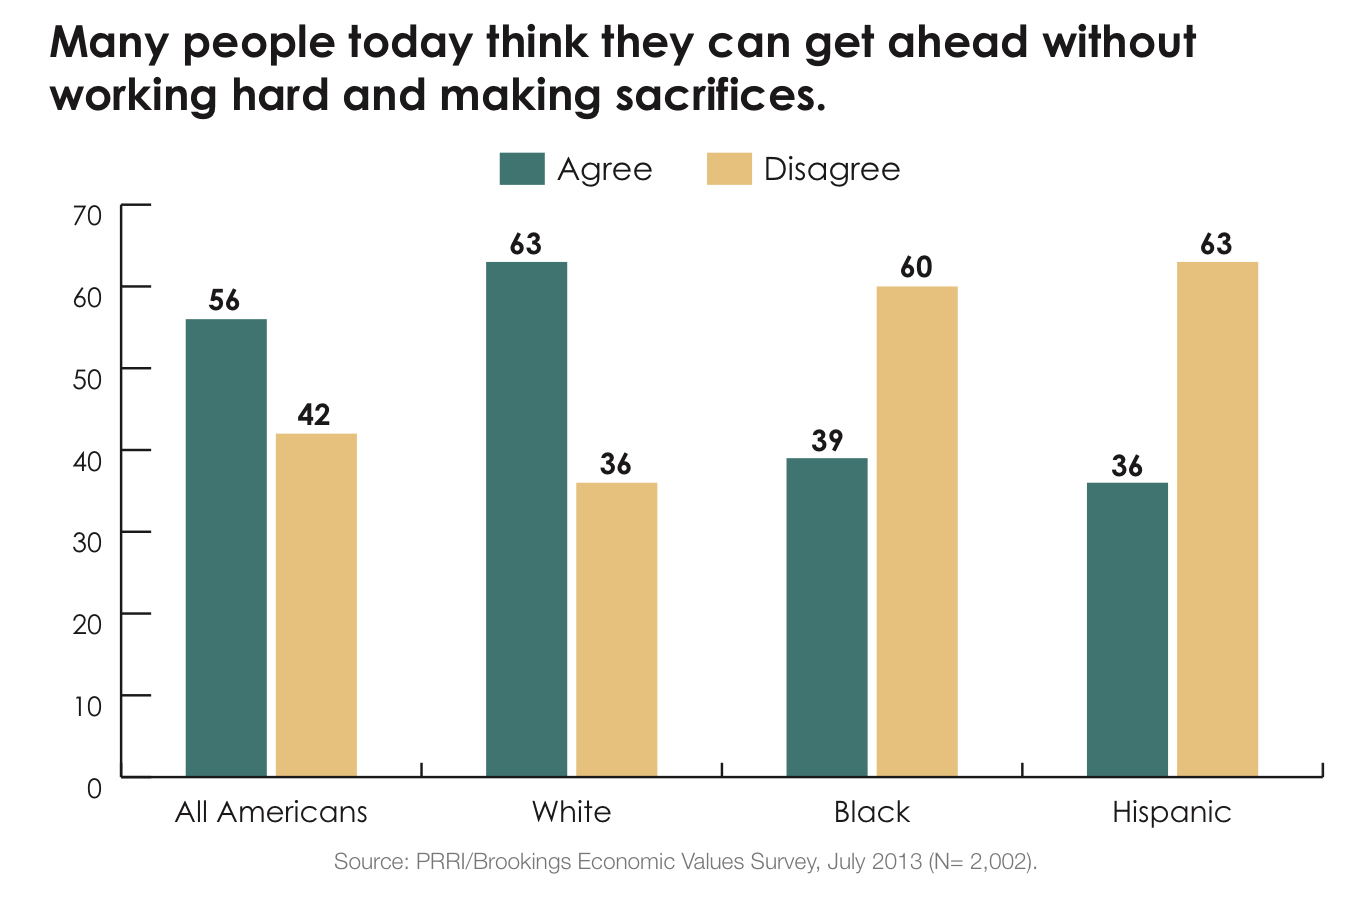
On the issue of a strong work ethic, a majority of Americans (56%) agree that many people today think they can get ahead without working hard and making sacrifices, while about 4-in-10 (42%) disagree. The percentage of Americans who agree with this statement has declined modestly since 1999, when 63% of Americans agreed.(3)
Today, there are significant differences of opinion by party affiliation and race. Approximately two-thirds of Republicans (69%) and Tea Party members (66%) and nearly 6-in-10 (58%) independents agree that many people today think they can get ahead without working hard and making sacrifices. By contrast, 44% of Democrats agree that many people today think they can get ahead without working hard and making sacrifices, while a majority (53%) disagree.
More than 6-in-10 (63%) white Americans agree that many people today think they can get ahead without working hard and making sacrifices. A similar number of black (60%) and Hispanic (63%) Americans disagree.
Family Instability and America’s Current Economic Problems
Changing family structure, especially the decline of traditional two-parent families, has led to debates about the relationship between family structure and economic success. (4) Americans are divided on the economic impact of family structure and instability: nearly half (49%) of Americans agree that family instability and the decline of two-parent families is a primary cause of America’s current economic problems, while an equal number (49%) disagree.
There are major partisan, racial, and religious differences in views about the role of family structure on economic outcomes. More than 6-in-10 (63%) Republicans and more than 7-in-10 (71%) Tea Party members agree that America’s current economic problems result primarily from the decline of two-parent families. By contrast, nearly 6-in-10 (57%) Democrats and a majority (52%) of independents disagree.
About 6-in-10 Hispanic Americans (62%) agree that family instability and the decline of the two-parent family are primary causes of America’s current economic problems. White Americans are divided: nearly half (49%) agree with this association, while a similar number (48%) disagree. Roughly 6-in-10 (59%) black Americans disagree that family instability and the decline of two-parent families is the primary cause of America’s current economic problems.
There are also substantial differences by religious affiliation. Nearly two-thirds of white evangelical Protestants (65%) and a majority of Catholics (55%) agree that family instability and the decline of two-parent families are primary causes of America’s current economic problems. However, a majority (54%) of white mainline Protestants and nearly two-thirds (65%) of religiously unaffiliated Americans disagree.
Economic Policies and Values
Economic Policies
Strategies for Promoting Economic Growth
Differences in views about the proper role of government are also reflected in beliefs about promoting economic growth. A majority (54%) of Americans believe the best way to promote economic growth in the United States is to spend more on education and the nation’s infrastructure while raising taxes on wealthy individuals and businesses to pay for that spending, while 4-in-10 (41%) Americans believe the best way to promote economic growth is to lower taxes on individuals and businesses and to pay for those tax cuts by cutting spending on some government services and programs.
There are substantial political divisions on how the government should promote economic growth. More than three-quarters of Democrats (77%) and a majority (55%) of independents believe the government should spend more on education and infrastructure while taxing the wealthy to pay for that spending, while 7-in-10 (70%) Republicans believe lowering taxes and cutting government services and programs is the best way to promote economic growth in the United States.
There are significant divisions between racial groups on the question. Seven-in-ten black (70%) and Hispanic (70%) Americans believe spending more on education and the nation’s infrastructure and raising taxes on wealthy individuals and businesses to pay for that spending is the best way to promote economic growth, compared to less than half (48%) of white Americans.
Religious groups also disagree about the best approach for economic growth. A majority (63%) of white evangelical Protestants believe lower taxes are the best way to promote economic growth, while majorities of black Protestants (72%), religiously unaffiliated Americans (70%), and Catholics (52%) favor spending more on education and the nation’s infrastructure. White mainline Protestants are divided: 48% believe lower taxes are the best way to promote economic growth, while 46% favor spending more on education and the nation’s infrastructure.
There are substantial generational differences about the best way to promote economic growth. More than 6-in-10 (62%) Millennials believe the best way to promote economic growth is to spend more on education and the nation’s infrastructure while raising taxes on wealthy individuals and businesses to pay for that spending. Less than half (45%) of the Silent Generation agree with that approach, while a full 50% of that generation support lowering taxes on individuals and businesses to boost economic growth. Baby Boomers are also divided, with half (50%) in support of education and infrastructure spending and 45% in favor of lower taxes.
On the specific policy of raising taxes on the wealthy, more than 6-in-10 (63%) Americans favor increasing the tax rate on Americans earning more than $250,000 per year, while about one-third (34%) of Americans oppose such an increase. More than 8-in-10 (81%) Democrats and nearly two-thirds (64%) of independents favor increasing the tax rate on Americans earning more than $250,000 per year; in contrast, roughly 6-in-10 Republicans (58%) and Tea Party members (63%) are opposed. Majorities of every major religious group and the religiously unaffiliated support raising the tax rate on wealthy Americans with the exception of white evangelical Protestants, who are evenly divided (49% favor, 48% oppose).
Increasing the Minimum Wage
There is also strong support for increasing the minimum wage, which is currently set at $7.25 per hour. Nearly three-quarters (73%) of Americans favor increasing the minimum wage from $7.25 per hour to $10.00 per hour. However, there are some differences in intensity by political affiliation and income level.
Nearly 9-in-10 Democrats (88%) and close to three-quarters (73%) of independents favor increasing the minimum wage to $10.00 per hour. Half (50%) of Republicans support such an increase, while 46% are opposed.
Low-income Americans are more likely than high-income Americans to favor raising the minimum wage, though support remains high across all income groups. More than 8-in-10 (84%) Americans who make less than $30,000 per year, compared to 65% of those who make $100,000 or more per year, favor an increase in the minimum wage to $10.00 per hour.
The 2010 Health Care Law
Americans are evenly divided in their support for repealing and eliminating the 2010 health care law, known as the Affordable Care Act, though a substantial number of Americans have no opinion on the issue. More than four-in-ten (42%) Americans favor repealing and eliminating the 2010 health care law, while the same number (42%) are opposed. Signaling the disconnect many Americans feel with the legislation, nearly 1-in-5 (17%) Americans say they do not know whether they support repealing the law or not.
The opinions of Republicans and Democrats are mirror images of one another on this issue. Six-in-ten (60%) Republicans favor repealing the 2010 health care law, compared to 28% who are opposed. On the other hand, only 28% of Democrats favor repealing the health care law, while nearly 6-in-10 (57%) are opposed. Tea Party members are the most likely to support repealing and eliminating the 2010 health care law. Roughly two-thirds (66%) are in favor of repeal and nearly half (49%) say they strongly favor such action. Independents are somewhat divided: 45% support repealing the law, while 38% are opposed.
Among religious groups, white evangelical Protestants are the only religious group in which a majority (57%) support repealing the health care law. Nearly half (45%) of white mainline Protestants also favor repeal. Catholics are evenly divided (43% favor repeal vs. 43% oppose repeal). The religiously unaffiliated and black Protestants are the religious groups most opposed to repealing the health care law. Half (50%) of the religiously unaffiliated oppose repealing the health care law, as do nearly half (47%) of black Protestants.
Economic Values for Guiding Government Policy
There is broad consensus about the values that should guide the government’s economic policy, with approximately 8-in-10 Americans in agreement that promoting freedom and liberty (86%), encouraging people to live more responsible lives (86%), and promoting equality and fairness (79%) are extremely important or very important values. More than 6-in-10 (64%) Americans cite providing a public safety net for people facing hardships as extremely or very important guides, while fewer Americans (59%) say the same of supporting private charity for the poor.
Republicans (93%) and Tea Party members (93%) are most likely to say promoting freedom and liberty is an extremely or very important moral guide to economic policy, though strong majorities of independents (86%) and Democrats (81%) say the same. There are few differences between racial, religious, and ethnic groups on this value.
Strong majorities of all political groups, including 89% of Tea Party members, 87% of Republicans, 86% of Democrats, and 85% of independents, see encouraging people to live more responsible lives as an extremely important or very important moral guide to economic policy.
Majorities of Democrats, Republicans, and independents say promoting equality and fairness is an extremely or very important economic guide, but there is a 22-point gap in intensity between Democrats and Republicans. Nearly 9-in-10 (88%) Democrats say promoting equality and fairness is extremely or very important, followed by independents (81%) and Republicans (66%). Although more than 6-in-10 (61%) Tea Party members regard the promotion of equality and fairness as an extremely or very important guide, they are substantially more likely than other political groups to say the value is not that important (17% of Tea Party members, compared to 7% of Republicans, 5% of independents, and 1% of Democrats). Similarly, there are significant racial differences in intensity. More than 9-in-10 (93%) black Americans say promoting equality and fairness is extremely or very important, compared to 85% of Hispanics and 74% of white Americans.
There are significant differences by political affiliation, race, religion, and income level on the question of whether providing a public safety net for people facing hardships should guide the government’s economic policy. Seventy-seven percent of Democrats say providing a public safety net is extremely or very important, compared to 63% of independents and 47% of Republicans. Black Americans are most likely to say providing a public safety net is an extremely or very important value (82%), compared to 7-in-10 (70%) Hispanic Americans, and roughly 6-in-10 (59%) white Americans.
Majorities of all religious groups say providing a public safety net is an extremely or very important value for guiding economic policy, but there are variations in intensity. Black Protestants are most supportive (80%), followed by Catholics (64%), religiously unaffiliated Americans (60%), white evangelical Protestants (58%), and white mainline Protestants (56%). The importance of this value drops as income rises: nearly three-quarters (73%) of low-income Americans (those with annual household incomes of $30,000 or less) say providing a public safety net for people facing hardships is an extremely or very important value, compared to 56% of high-income Americans (those with annual household incomes of $100,000 or more). Majorities of all political groups, including 63% of Democrats, 58% of independents, 54% of Tea Party members, and 53% of Republicans agree that supporting private charity for the poor is an extremely or very important moral guide for government policy about the economy. There are substantial differences among racial and ethnic groups. Approximately three-quarters of black (75%) and Hispanic (72%) Americans say support for private charity is an extremely or very important guide, compared to a slimmer majority (54%) of white Americans. Strong divisions also exist among religious groups. Black Protestants are most inclined to say supporting private charity for the poor is extremely or very important for guiding economic policy (74%), followed by white evangelical Protestants (65%), Catholics (63%), white mainline Protestants (52%), and religiously unaffiliated Americans (45%). Support for the value varies significantly by income level: 70% of low-income Americans (those with annual household incomes of $30,000 or less) say supporting private charity is extremely or very important, compared to less than half (49%) of high-income Americans (those with annual household incomes of $100,000 or more).
II: Religious Progressives and Religious Conservatives
Religious Orientation: A New Look at the American Religious Landscape
In addition to understanding Americans’ views on the roles of government and the economy, this study set out to investigate the existence and identity of religious progressives. In academic literature, there are many major studies of the Christian right, or religious conservatives. The PRRI/Brookings team conducted its own major survey of the Christian Right and the Tea Party movement as part of the 2010 American Values Survey. (5) However, there are few studies of the religious left or religious progressives, not least because identifying and defining this group is more methodologically challenging due to its diversity in terms of religious affiliation, racial makeup, issue agenda, (6) and geographical dispersion.
Building Blocks: Theological, Economic, and Social Orientations
In our analysis, it quickly became clear that identifying religious progressives would also be challenging due to the complex relationships between theological beliefs, opinions on social issues, and opinions on economic issues. For example, an individual can be liberal on economic issues while adopting conservative positions on social issues. Likewise, some prominent evangelical and Catholic leaders have argued that theological conservatism can be consistent with political progressivism. In order to allow for these complex relationships, we developed three independent scales for each dimension, and then combined them into a final composite scale to create a map of the American religious landscape consisting of religious progressives, religious moderates, religious conservatives, and nonreligious Americans (see Appendix 2 for details on the creation of the scales used in these sections). (7)
The Theological Orientation Scale
In order to measure theological orientation, we created a composite theological orientation scale based on three measures: holding a personal vs. impersonal view of God, holding a literal vs. non-literal view of the Bible or sacred texts, and holding a preservationist vs. adaptive view of religious tradition. These three measures were highly correlated and produced a reliable scale that worked well across religious traditions. Those who scored low on this scale were defined as theological liberals, those who scored high were defined as theological conservatives, and those in the middle were defined as theological moderates.
Using this scale, approximately 4-in-10 (38%) Americans are theological conservatives, 28% are theological moderates, and 19% are theological liberals. An additional 15% of Americans are nonreligious, defined as those who identify as atheist or agnostic, or who say religion is not important to their lives.
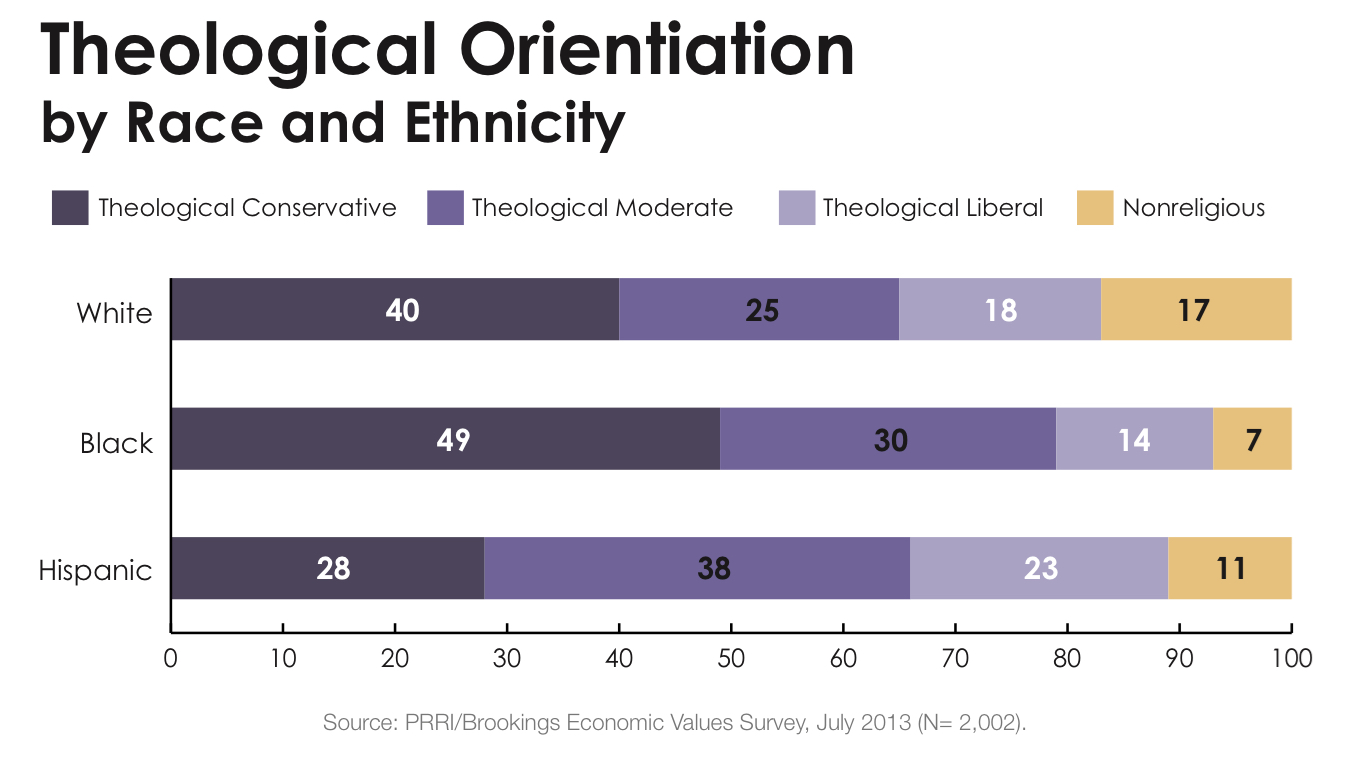
One of the most striking findings revealed by the scale is the dramatic variation in theological orientation by race and ethnicity. Overall, black Americans are significantly more likely to be theological conservatives than white or Hispanic Americans. Among white Americans, 40% are theological conservatives, 25% are theological moderates, and 18% are theological liberals. Among black Americans, nearly half (49%) are theological conservatives, 30% are theological moderates, and 14% are theological liberals. Notably, Hispanic Americans are more likely than white or black Americans to identify as theological liberals. About 3-in-10 (28%) Hispanic Americans are theological conservatives, 38% are theological moderates, and 23% are theological liberals. White Americans (17%) are more likely than black Americans (7%) or Hispanic Americans (11%) to be categorized as nonreligious.
Not surprisingly, there are significant differences in theological orientation by political affiliation, with Republicans exhibiting a significantly different profile than either independents or Democrats. Republicans (57%) are nearly twice as likely as independents (31%) or Democrats (31%) to be theological conservatives. Tea Party members have a similar theological profile to Republicans overall, as nearly 6-in-10 (59%) are theological conservatives. By contrast, about 1-in-5 independents (20%) and Democrats (21%) are theological liberals, compared to 13% of Republicans. About 1-in-5 Democrats (17%) and independents (21%) are nonreligious, about three times the number of Republicans (6%).
It is notable that the theological orientation distribution among Democrats is strongly affected by the high number of black Americans in their ranks. Among white Democrats, for example, fewer than 1-in-4 (22%) are theological conservatives, while nearly half are either theological liberals (22%) or nonreligious (26%). Black Democrats, by contrast, are twice as likely as white Democrats to be theological conservatives: 51% are theological conservatives, compared to 1-in-5 who are theological liberals (15%) or nonreligious (5%).
Generational differences are also quite pronounced. A majority (54%) of Silent Generation members are theologically conservative, compared to 3-in-10 (29%) Millennials. Millennials are much more likely to be nonreligious (22% vs. 10%), but only somewhat more likely than members of the Silent Generation to be theologically liberal (23% vs. 13%).
Among religious groups, white evangelical Protestants and black Protestants stand out as the most theologically conservative. Eight-in-ten (80%) white evangelical Protestants are theological conservatives, compared to 4% who are theological liberals. Nearly 6-in-10 (57%) black Protestants are theological conservatives, compared to 10% who are theological liberals. White mainline Protestants and Catholics are more evenly divided. Among white mainline Protestants, 36% are theological conservatives, and 25% are theological liberals. Similarly, among Catholics, 29% are theological conservatives, and 28% are theological liberals. The only religious group in which a plurality are theological liberals are non-Christian religious Americans, a group consisting of Jews, Buddhists, Hindus, Muslims, and members of other non-Christian religions. Among this group, only 7% are theological conservatives, compared to 43% who are theological liberals.
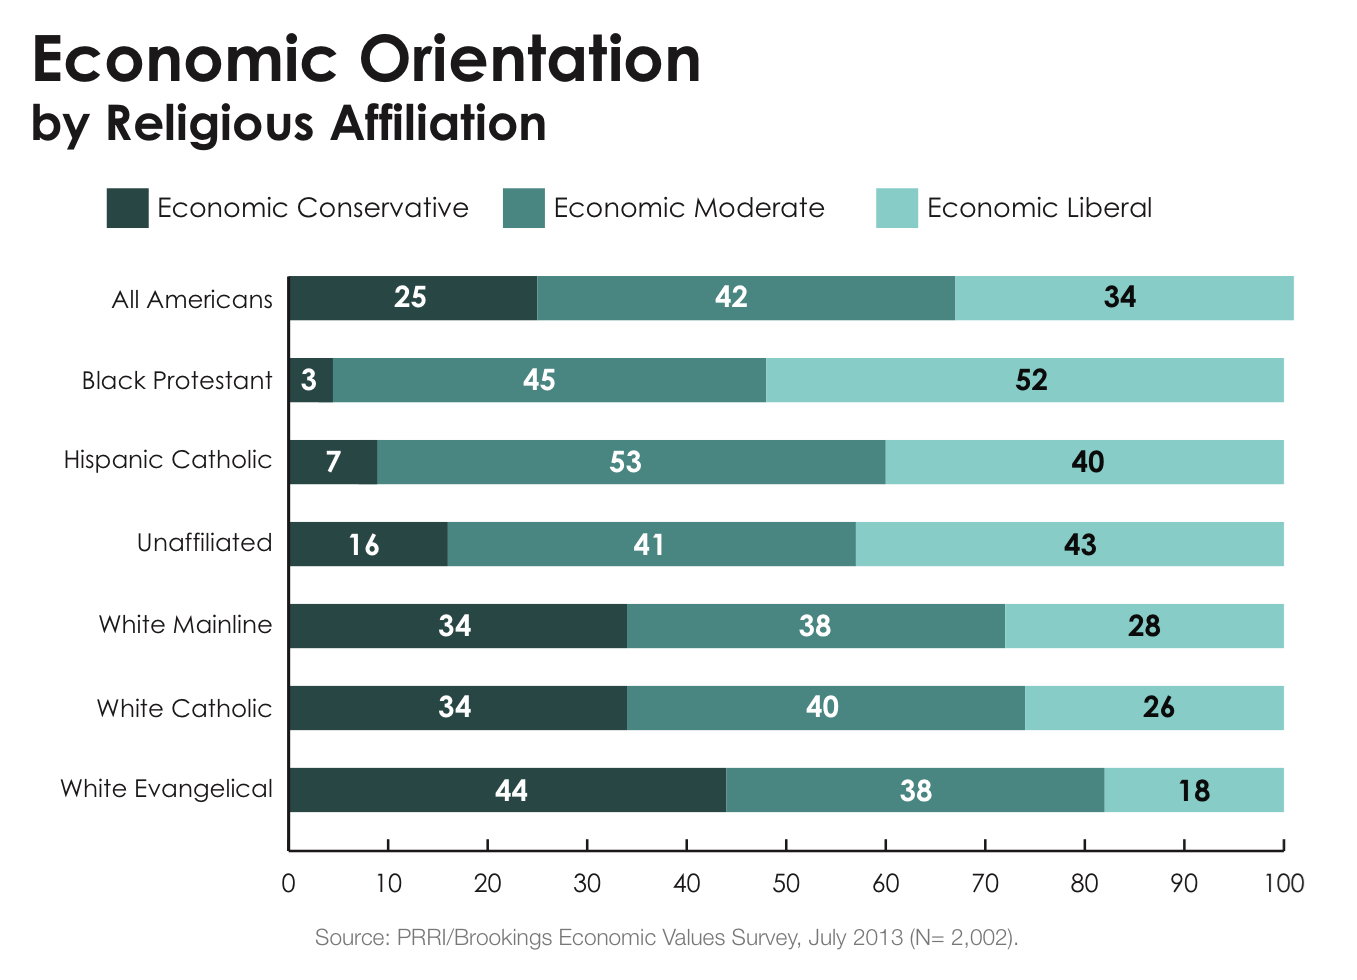
The Economic Orientation Scale
In order to assess economic orientation, we created a composite economic orientation scale based on six measures: policy opinions about increasing the minimum wage, increasing taxes on wealthy Americans, and repealing the 2010 health care law, as well as questions about equal opportunity, approaches to promoting economic growth, and preferences on the role and size of government. These measures are highly correlated and produce a reliable scale that works well across demographic groups.
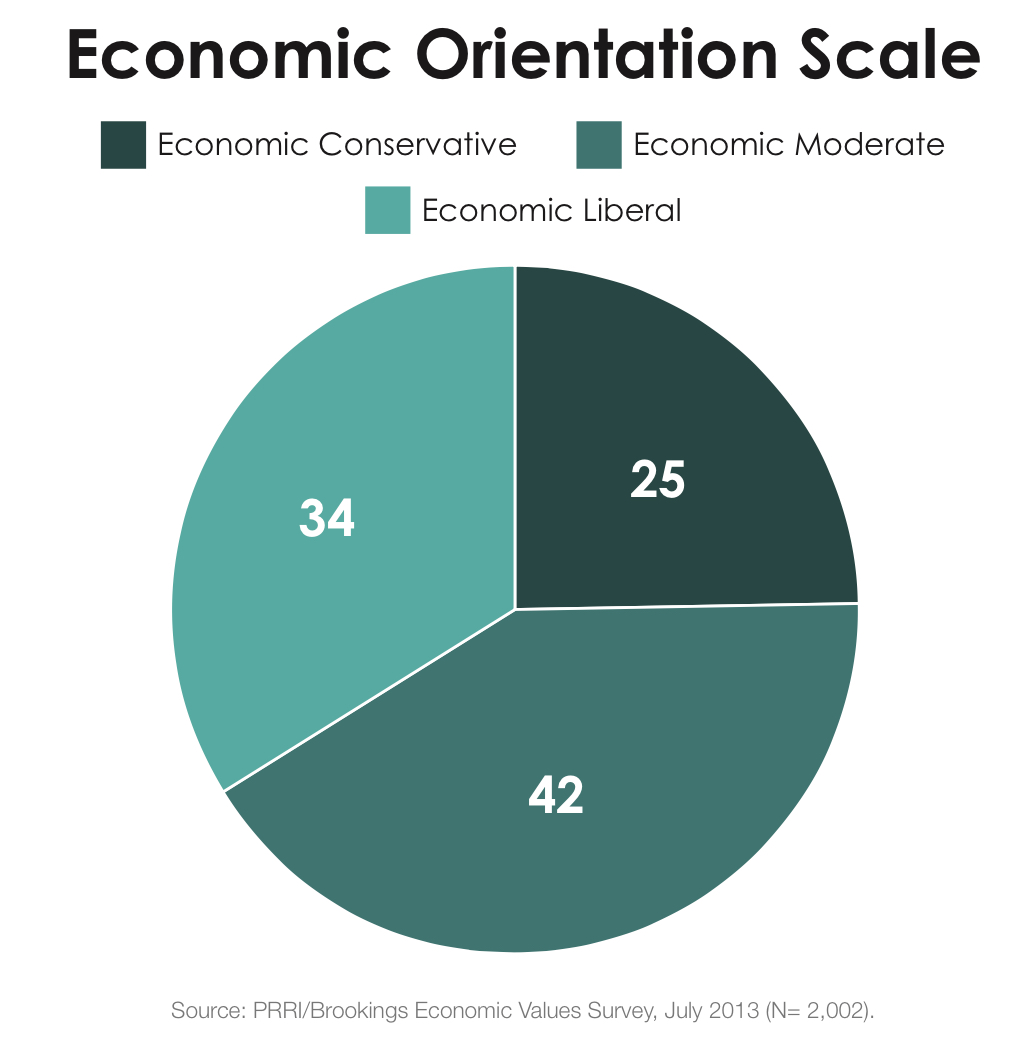
Using this scale, 25% of Americans are economic conservatives, 42% are economic moderates, and 34% are economic liberals. The economic priorities of these groups are strikingly different. When asked to identify the most important economic issue facing the country today, 41% of economic conservatives name the budget deficit, compared to only 13% of economic moderates and 5% of economic liberals. Among economic liberals, the increasing gap between the rich and the poor is the most frequently mentioned issue (26%), while 12% of economic moderates and 6% of economic conservatives identify this as America’s most pressing economic concern.
There are striking racial differences in economic orientations, particularly between white and non-white Americans. More than four times as many white Americans (34%) as black Americans (4%) and Hispanic Americans (7%) are economic conservatives. Among black Americans, half (50%) are economic liberals, compared to nearly 4-in-10 (39%) Hispanic Americans, and about 3-in-10 (28%) white Americans.
Republicans and Democrats are mirror images of one another, while independents fall in between. A majority (55%) of Republicans are economic conservatives, and only 8% are economic liberals. Tea Party members are even more likely than Republicans overall to identify as economic conservatives (63%). A majority (55%) of Democrats are economic liberals, and only 3% are economic conservatives.
Among religious groups, white evangelical Protestants are significantly more likely than any other religious group to be economic conservatives (44%). Less than 1-in-5 (18%) are economic liberals. White mainline Protestants and Catholics are more evenly divided in their economic orientations. About one-third (34%) of white mainline Protestants are economic conservatives, compared to 28% who are economic liberals. About one-quarter (24%) of Catholics are economic conservatives, compared to 32% who are economic liberals. The religious group most likely to be economically liberal is non-Christian religious Americans. Among non-Christian religious Americans, 45% are economic liberals, compared to 18% who are economic conservatives.
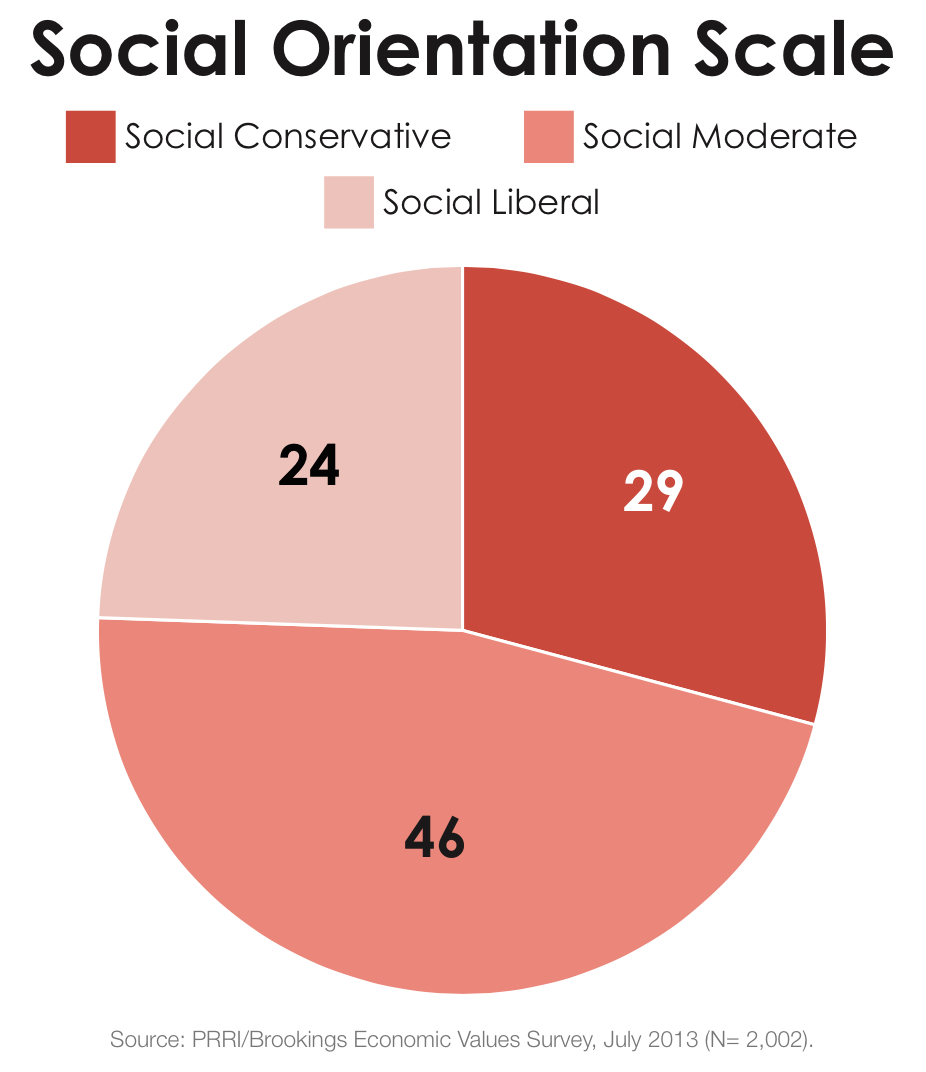
The Social Orientation Scale
In order to assess orientation on social issues, we created a composite social orientation scale based on two measures: opinions about the legality of same-sex marriage and abortion. These measures are highly correlated and produce a reliable scale that works well across demographic groups.
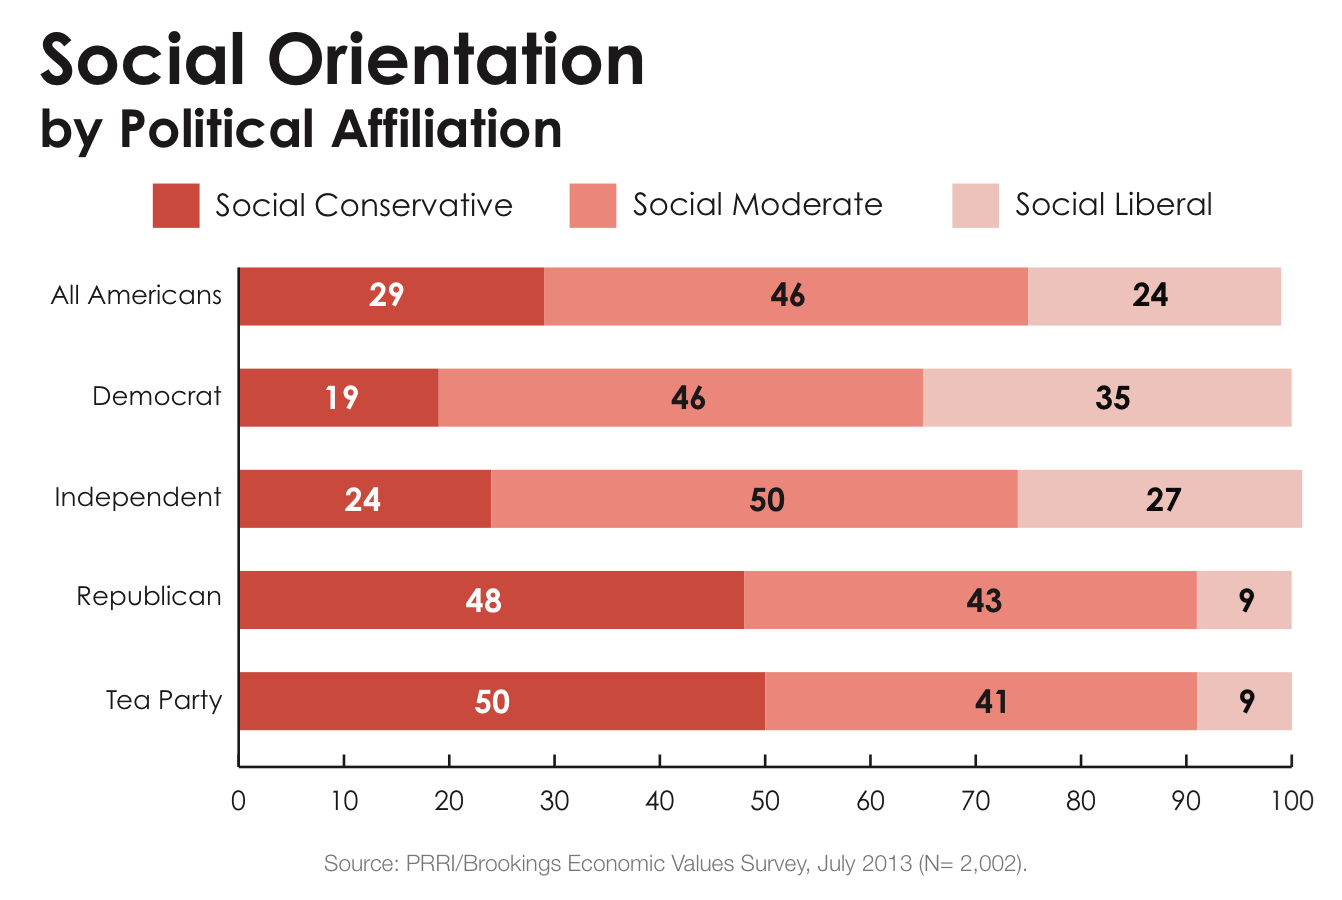
This scale identifies 29% of Americans as social conservatives, 46% as social moderates, and 24% as social liberals.
On the social orientation scale, white and black Americans have similar profiles, while Hispanic Americans are more likely to be social moderates. Approximately 3-in-10 white (31%) and black (30%) Americans are social conservatives, pluralities of each group are social moderates (44% and 46%), and about one-quarter of each group are social liberals (26% and 24%). By contrast, nearly 6-in-10 (57%) Hispanics are social moderates, while 25% are social conservatives and 18% are social liberals.
In terms of political affiliation, Republicans are more likely to be social conservatives, while independents and Democrats are more likely to be social moderates. Twice as many Republicans (48%) as Democrats (19%) or independents (24%) are social conservatives. Forty-three percent of Republicans are social moderates, and only 9% are social liberals. A plurality (46%) of Democrats are social moderates, and 35% are social liberals. Among independents, half (50%) are social moderates, 27% are social liberals and 24% are social conservatives. Those identifying with the Tea Party have a similar profile to Republicans overall: half (50%) are social conservatives, 41% are social moderates, and only 9% are social liberals. (8)
As with the theological scale, there are significant differences between white and black non-Hispanic Democrats on the social orientation scale. Among white Democrats, a plurality (46%) are social liberals, 42% are social moderates, and 12% are social conservatives. Among black Democrats, fewer are social liberals (23%), while more are social moderates (49%) and social conservatives (29%).
Among religious groups, white evangelical Protestants stand apart as the only major religious group dominated by social conservatives. Nearly two-thirds (63%) of white evangelical Protestants are social conservatives, 32% are social moderates and 5% are social liberals. Pluralities or majorities of most other major religious groups are social moderates, including 48% of black Protestants, 53% of white mainline Protestants, and 55% of Catholics. More than 1-in-5 of these groups are social liberals, including 21% of black Protestants, 24% of white mainline Protestants, and 21% of Catholics. Notably, Hispanic Catholics (67%) are more likely than white Catholics (51%) to be social moderates, and non-Christian religious Americans are the religious group most likely to be social liberals (47%).
Religious Progressives vs. Religious Conservatives
In order to evaluate the relative size and profiles of religious progressives and religious conservatives, we combined the three scales above (theological orientation, economic orientation, and social orientation) into a single scale, where each of the three individual scales carried equal weight.
Respondents who scored consistently low across all three scales were categorized as religious progressives, while respondents who scored consistently high across all three scales were categorized as religious conservatives.(9) Those with mixed scores (low on one scale and high on another), or with scores in the middle range of the scales were categorized as religious moderates.(10) As with the theological scale above, nonreligious Americans were excluded.
A Profile of Religious Progressives vs. Conservatives
According to the combined scale, 28% of Americans are religious conservatives, 38% are religious moderates, and 19% of Americans are religious progressives; additionally, 15% of Americans are nonreligious. (11) See Appendix 3 for a full profile of both religious progressives and religious conservatives.
 One common misconception should be addressed at the outset. It is often assumed that, in the American religious landscape, theological conservatives anchor one end of the spectrum and theological liberals, the other. However, due to the growth of nonreligious Americans who tend to be liberal on both social and economic issues, the opposite end of the spectrum from religious conservatives is now anchored by a combination of religious progressives and nonreligious Americans. Given this dynamic, the 9% advantage religious conservatives have in outnumbering religious progressives is muted by the additional 15% of Americans who are nonreligious and hold similar views to religious progressives across a range of issues.
Religious progressives are significantly less likely than religious conservatives to be white (60% vs. 78% respectively) and are more likely than religious conservatives to be Hispanic or mixed race.
In terms of party affiliation, religious progressives and religious conservatives are mirror images of one another. Nearly half (49%) of religious progressives identify as Democrats, while as many (49%) religious conservatives identify as Republicans. Religious conservatives are also seven times more likely than religious progressives to identify as a member of the Tea Party movement (21% vs. 3% respectively).
Religious progressives and conservatives are distributed in very different ways within the two major political parties. Among Democrats, 28% are religious progressives, 42% are religious moderates, and 13% are religious conservatives; additionally, 17% are nonreligious. Among Republicans, a majority (56%) are religious conservatives, 33% are religious moderates, 5% are religious progressives, and 6% are nonreligious. Thus, close to half of Democratic Party coalition is made up of religious progressives or the nonreligious, while about half of the Republican Party coalition is comprised of religious conservatives.
In terms of religious affiliation, the largest single group among religious progressives are Catholics, who make up nearly 3-in-10 (29%) of this coalition, followed by white mainline Protestants (19%), religious floaters who are not formally affiliated with a religious tradition but who nevertheless say religion is at least somewhat important in their lives (18%), and non-Christian religious Americans such as Jews, Buddhist, Hindus, and Muslims (13%). Notably, white evangelical Protestants constitute only 4% of religious progressives. By contrast, white evangelical Protestants constitute more than 4-in-10 (43%) of religious conservatives, followed by Catholics (17%) and white mainline Protestants (15%). Black Protestants comprise about 1-in-10 of both the religious progressive (9%) and religious conservative (8%) coalitions.
While religious progressives and conservatives hold different opinions about whether religion is the most important thing in their lives, strong majorities of both groups say that religion is at least one among many important things in their lives. While only about 1-in-10 (11%) religious progressives say religion is the most important thing in their lives, nearly 6-in-10 (59%) say it is one among many important things in their lives. Among religious conservatives, a majority (54%) say that religion is the most important thing in their lives, and 43% say it is one among many important things.
Religious progressives are significantly younger than religious conservatives. The mean age of religious progressives is 44—just under the mean age in the general population of 47—while the mean age of religious conservatives is 53. (12)The mean age of the nonreligious is 42. While Millennials comprise about one-third (34%) of the religious progressive coalition, they make up only 16% of the religious conservative coalition. Likewise, the Silent Generation constitutes only 1-in-10 (9%) religious progressives, while it constitutes roughly one-in-five (22%) religious conservatives.
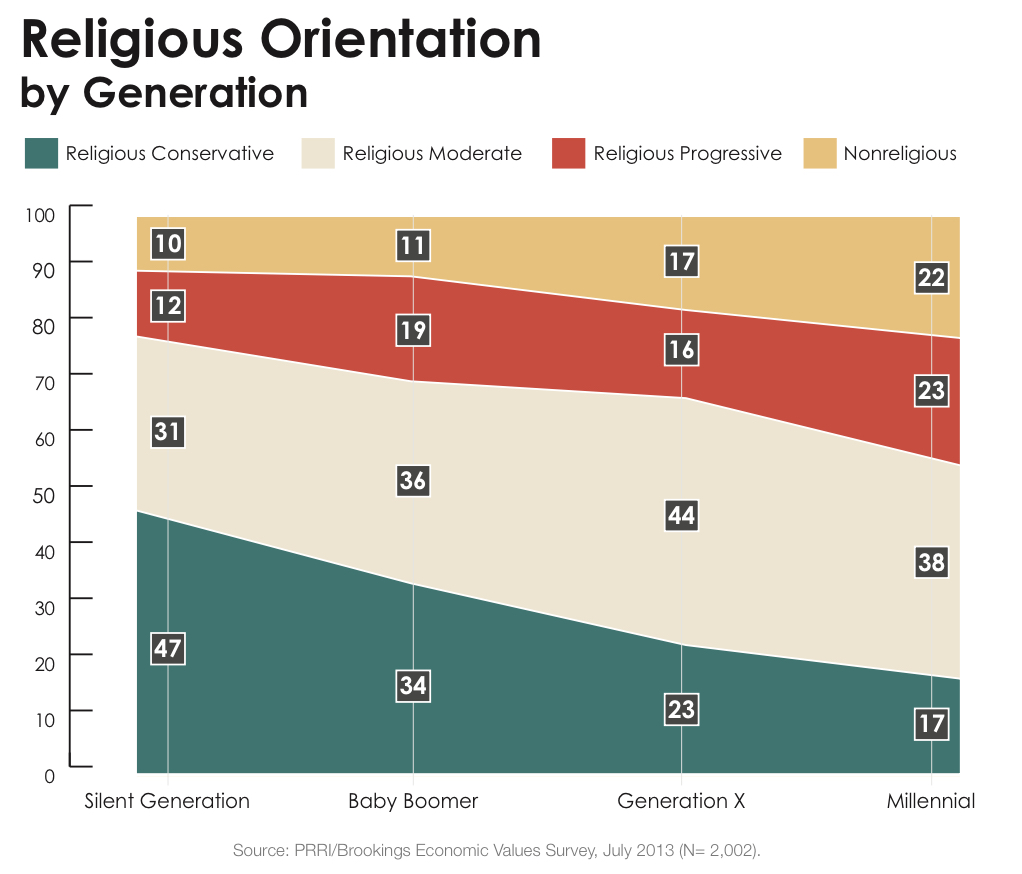
The divergent generation profiles also highlight the likelihood that religious conservatives will shrink as a proportion of the population, while religious progressives will maintain their share and the ranks of the nonreligious will grow. Religious conservatives make up smaller proportions of each successive generation, from 47% of the Silent Generation, 34% of Baby Boomers, 23% of Generation X, and 17% of Millennials. In contrast, the nonreligious make up a larger part of each generation. One-in-ten (10%) Americans who are part of the Silent Generation are nonreligious compared to more than 1-in-5 (22%) Millennials. Religious progressives also make up a much larger proportion of Millennials (23%) than the Silent Generation (12%). However, the generational shifts in the proportion of religious progressives are uneven (16% of Generation X are religious progressives compared to 19% of Baby Boomers), because growth of religious progressives among younger Americans is affected by accompanying growth of the nonreligious among these younger generations.
Religious progressives also generally have attained higher levels of education than religious conservatives. Thirty-six percent of religious progressives hold a college or post-graduate degree, compared to 22% of religious conservatives. About 3-in-10 (31%) religious progressives have a high school education or less, compared to half (50%) of religious conservatives. Religious progressives are more likely than religious conservatives to live in the Northeast (24% vs. 12%), and are less likely than religious conservatives to live in the Midwest (15% vs. 22%) and the South (36% vs. 44%). Religious progressives are also less likely than religious conservatives to live in rural communities (11% vs. 25%).
The Role of Religion and Government
Religious progressives and religious conservatives also hold different views about what being a religious person means. Nearly 8-in-10 (79%) religious progressives say being a religious person is mostly about doing the right thing, compared to 16% who say it is about holding the right beliefs. By contrast, a majority (54%) of religious conservatives say being a religious person is primarily about having the right beliefs, compared to less than 4-in-10 (38%) who say it is mostly about doing the right thing.
Religious progressives and religious conservatives also disagree about the public role of religion. Nearly 9-in-10 (87%) religious progressives agree religion is a private matter that should be kept out of public debates, compared to 11% who disagree. Religious conservatives, however, have significantly fewer misgivings on this issue and are evenly divided (49% agree, 49% disagree).
Similarly, religious progressives and religious conservatives disagree about the connections between belief in God and morality and on the degree to which social problems stem from individual actions and decisions. Nearly three-quarters (74%) of religious conservatives agree that it is necessary to believe in God in order to be moral. Only 29% of religious progressives and 12% of nonreligious Americans agree with this statement. Moreover, more than 8-in-10 (82%) religious conservatives agree that if enough people had a personal relationship with God, social problems would take care of themselves. By contrast, less than one-third (31%) of religious progressives and 18% of nonreligious Americans agree; two-thirds (68%) of religious progressives and 81% of nonreligious Americans disagree.
Economic Issues
Religious progressives and religious conservatives hold strikingly different opinions about a range of economic issues, especially related to the role of government, economic opportunity, and personal responsibility.
Religious progressives and religious conservatives have significantly different economic priorities. When asked about the most important economic issue facing the country today, the most frequently cited issue by religious progressives is the increasing gap between the rich and the poor (25%), while the most frequently cited issue by religious conservatives is the budget deficit (29%). Roughly one-quarter of both religious progressives and religious conservatives cite lack of jobs (25% and 24%) as the most pressing economic issue facing the country.
On questions related to economic policy and the role of government, religious progressives generally hold similar views to nonreligious Americans and religious moderates, while religious conservatives stand apart. For example, 37% of religious conservatives agree that the government should do more to reduce the gap between the rich and the poor, compared to 69% of religious moderates, 72% of the nonreligious, and nearly 9-in-10 (88%) religious progressives. Similarly, 26% of religious conservatives say the government should guarantee health insurance for all citizens even if it means raising taxes, compared to 59% of religious moderates, 72% of the nonreligious, and more than three-quarters (77%) of religious progressives.
On the question of capitalism’s compatibility with Christian values, religious conservatives also express views very different from religious progressives, religious moderates, and the nonreligious. Nearly half (48%) of religious conservatives say capitalism and the free market system are consistent with Christian values, compared to 41% who believe they are at odds. By contrast, 36% of religious progressives, 39% of religious moderates and 37% of the nonreligious believe capitalism is consistent with Christian values.
Religious progressives and religious conservatives hold strongly contrasting opinions about whether equal opportunity currently exists in the U.S. today. Religious conservatives are twice as likely as religious progressives to say that children from all income groups have adequate opportunities to be successful today (61% vs. 29%). On this question, nonreligious Americans hold identical opinions as religious progressives (29% agree).
Religious progressives and religious conservatives also hold different opinions about the demise of a strong work ethic and the decline of two-parent families as causes of America’s economic problems. Majorities of religious conservatives (64%) agree many people today think they can get ahead without working hard and making sacrifices, while religious progressives (48%) and the nonreligious (47%) are divided. There are sharper divisions on the question of whether family instability and the decline of two-parent families are the primary cause of America’s current economic problems. More than two-thirds (69%) of religious conservatives agree with this statement. By contrast, only 37% of religious progressives and 25% of nonreligious Americans agree.
Economic Values
Religious progressives and religious conservatives prioritize economic values in significantly different ways.
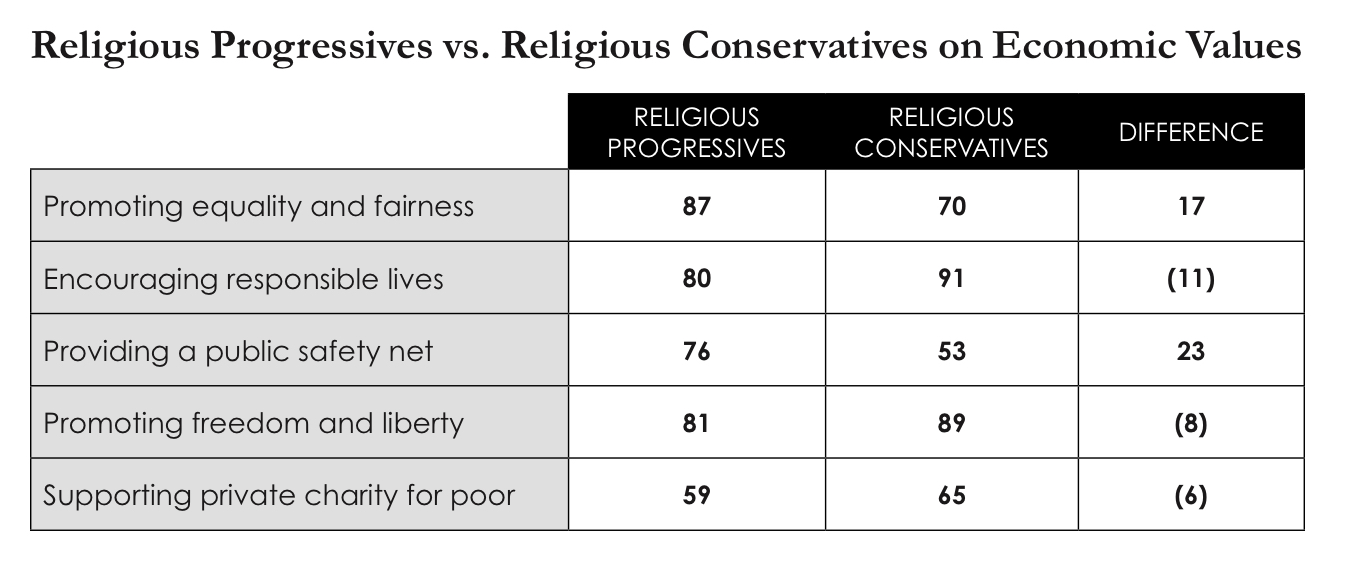
The top three values that religious progressives say are very or extremely important for guiding government policy about the economy are promoting equality and fairness (87%), encouraging people to live responsible lives (80%), and promoting freedom and liberty (81%). By contrast, the top three economic values for religious conservatives are encouraging people to live responsible lives (91%), promoting freedom and liberty (89%), and promoting equality and fairness (70%). There is a 23-point gap between religious progressives and religious conservatives on the value of providing a public safety net (76% vs. 53%); among religious conservatives, providing a public safety net was the lowest ranked value.
III: Progressive Policies, Conservative Narratives: Religious Right, Religious Left, and the Paradoxes of Economic Justice
Perspectives on Survey Findings by E.J. Dionne Jr. and William A. Galston
Introduction
In both the values they hold about economic questions and the policies they support, religious Americans are divided within as well as among themselves. There is broad agreement that the gap between rich and poor has widened in recent years and that something needs to be done about it. Strong majorities support increasing the minimum wage from the current $7.25 per hour to $10.00 per hour, and also increasing the tax rate for those earning more than $250,000 per year.
Among people of faith, there is strong support for greater economic fairness and compassion toward those in need, even for religious Americans who are quite conservative in their theological orientation and their attitudes toward social issues. Sixty-six percent of theological conservatives and 63% of social conservatives support the $10 per hour minimum wage. By margins exceeding 60%, theological and social conservatives say that the gap between rich and poor has widened over the last decade and that “promoting equality and fairness” should be an important value guiding government policy. They feel similarly about “providing a public safety net for people facing hardships.” Smaller but clear majorities believe that “it is the responsibility of the government to take care of people who can’t take care of themselves.”
Such findings would point to the potential vigor of a broad movement on behalf of social justice. Yet there are countervailing forces. Three in five Americans believe that government has become bigger because it has gotten involved in things that people should do for themselves. Half think that government is providing social services that should be left to religious groups and private charities. Only a few believe that government offers significant help to people like themselves. And although a majority supports a broad program of government activism to promote economic growth in principle, a much larger majority believes that the federal government is mostly or completely broken.
Conservative and Progressive Religious Coalitions
Politically, it is religious conservatives who have the louder voice and the greater range of political organization. Thus one of the paradoxes of American politics: while social justice commitments largely unite religious Americans, this potentially progressive constituency does not cohere to the same degree as does the religious movement on behalf of socially conservative causes. For many white theological conservatives, their strong views on social issues trump their positions on economic issues, leading them to identify with the Republican Party.
And Americans are sharply divided over what the scriptural call to look after the poor means. Respondents were asked: “In the Bible, when Jesus and the prophets talked about taking care of the poor,” were they talking primarily about “charitable acts by individuals or our obligations to create a just society”? Fifty percent believe they were talking primarily about charitable acts, while 41% feel they were talking about the imperative for a just society. There is also genuine polarization around this question: 39% feel strongly about the first statement, while 31% feel strongly about the second. Interestingly, on the matter of charity versus justice, religious Americans do not divide as sharply along theological lines as one might expect. Among theological conservatives, 58% say individual charity is at the heart of the Biblical call on behalf of the needy; among theological moderates, 44% say this, as do 49% of theological liberals.
Nonetheless, given the centrality of free-market thinking—including a strong dose of libertarianism—within the contemporary Republican Party, the survey is notable in finding that among the various brands of conservatism, economic conservatism has the weakest hold on public opinion. Overall, 38% of Americans gave answers to a variety of survey questions that defined them as theological conservatives; 29% gave answers that defined them as social conservatives; and only 25% were ranked as economic conservatives.
This points to a difficulty for the conservative movement if it seeks to weaken its commitment to social and religious conservatism while concentrating primarily on economic issues. It also points to a potential for liberals to convert social conservatives to their cause—if the emphasis of liberalism is on issues related to economic and social justice.
But matters are not that simple, because there is significantly more theological diversity among political liberals than among political conservatives. The largest share of self-identified political liberals (47%) is nonreligious, while 29% are theologically liberal, 24% are theologically moderate, and 10% are theologically conservative. Self-identified political conservatives, on the other hand, are far more homogenous theologically: 56% of them are theologically conservative while only 11% are nonreligious.
In a sense, both sides of the ideological divide face grave risks in trying to win converts. The conservative coalition could fly apart if its emphasis moves too far from social issues and religion to economics. The liberal coalition could fracture if liberals either ignore religion altogether or make strong appeals to religious voters that begin to offend the nonreligious in their ranks. Yet to build majorities, each side needs to reach out to voters whose views might make parts of their coalition uncomfortable.
Key to understanding the ways in which voters in each party do not fit neatly into established ideological patterns is the exceptional position of African Americans. On economic issues, African Americans are by far the most liberal group in the nation: 50% of them are economic liberals, compared with 39% of Hispanics and 28% of non-Hispanic white Americans. But on theological questions, African Americans are the most conservative: 49% of African Americans are theologically conservative, compared with 40% of whites and 28% of Hispanics.
On social issues, differences across racial and ethnic lines are much smaller: 31% of whites, 30% of African Americans, and 25% of Hispanics are conservative when it comes to social issues; 26% of whites, 24% of African Americans and 18% of Hispanics are socially liberal. The preponderance of all three groups is socially moderate.
Still, there are deep differences on social issues within the potential progressive coalition. For example, although there is a national majority in favor of same-sex marriage, only 45% of African Americans support it, compared to 52% of both Hispanics and non-Hispanic whites—and fully 67% of economic liberals overall. It is also true, however, that the proportion of African Americans supporting gay marriage has grown considerably, narrowing the gap between African Americans and whites. For example, the proportion of African Americans supporting same-sex unions rose from 37% in mid-2011 to 45% today, while the proportion opposing it dropped from 56% to 48% in the same period (PRRI July 2011; PRRI/Brookings 2013).
Underscoring the complexity of religion’s role in public life is the heterogeneity of the groups declaring that religion is important in their lives. Overall, 27% of Americans say that “religion is the most important thing in my life,” and an additional 45% say it is “one among many important things in my life.” The groups especially inclined to list religion as important to them include women, older Americans, the less educated, Southerners, Republicans, conservatives, white evangelicals, and those with lower incomes. Among African Americans, 49% cite religion as the most important thing in their lives, compared to 29% of Hispanics and only 23% of white Americans. In addition, 74% of African Americans think that it is necessary to believe in God in order to be moral and have good values, compared to only 52% of all Americans—and, tellingly, only 35% of liberals, 23% of religiously unaffiliated Americans, and 12% of those who regard themselves as nonreligious. On this fundamental issue, the main building blocks of a potential progressive coalition are poles apart.
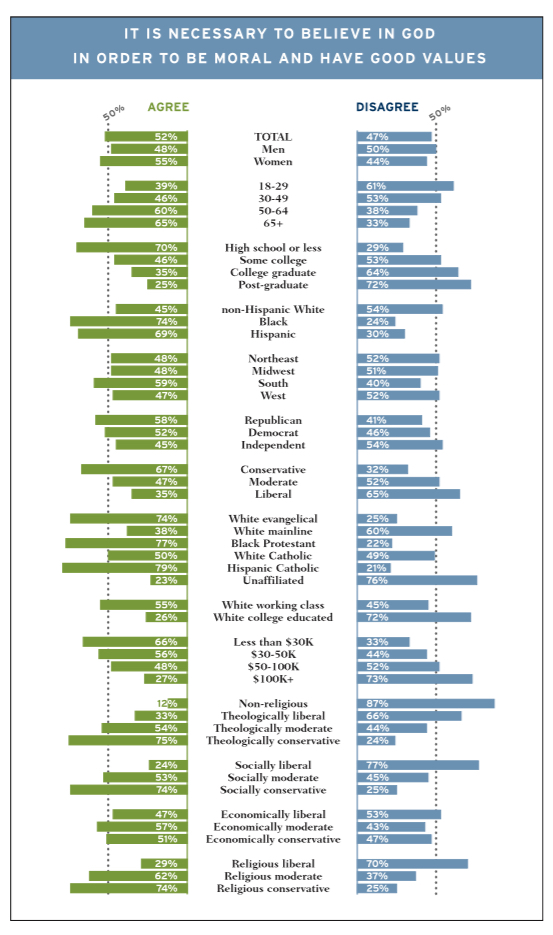
It is intriguing to map the diversity of groups for whom religion is important against the equally diverse set of groups for whom “promoting equality and fairness” is more likely to be an “extremely important” value. This is an especially significant concern for religious, social, and economic liberals alike, as well as for the white working class, lower income Americans, young adults, African Americans, the religiously unaffiliated, white Catholics, and Democrats. The presence of working class whites and white Catholics on this list hints at the idea that the 2012 drop-off in turnout among white voters may have been motivated in part by discomfort with Mitt Romney’s economic views, and perhaps also his past as a venture capitalist and his well-publicized statement about the “47 percent.”
Republicans have long expressed the hope that the strong religious feelings of African Americans might someday incline them to give the G.O.P. a larger share of their ballots. Yet the party’s difficulty in appealing to African Americans, and also to Latinos, clearly transcends issues of particular concern for these groups because both so strongly reject economic conservatism. Where 34% of whites gave answers to a variety of issue questions that ranked them as economic conservatives, only 7% of Hispanics and 4% of African Americans are economic conservatives.
Yet if Americans on the whole reject the policies of economic conservatives, many hold views on how the economy works that are consistent with conservative values. It is to this tension that we turn next.
Competing Economic Narratives
It is common to point to the polarization of our politics, and the evidence for a deep divide between red and blue, right and left, is strong. Nonetheless, it is also true that many Americans are torn within themselves, accepting certain ideas associated with liberalism and others associated with conservatism. This survey suggests that each side in our politics appeals to widely-held sentiments about the economy. While there may well be too much emphasis in our political discussions about how issues are “framed,” it is clearly the case that different ways of framing economic and social justice questions provide each side with opportunities to move opinion.
There are strong majorities on many issues that reflect progressive inclinations. Offered a list of economic issues and asked which is the most important, more Americans (26%) chose “the lack of jobs” than picked “the budget deficit” (17%). In addition, 15% chose “the increasing gap between rich and poor.” The rest picked issues with less straightforward ideological implications: the rising cost of health care (18%) or the rising cost of education (9%).
The survey also found that 73% favor increasing the minimum wage to $10 an hour, while 63% support increasing taxes on Americans earning more than $250,000 a year. These views may be partly explained by the fact that 70% of respondents say that the income gap between rich and poor has gotten larger over the last decade; only 5% say it has gotten smaller.
And when respondents were offered core liberal and conservative arguments about the best way to promote economic growth, the liberal arguments prevailed. Given a choice between two statements, 54% preferred to “spend more on education and the nation’s infrastructure, and raise taxes on wealthy individuals and businesses to pay for that spending,” while only 41% preferred to “lower taxes on individuals and businesses and pay for those tax cuts by cutting spending on some government services and programs.” In addition, 53% say that “one of the big problems in this country is that we don’t give everyone an equal chance in life,” while 39% say that “it is not really that big a problem if some people have more of a chance in life than others.” In a sense, rerunning the themes of the 2012 campaign produced rather similar results.
Yet the public strength of key liberal contentions is counter-balanced by majorities that embrace more conservative ideas. Asked if government has “become bigger over the years because it has gotten involved in things that people should do for themselves,” 59% agree; only 38% feel that government has grown “because the problems we face have become bigger.” Most Americans feel that government helps them and people like them only “a little” (56%), and an additional 26% say that government helps them and their peers “not at all.” Only 17% say people like themselves receive “a lot” of help from government.
Asked about a series of values that should guide government policies, the two that won the highest ratings were “encouraging people to live more responsible lives” (rated “extremely important” by 47%) and “promoting freedom and liberty” (45% rank this as “extremely important”). Both are congenial to conservatives, although many liberals endorse the first of these as well. “Promoting equality and fairness” came third at 39%. Two other values rank well behind: “providing a public safety net for people who are facing hardships” (26% rate this as “extremely important”) and “supporting private charity for the poor” (23% say this is “extremely important.”)
A majority is also skeptical of the work ethic of many of their fellow citizens, a theme often sounded by critics of government social programs. Asked if they agreed or disagreed with the statement, “Many people today think they can get ahead without working hard and making sacrifices,” 56% agree, while 42% disagree. The survey found that 63% of whites agree with this statement, but only 39% of African Americans and 36% of Hispanics agree. The statement won assent from 69% of Republicans, 58% of Independents and 44% of Democrats.
In the wake of the economic downturn, it is perhaps surprising that 54% say that American capitalism is working “very well” or “somewhat well,” while 42% say it is working “not too well” or “not well at all.” On the other hand, opinion clustered toward middle ground, and few Americans give the system a ringing endorsement: Only 9% of Americans think capitalism is working “very well” while 16% say it is not working well at all. A plurality of 45% see the system as working “somewhat well.”
Clearly, partisan polarization and the sharp divide in attitudes toward President Obama shape citizen’s views, even when it comes to broad assessments of their own and the country’s economic well-being. Opinions about economic conditions, for example, are heavily influenced by partisan and ideological commitments. Americans who tilt in a liberal direction and support the president think things are going better for the country, and to a lesser extent even for themselves, than do conservatives who oppose him.
And one of the more remarkable findings is a divergence between support for the general proposition that the government should “guarantee health insurance for all citizens, even if it means raising taxes” and support for Obamacare. Overall, 56% of Americans agree with a government guarantee of health coverage. But asked if they favor or oppose “repealing and eliminating the 2010 health care law,” the split was 42% in favor of repeal and 42% opposed.
Finally, there are questions that do leave the country deeply polarized. Asked if “government is providing too many social services that should be left to religious groups and private charities,” the country is divided almost evenly: 50% agree; 48% disagree. Not surprisingly, attitudes on this question fall along theological lines. Sixty-four percent of theological conservatives agree with it, but only 32% of the nonreligious do. The statement is supported by 45% of theological moderates and 42% of theological liberals.
Asked if they agree or disagree that “family instability and the decline of two-parent families is a primary cause of America’s current economic problems,” Americans break down the middle, 49% agreeing (17% completely) and 49% disagreeing (18% completely). Opinions on this question also have a clear theological loading. Among theological conservatives, 63% agree, but 72% of nonreligious Americans disagree. Theological moderates split almost evenly (48% agreeing, 50% disagreeing) while theological liberals tilt slightly toward disagreement (43% agree, 54% disagree). There is also a distinct division on this question along the social issue scale: 67% of social conservatives agree with the statement, but only 49% of social moderates and 30% of social liberals do.
The United States is often characterized as a nation whose belief system is defined by both its faith in capitalism and its strong religious commitments. So it is notable that Americans sharply divide when they are asked whether capitalism and the free-market system are “consistent” or “at odds” with Christian values. Overall, 41% see capitalism as consistent with Christian values, while 44% see the two as being at odds. It is significant that among religious respondents, there are few differences on this question across theological lines. Theological liberals split 41% to 43% in saying Christianity is at odds with capitalism, but theological conservatives do, too (43% to 46%). By narrow margins, a plurality of theological moderates and the nonreligious also say capitalism is at odds with Christian values.
This finding reinforces a central theme of the survey: qualms about social injustice affect religious respondents of all stripes, even though these concerns do not translate into automatic opposition to other values associated with conservatism.
Surprises Along the Gender Gap
The most celebrated aspect of the gender gap is the fact that women tend to vote more for Democratic candidates than men do, and are, more generally, inclined to identify with the Democratic Party. This survey provides further evidence for this. It found that 36% of women but only 28% of men identify themselves as Democrats. Among women, only 8% identify themselves as members of the Tea Party, compared with 12% of men. While 40% of men call themselves conservative, only 33% of women do.
Yet there is another, more complicated gender story. The survey found that women are more pessimistic about their own economic situation and about the overall economy than men are, care more about jobs and health care and are more supportive of an increase in the minimum wage, and place a greater emphasis on equal opportunity. They are more likely to see a contradiction between capitalism and Christianity and are less likely to think that capitalism is working well. They rank equality and fairness, providing a public safety net, and encouraging private charity higher than men do.
These findings would seem to reinforce the greater tendency of women to identify with left-of-center positions. But the survey also found that in many respects, women are more traditionally religious than men. For example, women are much more likely to see religion as the most important thing in their lives and more likely to think that “it is necessary to believe in God in order to be moral and have good values.” Women are more likely to see the Bible as the word of God and to see God as a person with whom one can have a relationship. In light of these findings, it is not surprising that women are more likely than men to be theologically conservative. Women are also more likely than men to endorse the idea that “God has granted America a special role in human history.”
The contrast between men and women is captured by their differences on the theological and economic scales. Men are more likely than women to be economic conservatives (30% of men fall into this category, compared with 20% of women). But women are more likely than men to be theological conservatives (41% of women are in this category, compared with 35% of men). Women are also less likely to be nonreligious: among men, 20% are nonreligious; among women, only 11% are.
The crisscrossing of liberal and conservative views was striking on social measures as well. Women are more likely than men to believe that “many people today think they can get ahead without working hard and making sacrifices.” Women care more about personal responsibility. And they are more likely to see family instability as a key source of economic problems. Women are also more likely than men to support same-sex marriage. Among women, 55% favor allowing gay and lesbian couples to marry legally, compared with 47% of men.
However, the survey found remarkably small differences between women and men on the abortion issue. Overall, 53% of men and 54% of women say that abortion should be legal in all or most cases. Women are slightly more inclined to believe that abortion should be legal in all cases. Among women, 21% take this view, compared with 16% of men.
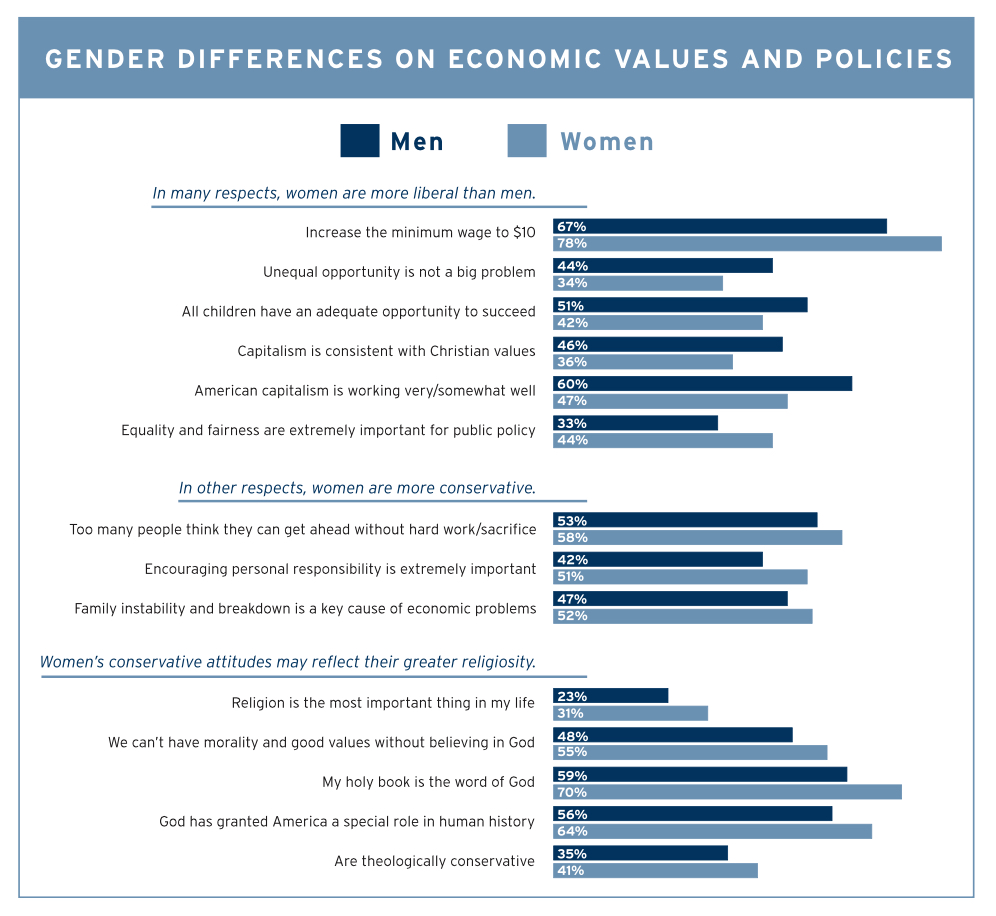
In mixing liberal leanings on economics with more conservative religious values and a blend of views on social issues, women point to the challenges facing both conventional conservatism and religious progressivism. In many respects, women seem inclined to support a religious progressive movement committed to social justice and greater equality. But such a movement would need to speak to the religious commitments of so many women, and also to their strong sense of personal and family responsibility. Conservatives, in the meantime, face obstacles to gaining support among women beyond the social issues that tend to receive more attention.
Religion, Discontent, and Hope
America is at once a very religious country and a nation that worries about religion playing too large a public role. On the one hand, 55% of Americans agree that “if enough people had a personal relationship with God, social problems would take care of themselves.” On the other hand, 72% of Americans agree that “religion is a private matter that should be kept out of public debates over social and political issues”—and 46% say they “completely agree” with this statement. These sentiments, it should be said, are not in direct contradiction. Large numbers of Americans see religion playing a large social role, but indirectly, with personal faith seen as leading to better behavior. At the same time, religious Americans hold a wide range of views that place them on what can broadly be construed as the progressive side of social justice questions.
It may be a truism, but one that is not typically acknowledged in our debates over its role: religion in America is genuinely complicated in its public impact. Faith commitments are by no means as consistently in favor of conservative causes and conservative politics as conventional discussion usually allows. Yet it remains true, as we noted at the outset, that the religious right remains a more powerful and self-conscious public force than the religious left.
When the survey asked Christian respondents if they considered themselves part of the “religious right” or the “conservative Christian movement,” 33% say they do. When respondents who said religion is important to their lives were asked if they consider themselves part of the “religious left” or the “progressive religious movement,” only 17% say they do. Just as striking, many Christian respondents placed themselves in both of these camps. When the two questions were combined, 11% of the Christians in the survey consider themselves part of both the religious progressive and religious conservative movements. Some 23% are simply religious conservatives and 7% are solely religious progressives.
The relative robustness of the identification with Christian conservatism is one indicator of its strength as a movement when compared with religious progressivism. So was combining the theological, social and economic scales. By this measure, 28% of those surveyed are religious conservatives, 19% are religious progressives, 38% are religious moderates, and 15% are nonreligious. In this case, the religious conservative advantage is narrower, but persistent. At the same time, the large number of religious Americans who are genuinely moderate (or, perhaps, torn) in their views provides another important clue about the American religious community: many in its ranks resist easy categorization.
For religious progressives, this survey points to a large constituency among Americans of faith that could be mobilized on behalf of social justice. But many members of this constituency hold moderate or conservative values that are not entirely consistent with those of the broader progressive movement. The survey also suggests that economic conservatives could lose the support of many religious conservatives who now often vote with them, depending upon how sharply lines are drawn on class and social justice issues. For the country as a whole, the survey uncovers a large challenge in the form of pessimism about the economic future. The survey found that 54% of Americans believe that “hard work and determination are no guarantee of success for most people.” Two-thirds believe the government is broken in some respects. A plurality of 47% believes their generation is worse off than their parents’ generation—and, more alarmingly, a majority believes the current generation is better off than the next generation will be.
Confidence in a better future has long defined the American Dream, and previous periods of American pessimism have always given way to the optimism at the heart of our cultural DNA. It seems reasonable to believe that in the United States today, there remains a large demand for hope. The difficulty is that few Americans see the programs now on offer as reliable roadmaps to the future they crave. The durability of both political and religious movements will depend in large part on their ability to make hope both concrete and realistic.
Endnotes
1 Throughout this report, black non-Hispanic Americans will be referred to as “black Americans” and white non-Hispanic Americans will be referred to as “white Americans” for the sake of brevity.
2 Throughout this report, the Silent Generation refers to Americans age 68 and older, including 22 respondents who are older than 88 and are part of the GI Generation.
3 Pew Research Center for the People & the Press, Political Values Survey, September 1999.
4 Murray, Charles. 2012. Coming Apart: The State of White America, 1960-2010. New York: Random House.
5 Public Religion Research Institute/Brookings Institution, American Values Survey, October 2010.
6 Olson, Laura R. 2007. “Whither the Religious Left? Religiopolitical Progressivism in Twenty-first Century America.” In From Pews to Polling Places: Faith and Politics in the American Religious Mosaic, ed. J. Matthew Wilson. Washington, DC: Georgetown University Press, 53–79. For a more thorough treatment of the methodological challenges of defining religious progressives, see Jones, Robert P. 2008. Progressive & Religious: How Christian, Jewish, Muslim, and Buddhist Leaders Are Moving Beyond Partisan Politics and Transforming American Public Life. Lanham, MD: Rowman & Littlefield.
7 As the discussion below explains, this composite approach is an improvement from previous approaches that use only theological questions. Mockabee et al. (2012) rely only on theological items including tradition-specific measures (i.e. belief in transubstantiation) to construct their definition of a religious progressive group. Mockabee, Stephen T, Kenneth D. Wald, and David C. Leege. 2012. “In Search of a Religious Left.” In Improving Public Opinion Surveys: Interdisciplinary Innovation and the American National Election Studies, eds. John H. Aldrich and Kathleen M. McGraw. Princeton, NJ: Princeton University Press, 278–98. Green also relies exclusively on theological measures and divides groups according to their self-reports of religious salience. While both of these approaches have merits, they include biases that are problematic in the identification of a religious progressive group. Green, John C. 2004. The American Religious Landscape and Political Attitudes: A Baseline for 2004. Akron, OH: Ray C. Bliss Institute.
8 Findings here about the Tea Party movement confirm earlier PRRI/Brookings findings from the 2010 American Values Survey that the Tea Party is dominated not by libertarians but by social conservatives.
9 We chose to use the term “religious progressive” for the combined scale for two reasons: 1) it is the preferred term used by many religious leaders who self-identify with this group (Jones, 2008); and 2) it helps to clarify the distinctions between the theological orientation scale, where we used “theological liberal,” and the religious orientation scale, where we used “religious progressive.”
10 We constructed the scale to allow for inexact fits between the three scales, especially due to the relatively small numbers of Americans who are ideologically consistent on the theological, economic, and social scales. For example, only 1-in-10 (10%) Americans are simultaneously theological, economic, and social conservatives. Only 8% of Americans overall are simultaneously economic and social liberals, while being either theological liberals or nonreligious.
11 As above with the theological orientation scale, Americans who identify as atheist or agnostic, or who say religion is not important to their lives, are defined as nonreligious.
12 General population numbers provided are based on the average age of survey respondents, not on the U.S. Census Bureau figures.
13 Telephone usage refers to whether respondents have only a landline telephone, only a cell phone, or both types.
Recommended citation:
Jones, Robert P., Daniel Cox, E.J. Dionne Jr., William A. Galston, and Juhem Navarro-Rivera. “Do Americans Believe Capitalism & Government Are Working?: Religious Left, Religious Right & the Future of the Economic Debate.” PRRI. 2013. http://www.prri.org/research/economic-values-survey-07-2013/.