Executive Summary
Roughly 6-in-10 voters, nationally (59%), in Ohio (59%), and in battleground states (61%), agree that the government should have acted to help the American auto industry.
Voters who supported Barack Obama are nearly unanimous (92%) in their support for the government’s action. However, nearly three-quarters (73%) of voters who supported Mitt Romney disagree, saying the government should not have acted to help the American auto industry. Voters who made their voting decision in the last week of the election are nearly twice as likely to support (59%), rather than oppose (33%), government action to help the auto industry.
Nationally, white working-class voters are divided about the government’s decision to help the auto industry: 48% favor the government’s action, while 50% are opposed. However, 60% of white working-class voters in Ohio and 61% of voters in battleground states support the decision. Among white working-class voters who support the government’s action to help the auto industry, 62% supported Obama, while 35% supported Romney.
Overall, half (50%) of voters report that they voted for Obama, while 48% say they voted for Romney. In Ohio, 46% of voters say they voted for Obama, while 45% say they voted for Romney.
Overall, few voters switched their voting preference between late September and the election. Two percent switched from Romney to Obama, while 5% switched from Obama to Romney.
Between late September and the election, however, significantly more white working-class voters switched their voting preferences. Thirteen percent of white working-class voters switched from Obama to Romney, while 2% switched from Romney to Obama.
When viewed through the lens of religion and race, the voting coalitions of Romney and Obama appear starkly different. Nearly 8-in-10 (79%) voters in Romney’s coalition are white Christians. By contrast, just over one-third (35%) of voters in Obama’s coalition are white Christians. The foundation of Romney’s base consists primarily of white evangelical Protestants, who constitute 40% of his coalition. Obama’s coalition rests on two very different groups: minority Christians—a group that includes black, Asian, Hispanic, and mixed-race Christians—(31%) and the religiously unaffiliated (25%). Notably, Obama’s religious coalition resembles the religious composition of younger voters, while Romney’s religious coalition resembles the religious composition of senior voters. For example, 26% of Millennial voters are white Christians, compared to 72% of senior voters.
In Ohio, the Obama campaign holds a significant advantage in voter contact rates among voters who are not white Christian, even though both campaigns contacted white Christian voters at comparable rates. Among Ohio voters who are not white, Obama’s contact rate was 15 points higher than Romney’s (39% vs. 24%). By contrast, nearly half (49%) of white Christian Ohio voters say they were contacted by the Romney campaign or both campaigns, while 43% say they were contacted by the Obama campaign or both campaigns.
Nationally, nearly two-thirds (65%) of white working-class voters say they voted for Romney, while one-third (33%) say they voted for Obama. By contrast, a majority (53%) of white college-educated voters say they voted for Obama, while 46% say they voted for Romney.
However, these divisions among white working-class voters vary significantly by region. White working-class voters in Ohio are nearly evenly divided between Romney (46%) and Obama (44%). By contrast, white working-class voters in the South report that they strongly supported Romney over Obama (72% vs. 25%).
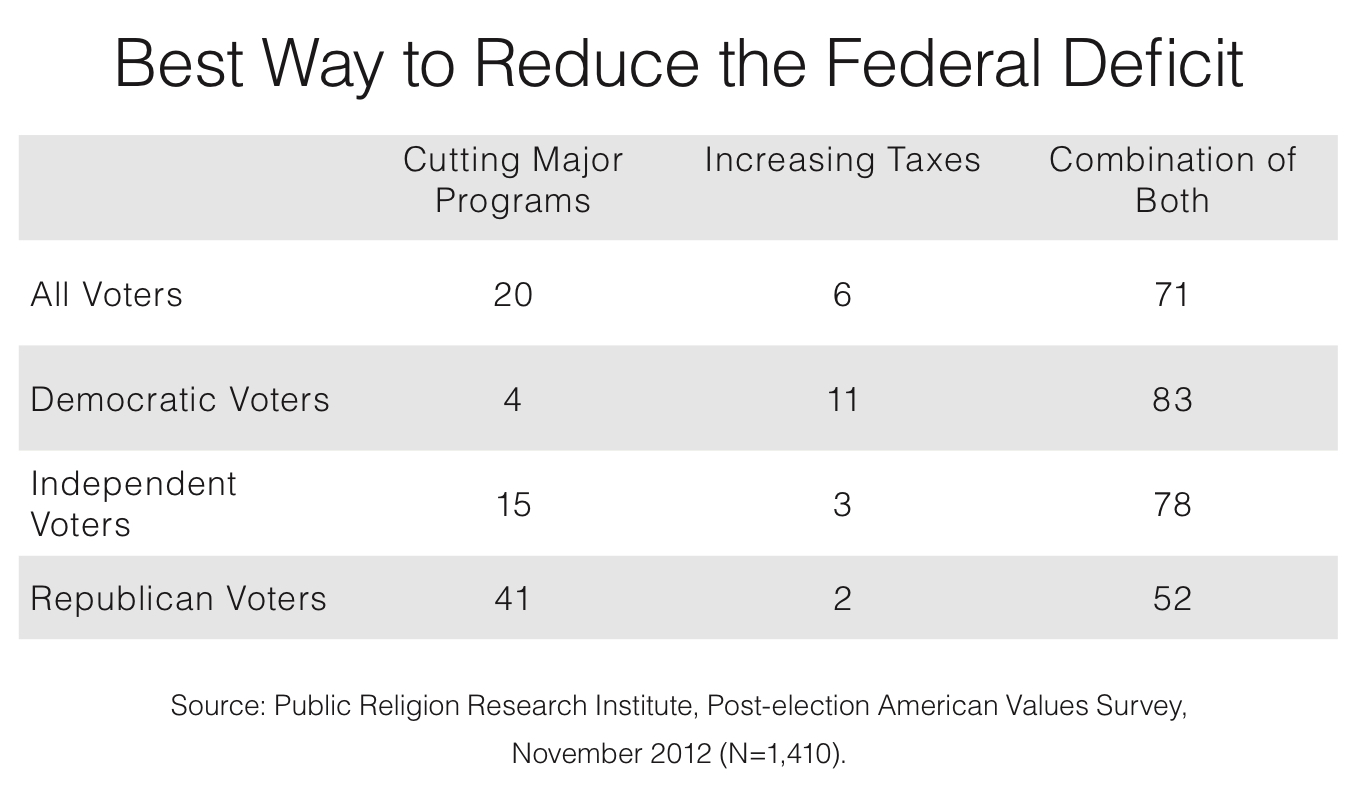
Despite political polarization on a range of issues, voters voice a strong preference for a balanced approach to reducing the federal budget deficit. One-in-five (20%) voters say we should focus mostly on cutting major programs, while less than 1-in-10 (6%) say we should focus mostly on increasing taxes. More than 7-in-10 (71%) voters say we should employ a combination of the two approaches.
Approximately 8-in-10 Democratic (83%) and independent (78%) voters believe the best way to reduce the federal budget deficit is with a balanced approach that both cuts programs and increases taxes. A slim majority (52%) of Republican voters also agree with this approach, although more than 4-in-10 (41%) believe that the government should focus only cutting major programs.
While voters, for the most part, agree on a general combined approach of cutting programs and increasing taxes, there is more disagreement on specific spending cuts.
When asked about specific cuts to federal programs to reduce the deficit, roughly two-thirds (66%) of voters overall oppose cutting federal funding for social programs that help the poor, and nearly 7-in-10 (69%) oppose cutting funding for the military.
- This agreement among all voters, however, masks significant political divides, particularly regarding social programs that help the poor. More than 8-in-10 (86%) Democratic voters and nearly 7-in-10 (68%) independent voters oppose cutting federal funding for social programs to help the poor, while only 41% of Republican voters oppose these cuts. A slim majority (53%) of Republican voters favor cutting funding for social programs that help the poor in order to reduce the federal deficit.
- At least 6-in-10 black (84%), Hispanic (75%), and white (62%) voters (62%) oppose cutting federal funding for social programs.
- There are no significant differences between white working-class voters (35%) and white college-educated voters (32%) on support for cutting programs to help the poor. However, nearly 8-in-10 (79%) white working-class voters oppose cutting funding for the military, compared to a slimmer majority (57%) of white college-educated voters.
- White evangelical Protestant voters are the only religious group that is divided over cutting federal funding for social programs that help the poor (49% favor vs. 46% oppose). Strong majorities of every other major religious group oppose these cuts. White evangelical Protestant voters are also the strongest opponents of cutting military spending, with 83% opposing these cuts.
- There is also a significant gender gap. Female voters (73%) are more likely than male voters (59%) to oppose cutting federal funding for social programs that help the poor.
Political polarization is also evident on proposals to increase taxes and eliminate tax breaks for large corporations in order to reduce the deficit. More than 6-in-10 (63%) voters favor increasing taxes on Americans making at least $250,000 per year, and a majority (55%) favor eliminating tax breaks for large corporations. There are, however, substantial divisions by party affiliation, particularly on increasing taxes for wealthy Americans.
- While nearly two-thirds (65%) of Republican voters oppose increasing taxes on Americans making at least $250,000 a year, nearly 9-in-10 (87%) Democratic voters and nearly two-thirds (66%) of independent voters favor this proposal.
- At least 6-in-10 black (68%), Hispanic (65%), and white (62%) voters favor increasing taxes on those making at least $250,000 a year.
- With the exception of white evangelical Protestant voters, at least 6-in-10 voters in every major religious group supports increasing taxes on Americans making more than $250,000 per year. White evangelical Protestant voters are divided, with half (50%) in favor and 47% opposed.
I. Looking Back at the Election
General Context: The Direction of the Country
In the week after the 2012 election, voters are almost evenly divided over whether they think things in the country are generally going in the right direction (47%), or whether things have gotten pretty seriously off on the wrong track (51%).
- Notably, the number of voters who say that things are generally going in the right direction has increased by 10 points since the pre-election American Values Survey in late September, when only 37% of voters said the country was going in the right direction. Eighty percent of voters who moved from the “wrong track” category before the election to the “right direction” category after the election identify with or lean toward the Democratic Party, and 9-in-10 (90%) voted for Obama. Nearly half (48%) are non-white, and two-thirds (65%) are under the age of 50.
- Racial and ethnic minorities are more optimistic than white voters about the country’s trajectory: nearly 9-in-10 (88%) black voters and 66% of Hispanic voters(1) say things are going in the right direction. Roughly 6-in-10 (61%) white voters say things are off on the wrong track, although opinions vary by region. For example, 68% of white voters in the South say things are off on the wrong track, compared to 58% of white voters in Ohio.
- White working-class voters (66%) are more likely than white college-educated voters (48%) to say that things have gotten off on the wrong track in the country, but here too, region matters. White working-class voters in the South (75%) are significantly more likely than white working-class voters in Ohio (56%) to say things are off on the wrong track.
- Millennial voters (age 18-29) are substantially more likely than senior voters (age 65 and older) to say things are going in the right direction in the country (63% vs. 40%). A majority (55%) of senior voters say things are off on the wrong track.
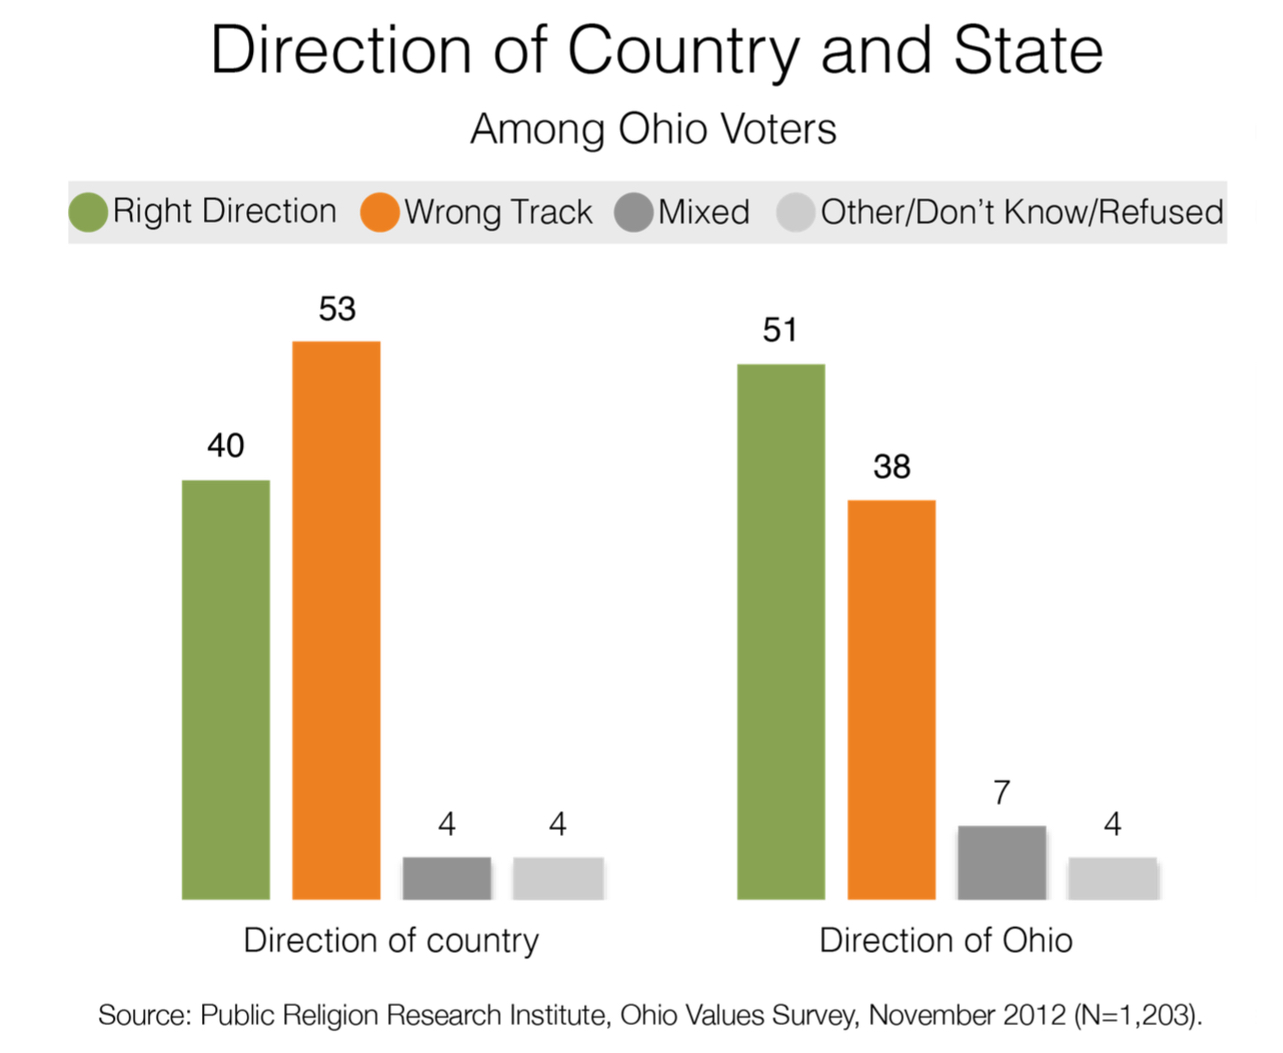
Overall, Ohio voters are more optimistic about the direction of their state than they are about the country’s direction. A majority (51%) say that things are generally going in the right direction in Ohio, while only 40% say things are going in the right direction in the country as a whole. A majority (53%) say things are off on the wrong track in the country.
The Economic Context: The Auto Bailout
Roughly 6-in-10 voters nationally (59%), in Ohio (59%), and in battleground states (61%), agree that the government should have acted to help the American auto industry.(2)
- Voters who supported Barack Obama are nearly unanimous (92%) in their support for the government’s action. However, nearly three-quarters (73%) of voters who supported Mitt Romney disagree, saying the government should not have acted to help the American auto industry.
- Voters who made their voting decision in the last week of the election are nearly twice as likely to support (59%), rather than oppose (33%), government action to help the auto industry.
- Nationally, white working-class voters are divided about the government’s decision to help the auto industry: 48% favor the government’s action, while 50% are opposed. However, 60% of white working-class voters in Ohio and 61% of voters in battleground states support the decision.
- Among white working-class voters who support the government’s action to help the auto industry, 62% supported Obama, while 35% supported Romney.
The Presidential Race
Vote Preference Overall
Overall, half (50%) of voters report that they voted for Obama, while 48% say they voted for Romney. In Ohio, 46% of voters say they voted for Obama, while 45% say they voted for Romney.
- Overall, few voters switched their voting preference between late September and the election. Two percent switched from Romney to Obama, while 5% switched from Obama to Romney.
- Between late September and the election, however, significantly more white working-class voters switched their voting preferences. Thirteen percent of white working-class voters switched from Romney to Obama, while 2% switched from Obama to Romney.
The Diminishing Influence of White Christian Voters
When viewed through the lens of religion and race, the voting coalitions of Romney and Obama appear starkly different.
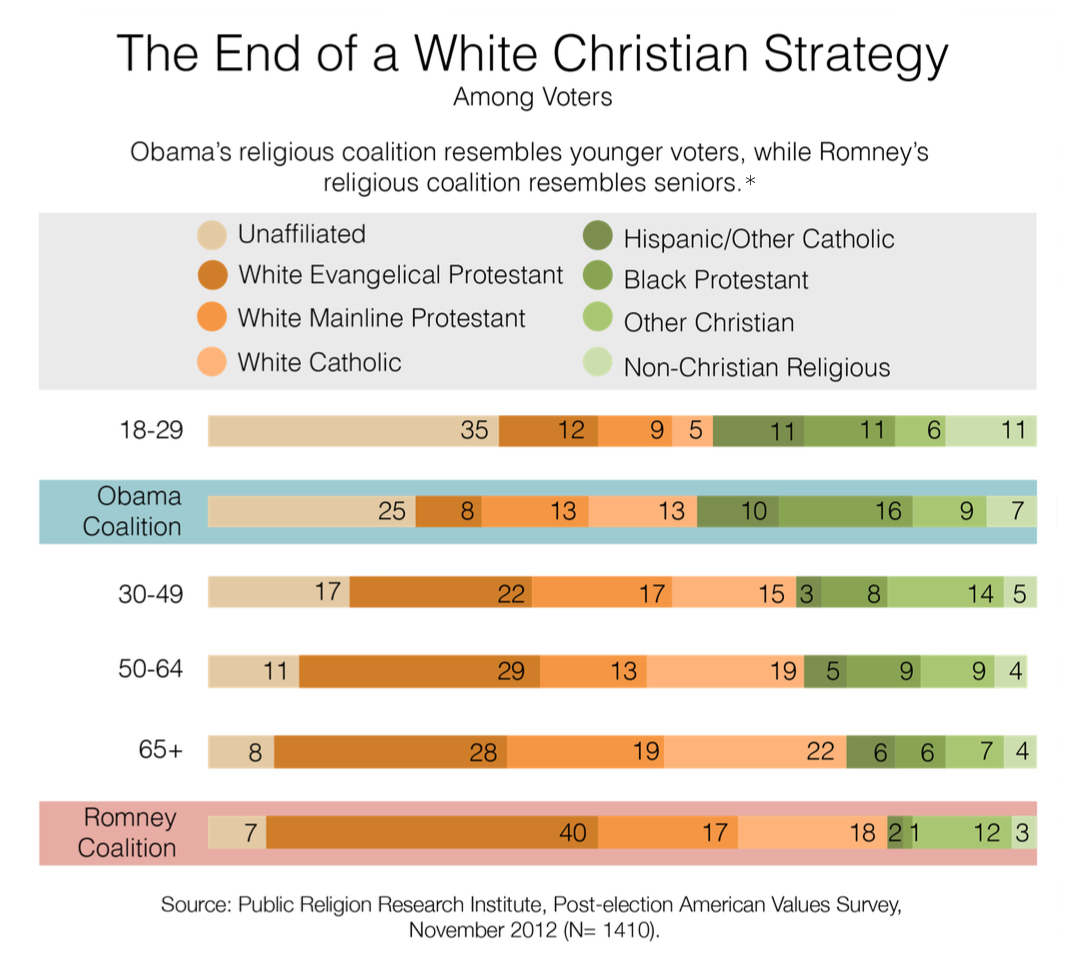
- Eight-in-ten (79%) voters in Romney’s coalition are white Christians. By contrast, just over one-third (35%) of voters in Obama’s coalition are white Christians.
- The foundation of Romney’s base consists primarily of white evangelical Protestants, who constitute 40% of his coalition. Obama’s coalition rests on two very different groups: minority Christians—a group that includes black, Asian, Hispanic, and mixed-race Christians—(16%) and the religiously unaffiliated (25%).
- Notably, Obama’s religious coalition resembles the religious composition of younger voters, while Romney’s religious coalition resembles the religious composition of senior voters. For example, 26% of Millennial voters are white Christians, compared to 70% of senior voters.
In Ohio, the Obama campaign holds a significant advantage in voter contact rates among voters who are not white Christian, even though both campaigns contacted white Christian voters at comparable rates. Among Ohio voters who are not white Christians, Obama’s contact rate was 15 points higher than Romney’s (39% vs. 24%). By contrast, nearly half (49%) of white Christian Ohio voters say they were contacted by the Romney campaign or both campaigns, while 43% say they were contacted by the Obama campaign or both campaigns.
The Battle for Suburban Voters
The two candidates divided suburban voters nearly equally between them nationwide (50% Obama vs. 48% Romney) and in battleground states (48% Obama vs. 51% Romney), while nationwide Obama led Romney among urban voters (60% vs. 38%) and trailed Romney among rural voters (33% vs. 65%).
This pattern did not, however, hold true in Ohio, largely because suburban voters in Ohio are significantly more likely to be white than suburban voters nationwide and in other battleground states. In Ohio, Obama won over Romney among urban Ohio voters (51% vs. 40%), but lost to Romney among suburban voters (38% Obama vs. 53% Romney) and rural voters (41% Obama vs. 51% Romney).
The Complexity of White Working-Class Voters
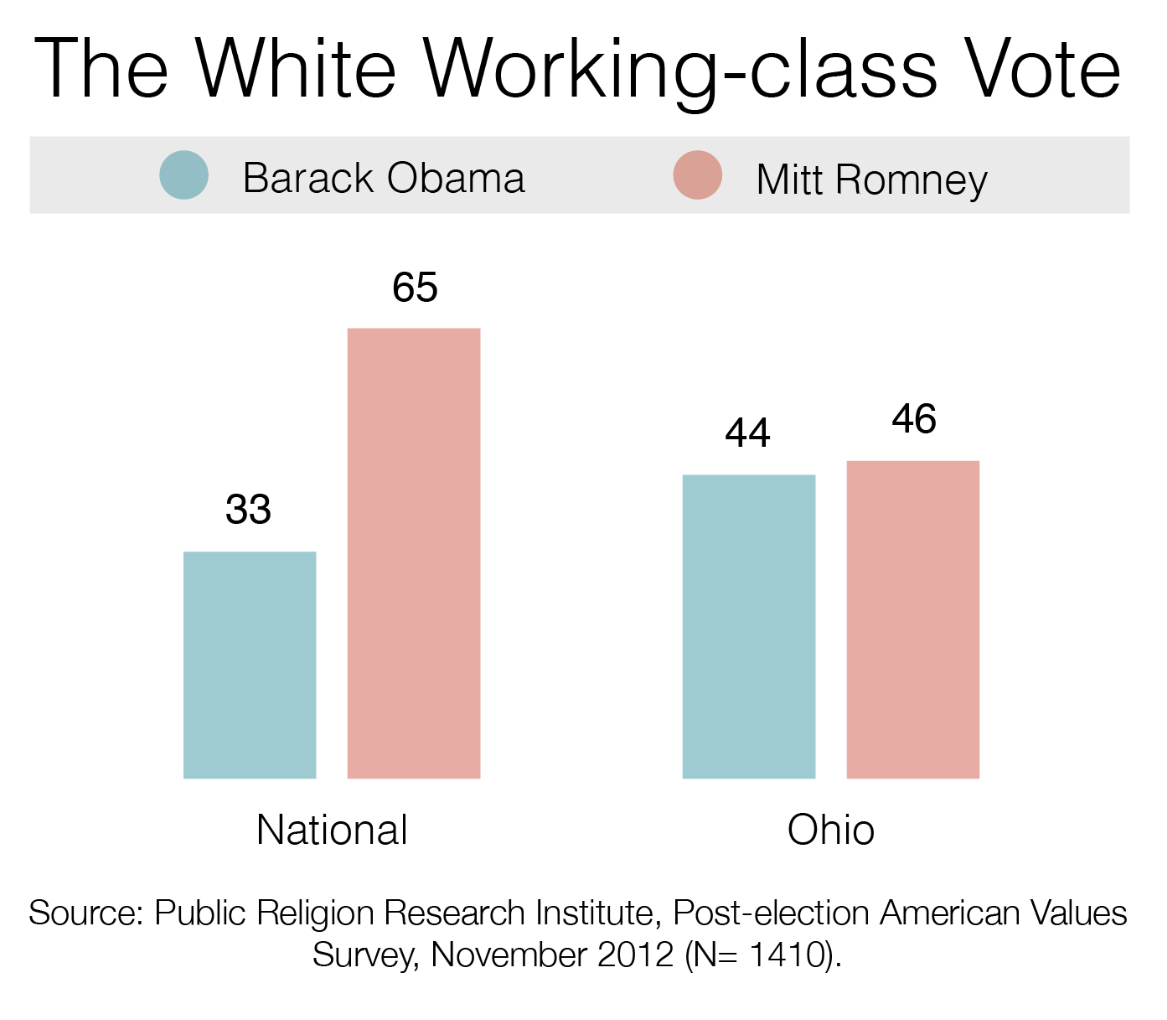 Nationally, nearly two-thirds (65%) of white working-class voters say they voted for Romney, while one-third (33%) say they voted for Obama. By contrast, a majority (53%) of white college-educated voters say they voted for Obama, while 46% say they voted for Romney.
However, these divisions among white working-class voters vary significantly by region. White working-class voters in Ohio are nearly evenly divided between Romney (46%) and Obama (44%). By contrast, white working-class voters in the South report that they strongly supported Romney over Obama (72% vs. 25%).
Timing of Voting Decision
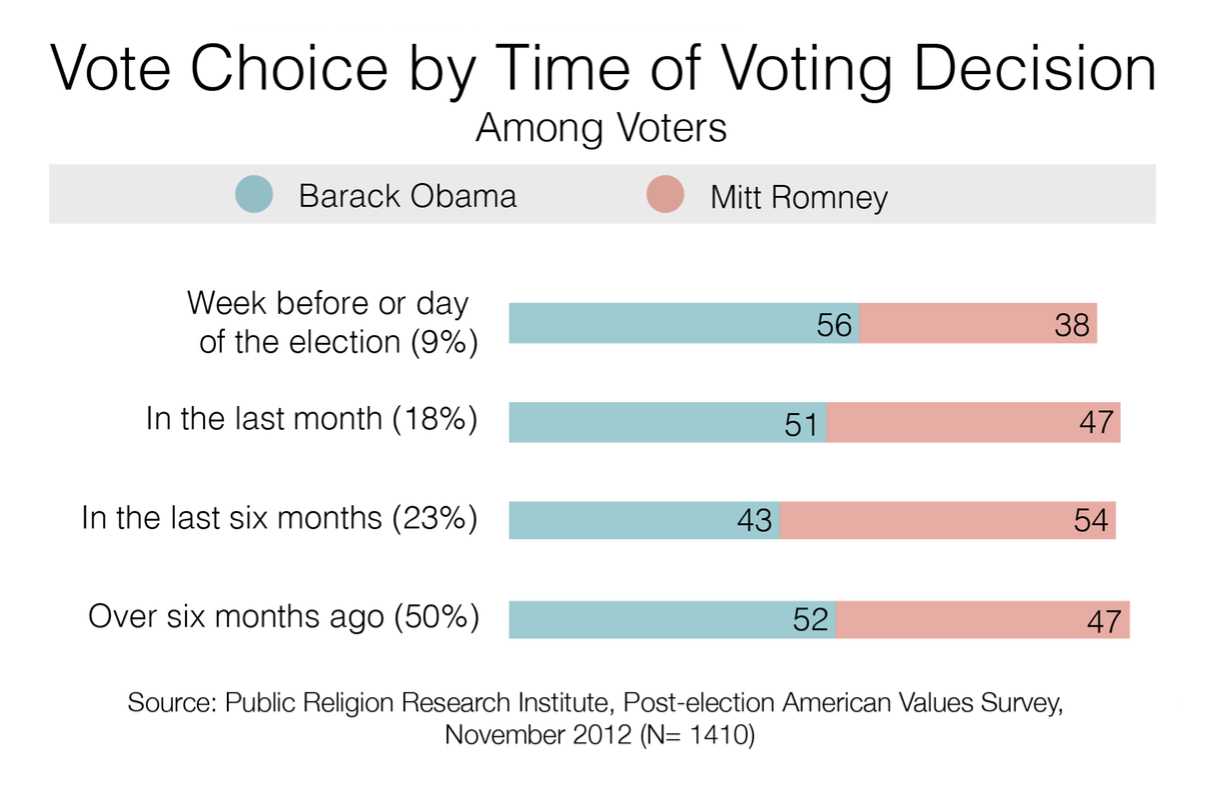
Half (50%) of voters say they decided how they would vote in the election at least six months before Election Day, while approximately 1-in-5 (18%) report making their decision sometime in the last month, and fewer than 1-in-10 say they decided the week before Election Day (5%) or on Election Day (4%).
- Roughly 8-in-10 Republican (77%) and Democratic (82%) voters report making their decision at least six months before the election. About 6-in-10 (61%) independents say they made their voting decision at least six months before Election Day, 25% say they made their decision sometime in the last month, and 14% say they made their decision within the last week or on Election Day.
- Voters who made their voting decision at least six months before Election Day are evenly divided between Obama (49%) and Romney (49%).
- Voters who made their decision during the last week of the campaign (“late deciders”) report that they strongly supported Obama over Romney (56% vs. 38%).
- A majority (52%) of late deciders say the debates between the presidential candidates were very important in helping to make up their mind, compared to 30% of other voters.
- More than one-third (35%) of late deciders say campaign commercials were important for their decision, while 18% of other voters say the same.
- White evangelical Protestant voters are more likely than other religious groups to have made up their minds well before the election took place. A majority (53%) of white evangelical Protestant voters say they had made up their minds more than six months before the election; only one-quarter of white evangelical Protestant voters report that they made up their minds in the final month (15%), week (6%), or day (4%) of the campaign.
Factors Influencing Voting Decisions
Factors in Resolving Voting Decisions for Undecided Voters
Voters who say they were undecided about their vote at any point in the campaign cite a wide range of reasons for their ultimate decision. About half point to specific issues: nearly one-quarter (23%) give a reason related to the economy, while an additional 15% cite other issues, such as healthcare, education, and foreign policy, and 11% cite social issues or women’s issues. Approximately 1-in-5 name either negative views of Obama and the Democrats (11%) or negative views of Romney and the Republicans (10%). About 1-in-10 mention positive views of Obama and the Democrats (7%) or Romney and the Republicans (4%). Five percent say that they disliked both parties and candidates, or express frustration with the political process as a whole.
Debates, Commercials, Social Media
Voters report that the presidential debates were far more influential for their voting decision than campaign commercials or social media. Nearly two-thirds (64%) of voters say the debates were somewhat or very important in helping them make up their mind, while less than 1-in-5 (19%) say campaign commercials were somewhat or very important, and only 14% say things they read or saw on Facebook were somewhat or very important.
- Millennial voters are more likely than senior voters to say the debates between the two presidential candidates were somewhat or very important for their decision (76% vs. 55%).
- Interestingly, Millennial voters are more likely than seniors to say that Facebook was not at all important for their vote (63% vs. 46%).
Contact by the Campaigns
Only around one-third (32%) of voters report that they were contacted by at least one of the major presidential campaigns, with 17% saying they were contacted by both campaigns, 8% saying they were only contacted by the Obama campaign, and 7% saying they were only contacted by the Romney campaign. Nearly two-thirds (66%) of voters say they were not contacted by either major presidential campaign.
- Senior voters (age 65 and older) are substantially more likely than Millennial voters (age 18-29) to say they were contacted only by the Romney campaign (14% vs. 2%). Millennial voters are more likely than senior voters to say they were not contacted by either campaign (78% vs. 52%). The same pattern holds true in Ohio.
- Female voters are somewhat more likely than male voters to say they were contacted by the Obama campaign (11% vs. 5%).
A majority (51%) of Ohio voters report that they were contacted by at least one of the major party campaigns, with 30% reporting they were contacted by both campaigns, while approximately 1-in-5 say they were contacted only by the Obama campaign (11%) or the Romney campaign (10%). Less than half (46%) of Ohio voters say they were not contacted by either campaign.
- Among Ohio voters contacted only by the Obama campaign, 77% voted for Obama and 19% voted for Romney. Among Ohio voters contacted only by the Romney campaign, 14% voted for Obama and 84% voted for Romney. Among voters contacted by both campaigns, 39% voted for Obama and 49% voted for Romney. And among those not contacted by either campaign, 39% voted for Romney and 51% voted for Obama.
Feelings About and Perceptions of the Candidates
Voting For or Against a Candidate
Three-quarters (76%) of Obama voters say that their vote was primarily a vote for Obama, while 13% say their vote was primarily a vote against Romney, and 11% say it was both. Among Romney voters, a slim majority (52%) say their vote was a vote for Romney, while nearly 4-in-10 (37%) say their vote was a vote against Obama, and 1-in-10 (10%) say it was both.
- There is a similar pattern among independent voters. Among independent voters who voted for Romney, 48% report that they voted for Romney, while 39% say they voted against Obama. Of those independent voters who supported Obama, 70% report that they voted for Obama and 22% say they voted against Romney.
- Obama holds a distinct advantage among voters in all major religious groups on the question of whether the votes he received were a positive vote for him or a vote against his opponent. Notably, less than half (48%) of white evangelical Protestant voters said their vote for Romney was a positive vote for the candidate, while more than 4-in-10 (41%) characterized their vote as a vote against Obama.
- Similarly, Tea Party voters are nearly evenly divided on whether their vote for Romney was a vote for Romney (44%) or a vote against Obama (42%).
Qualities of the Candidates
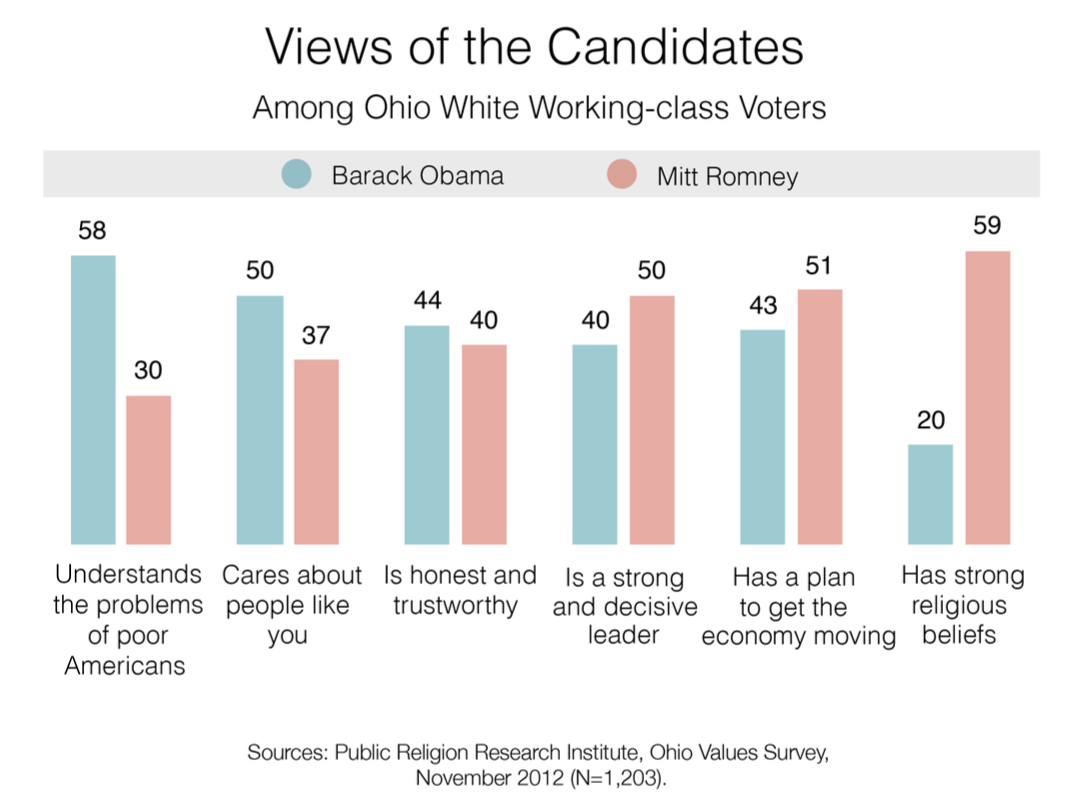
When asked about various qualities that describe the candidates, Obama has an advantage over Romney in perceptions of empathy and leadership, while the candidates are tied on several leadership traits. More than 6-in-10 (61%) voters say that “understands the problems of poor Americans” better describes Obama, while 30% say it better describes Romney. Slimmer majorities of voters agree that Obama, rather than Romney, cares about people like them (53% vs. 41%), and is a strong and decisive leader (51% vs. 44%). Obama is slightly more likely than Romney to be considered honest and trustworthy (48% vs. 41%). Voters are divided on whether Obama or Romney had a better plan to get the economy moving (47% vs. 48%). By contrast, more than two-thirds (66%) of voters agree that Romney, rather than Obama (21%), possesses strong religious beliefs.
- White working-class voters are one of the few groups in which a majority do not say Obama better understands the problems of poor Americans, compared to Romney (45% vs. 44%).
- However, there are significant regional differences: nearly 6-in-10 (58%) white working-class voters in Ohio agree that Obama better understands the problems of poor Americans, while only 38% of white working-class voters in the South say the same.
- With the exception of black Protestant voters, strong majorities of voters in every major religious group agree that the phrase “has strong religious beliefs” better describes Romney than Obama.
Relative Ideology of the Candidates
Roughly 6-in-10 voters identify Romney as conservative (39%) or very conservative (19%), and Obama as liberal (26%) or very liberal (35%). About one-quarter (26%) of voters describe each candidate as moderate.
- Being viewed as very conservative or very liberal is a disadvantage for both candidates. Only 29% of voters who say Romney is very conservative hold a favorable view of him, while only 14% who view Obama as very liberal hold favorable views of him.
- More than 4-in-10 white evangelical Protestant voters characterize Romney as moderate (37%) or liberal (4%). White evangelical Protestant voters, 65% of whom identify as conservative or very conservative, are more likely than any other religious group to characterize Romney as a moderate.
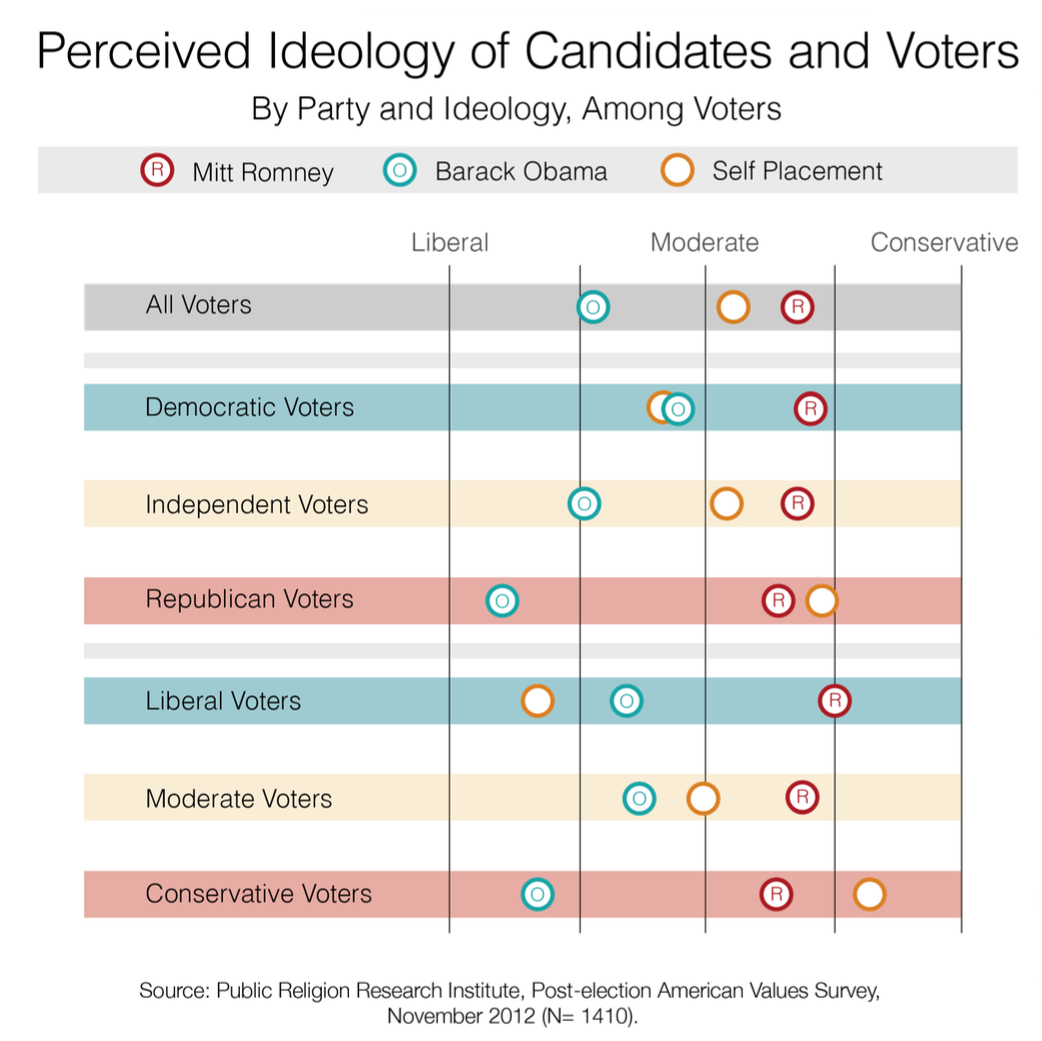
There are several noteworthy patterns in how different groups of voters view the two candidates’ ideologies on a scale of 1 to 5, where 1 is very liberal and 5 is very conservative.
- Overall, voters identify themselves ideologically as moderate (3.2 average score). They also report that Romney’s political views are somewhat more conservative than their own (3.7), while Obama’s views are significantly more liberal than their own (2.2).
- Across political and ideological groups, Romney is viewed much more consistently as a moderate-leaning conservative, while perceptions of Obama differ dramatically by group.
- Democratic voters view Obama’s political views as similar to their own—closer to moderate than liberal (2.8 average score). Republican voters, by contrast, perceive Obama as very liberal (1.5 average score).
- Independent voters mirror the general public’s perceptions of the two candidates’ ideologies.
- Liberal voters perceive Obama to be significantly less liberal than they see themselves, while conservative voters perceive Romney to be less conservative than they see themselves.
Reactions to Election Results
Voters exhibit a wide range of emotions in reacting to the outcome of the election. A slim majority of voters report that they are satisfied (29%) or excited (22%), while roughly 1-in-5 (21%) say they are disappointed, and nearly 3-in-10 say they are worried (25%) or angry (2%).
- Nearly all voters who supported Barack Obama say they are satisfied (52%) or excited (44%) about the outcome of the election. By contrast, nearly all Mitt Romney voters say they are worried (47%), disappointed (43%), or angry (5%).
- Black (41%) and Hispanic (42%) voters more likely to say they feel satisfied with the election results, compared to white voters (24%). A majority (55%) of black voters say they feel excited, compared to 27% of Hispanic voters and 17% of white voters.
Political Homogeneity and Difference in Households and Churches
Split-ticket Households
Four percent of married voters with a spouse or partner report that they live in split-ticket households, with a spouse voting for a different candidate, while 74% of married couples share candidate preferences. One-in-five married voters say their spouse didn’t vote (11%) or report that they do not know for whom their spouse voted (10%).
Married men who voted for Romney are less likely than other married voters to say their spouse shares their candidate preference:
- Married men who voted for Romney (69%) are less likely than married women who voted for Romney (83%) to say that their spouse shares their candidate preference.
- Married men who voted for Obama (73%) are, by contrast, equally as likely as married women who voted for Obama (76%) to say that their spouse shares their candidate preference.
Churches and Political Homogeneity
Two-thirds (67%) of voters who attend church at least a few times a year attend a congregation where they believe most other members share their candidate preferences, while 12% attend a congregation where they believe most other congregants supported a different candidate. Four percent say people in their congregation were divided in their voting preferences, while 16% say they do not know.
Romney voters are significantly more likely than Obama voters to attend politically homogeneous congregations.
- Among Romney voters, 74% report attending congregations that mostly supported Romney, compared to 7% who say their congregation mostly supported Obama, and 5% who attend a mixed congregation, while 14% say they did not know.
- Among Obama voters, 61% report attending congregations that mostly supported Obama, compared to 18% who say their congregation mostly supported Romney, and 2% who attend a mixed congregation, while 18% say they did not know.
There is some variation in political homogeneity among religious groups:
- Nearly 8-in-10 (78%) white evangelical Protestant voters report that most people at their church voted for Romney. Only 7% say that most people at their church supported Obama.
- White mainline Protestant voters are more likely to report that a majority of people in their congregation supported Romney (46%), rather than Obama (25%).
- More than 4-in-10 (43%) Catholic voters report that most people in their congregation supported Romney, while 33% report that people in their congregation primarily supported Obama.
- Minority Christian voters are more likely to report that a majority of people in their congregation supported Obama (67%), rather than Romney (22%).
A Look at Nonvoters and Potential Impact on Elections
One of the advantages that the American Values Survey has over stand-alone post-election polls is that it is part of a panel study consisting of a large pre-election survey conducted at the end of September 2012, coupled with a call-back post-election survey. Because of this research design, the surveys are able to measure the effect that non-voters, who noted a preference for the candidates in the pre-election survey, would have had on the election if they had voted.
In the post-election call back survey, 88% of respondents report that they voted in the presidential election, and 12% report that they did not vote.(3) The race was considerably closer among voters (50% Obama vs. 48% Romney) than it would have been if nonvoters had turned out on Election Day. In the pre-election survey, nonvoters reported supporting Obama over Romney by a 28-point margin (59% vs. 31%). Had those nonvoters showed up on Election Day, Obama’s lead would have increased from 50% to 52%.
Nonvoters are more likely than voters to be non-white (52% vs. 29%), to be under the age of 50 (84% vs. 49%), to lack any college education (69% vs. 36%), to live in households making under $30,000 per year (46% vs. 24%), to classify themselves as working class or lower class (67% vs. 39%), and to be religiously unaffiliated (26% vs. 16%). Compared to voters, nonvoters are roughly equally distributed across regions of the country and are generally equally as likely as voters to live in battleground states.
II. Looking Ahead to the “Fiscal Cliff” and Debates Over the Budget Deficit
The Current Context: Assumptions About Economic Problems and Taxes
What’s Responsible for Current Economic Problems?
Voters do not agree that any single thing is responsible for the current economic crisis, and majorities place some—though not equal—responsibility with both corporations and government, and with the policies of both George W. Bush and Barack Obama. More voters blame corporations moving jobs overseas (74%) than excessive government regulation (64%) and more blame the policies of George W. Bush (70%) than the policies of Barack Obama (62%).
- Partisan voters, not surprisingly, see the responsibility for the economic crisis through red and blue lenses. Nearly 8-in-10 (78%) Republican voters blame Obama’s economic policies for the economic problems in the country today, while 56% say Bush’s policies are to blame. By contrast, more than 8-in-10 (85%) Democratic voters blame Bush’s policies for the country’s current economic problems, while more than 4-in-10 (43%) blame Obama’s policies. Independent voters blame both Bush’s policies (67%) and Obama’s policies (65%) equally.
- White evangelical Protestant voters are the only religious group in which significantly more say the economic policies of Obama rather than the economic policies of Bush are somewhat or very responsible for the current economic crisis (75% vs. 66%).
Who’s Paying the Right Amount in Taxes?
A majority (52%) of voters agree that people with household incomes of more than $250,000 a year pay too little in taxes. Approximately 3-in-10 (29%) say they pay the right amount, and roughly 1-in-10 (12%) say they pay too much.
- Democratic voters (77%) and independent voters (51%) are more likely than Republican voters (24%) to say that people making more than $250,000 per year are paying too little in taxes. A plurality (45%) of Republican voters say that these people are paying the right amount.
- Black voters (62%) more likely than white voters (51%) to say that people with household incomes of more than $250,000 per year pay too little in taxes.
- Half (50%) of white working-class voters say that people with household incomes exceeding $250,000 per year pay too little in taxes.

Voters are more divided on whether people who have household incomes of less than $30,000 per year pay the appropriate amount in taxes: a plurality (44%) say they pay too much, while 38% say they pay the right amount, and 10% say they pay too little.
- A majority (52%) of Democratic voters and a plurality (45%) of independent voters say that people who have household incomes of less than $30,000 per year pay too much, compared to only 33% of Republican voters. A plurality (41%) of Republican voters say people with household incomes of less than $30,000 per year are paying the right amount in taxes.
- Black voters (61%) also more likely than white voters (41%) to say that people living in households making less than $30,000 per year pay too much in taxes.
- Nationally, white working-class voters (47%) are more likely than white college-educated voters (31%) to say that people with household incomes of less than $30,000 per year pay too much in taxes.
Nearly half (49%) of all voters say people like them pay the right amount in taxes, while 42% say they pay too much, and less than 1-in-10 (7%) say they pay too little.
- Roughly half of Republican voters (46%), independent voters (52%), and Democratic voters (50%) say that people like them pay about the right amount in taxes. Republican voters (49%) are more likely than independent (40%) and Democratic (37%) voters to report that they pay too much in taxes.
Political Polarization on the Role of Government
Government’s Role in Reducing Inequality and Providing Social Services
Voters are strongly divided by party affiliation on the role government should play in reducing social inequality and providing social services.
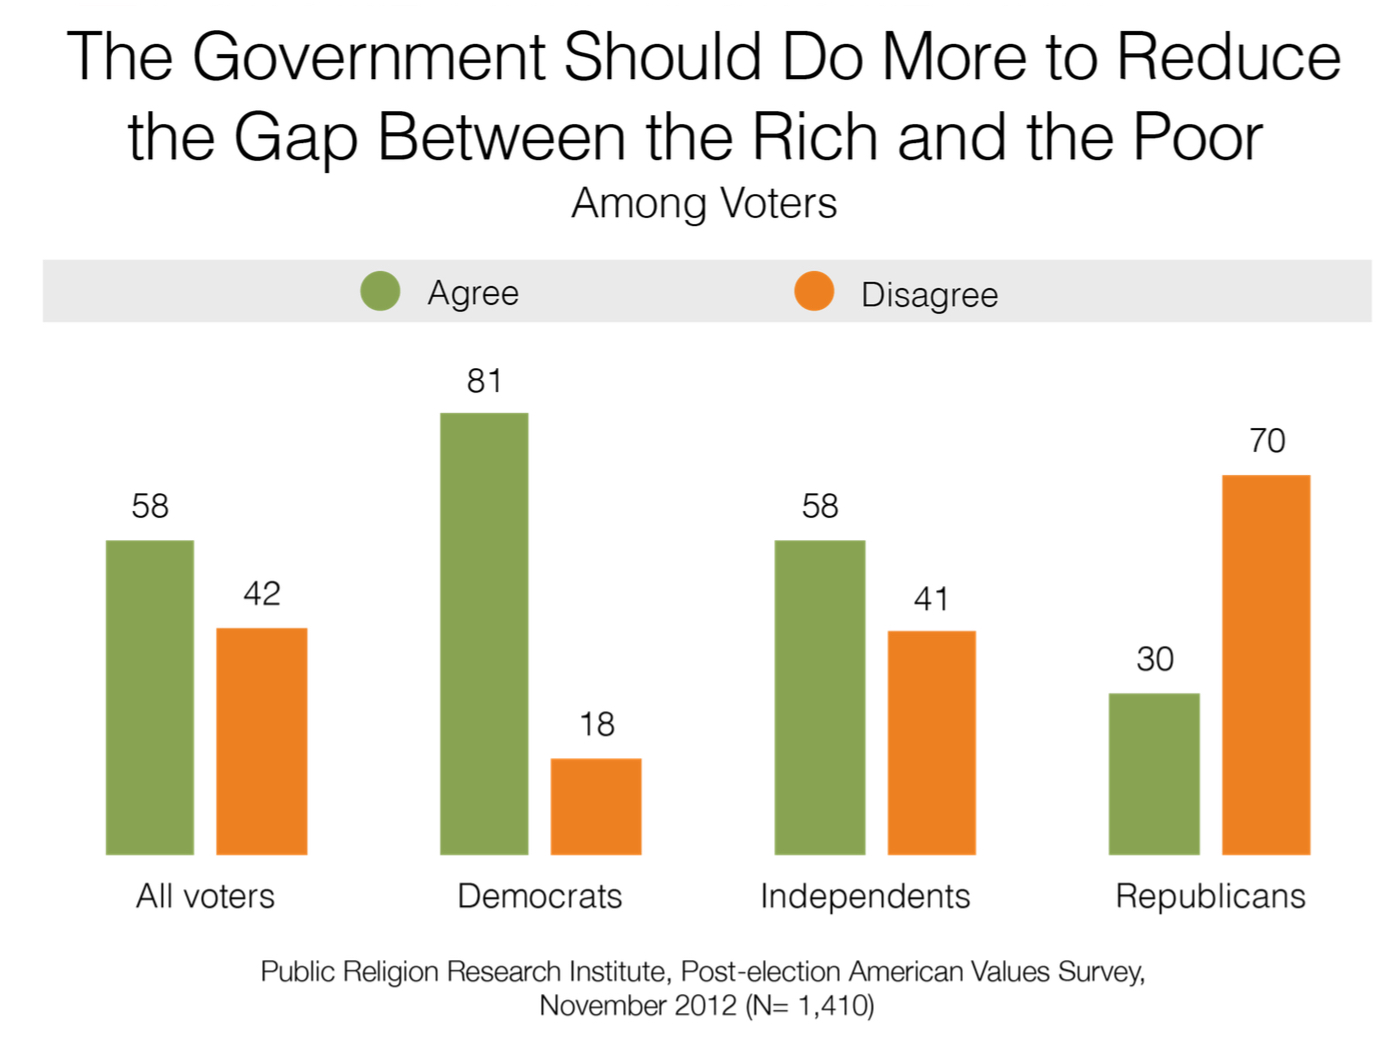
Roughly 6-in-10 (58%) voters believe the government should do more to reduce the gap between the rich and the poor.
- There are sharp partisan divides on this question. More than 8-in-10 (81%) Democratic voters and nearly 6-in-10 (58%) independent voters agree that the government should do more to reduce the gap between the rich and the poor, compared to 3-in-10 (30%) Republican voters. Seven-in-ten (70%) Republican voters disagree.
- Black voters (85%) are more likely than white voters (52%) to say the government should do more to reduce the gap between the rich and the poor.
- With the exception of white evangelical Protestant voters, strong majorities of voters in every religious group agree that the government should do more to reduce the gap between the rich and the poor. Nearly 6-in-10 (59%) white evangelical Protestant voters disagree.
Voters are more divided on the question of whether the government is providing too many social services that should be left to religious groups and private charities (50% agree vs. 49% disagree).
- Political polarization is also evident here, with independent voters falling roughly equally between Republican voters and Democrat voters. More than 8-in-10 (83%) Republican voters agree that the government is providing too many social services that should be left to religious groups and private charities, compared to half (50%) of independent voters and less than one-quarter (22%) of Democratic voters. Nearly 8-in-10 (77%) Democratic voters disagree.
- There is also considerable religious polarization between major religious groups on the question of whether the government is providing too many social services that should be left to religious groups and private charities.
- Nearly three-quarters (74%) of white evangelical Protestant voters, and slim majorities of white mainline Protestant voters (53%) and Catholic voters (51%), agree that the government is providing too many social services that should be left to religious groups and private charities.
- By contrast, more than 7-in-10 black Protestant voters (76%) and religiously unaffiliated voters (72%) disagree.
Government Strategy for Promoting Economic Growth
Voters are evenly divided on the best way to promote economic growth in the U.S. Nearly half (47%) of voters say the government should lower taxes on individuals and businesses and pay for those tax cuts by cutting spending on some government services and programs, while a nearly equal number (46%) prefer that the government spend more on education and the nation’s infrastructure, and raise taxes on wealthy individuals and businesses to pay for that spending.
- Republican and Democratic voters are highly polarized on the best way to promote economic growth, while independent voters mirror the voting public.
- Approximately 8-in-10 (82%) Republican voters say the government should lower taxes on individuals and businesses, while roughly the same number (77%) of Democratic voters say the government should spend more on education and the nation’s infrastructure.
- A plurality (47%) of independent voters say the government should lower taxes in individuals and businesses, while more than 4-in-10 (43%) say the government should spend more on education and infrastructure.
- Voters living in urban areas(55%) are significantly more likely than those living in rural communities (36%) to believe spending more on education and infrastructure will lead to economic growth. Voters living in the suburbs are nearly evenly divided on which approach would best promote growth.
- More than 6-in-10 black (62%) and Hispanic (61%) voters say the government should spend more on education and the nation’s infrastructure, while a slim majority (52%) of white voters say the government should lower taxes on individuals and businesses.
- White working-class voters are more likely than white college-educated voters to say the government should lower taxes on individuals and business (56% vs. 42% respectively) rather than spend more on education and the nation’s infrastructure (37% vs. 51% respectively), in order to promote economic growth.
- However, white working-class voters in Ohio differ slightly from white working-class voters overall: half (50%) of white working-class voters in Ohio say the government should spend more on education and the nation’s infrastructure, while 40% say the government should lower taxes on individuals and businesses.
- More than 6-in-10 (63%) Millennial voters (age 18-29) say the government should promote economic growth by spending more on education and the nation’s infrastructure, while approximately one-third (34%) say the government should lower taxes on individuals and businesses. By contrast, a plurality (49%) of senior voters (age 65 and up) say the government should lower taxes on individuals and businesses, while 4-in-10 (40%) say the government should spend more on education and the nation’s infrastructure.
Values and Principles That Should Guide Budget Policy Decisions
When asked about the values or principles that should guide upcoming budget policy decisions, strong majorities of Americans agree that living within our means (83%), promoting individual responsibility and self-sufficiency (72%), investing in the future (71%), and protecting poor and vulnerable Americans (61%) are very important. Voters are, however, divided by political affiliation on the primacy of these values.
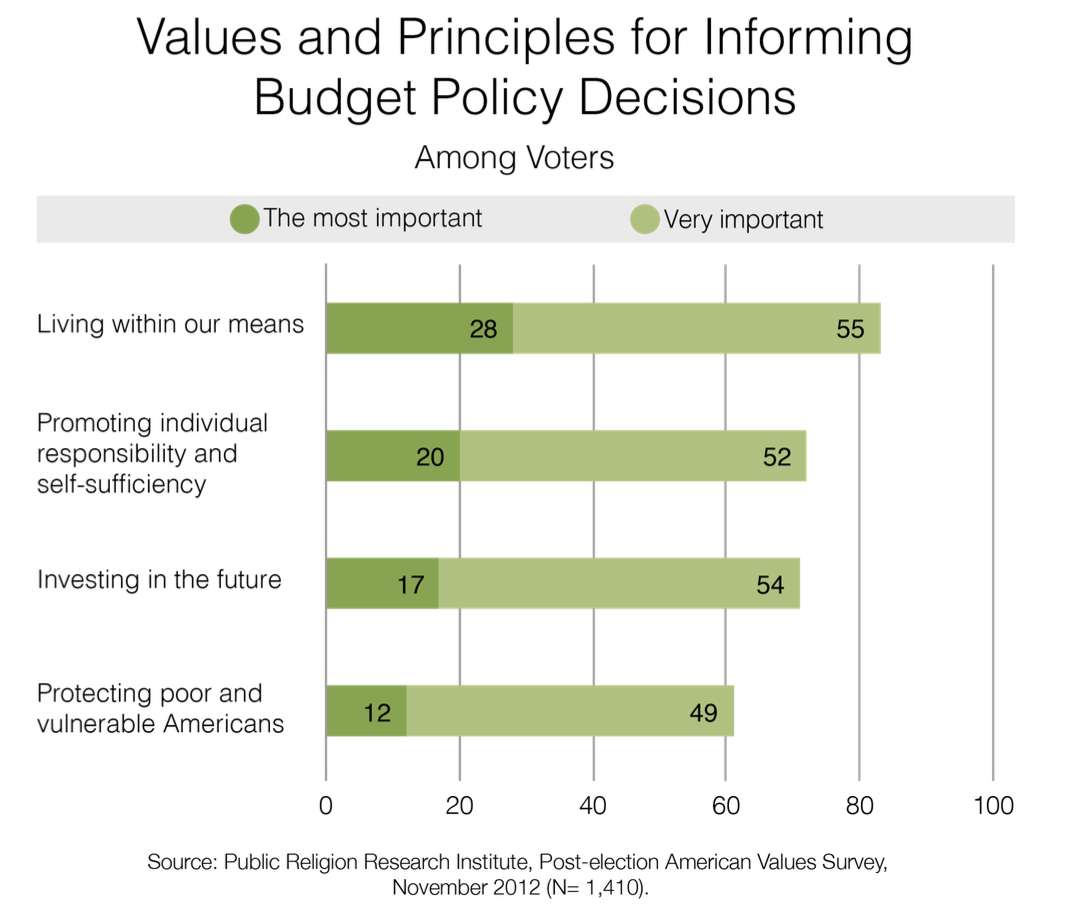
- Democratic (83%) and independent (73%) voters are more likely than Republican voters (57%) to say that investing in the future is the most important or a very important value. Similarly, Democratic (74%) and independent (61%) voters are more likely to prioritize protecting poor and vulnerable Americans as the most important or a very important value, compared to Republican voters (45%).
- Republican (89%) and independent (73%) voters, by contrast, are more likely than Democratic voters (57%) to say that promoting individual responsibility and self-sufficiency is the most important or a very important value. Republican (93%) and independent (86%) voters are also more likely than Democratic voters (72%) to say that living within our means is the most important or a very important value, although all voters strongly embrace this value.
Reducing the Deficit: Agreement on General Approach, Disagreement on Specifics
Preference for Balanced Approach That Includes Cutting Programs and Increasing Taxes
Despite political polarization on a range of issues, voters voice a strong preference for a balanced approach to reducing the federal budget deficit. One-in-five (20%) voters say we should focus mostly on cutting major programs, while less than 1-in-10 (6%) say we should focus mostly on increasing taxes. More than 7-in-10 (71%) voters say we should employ a combination of the two approaches.
- Approximately 8-in-10 Democratic (83%) and independent (78%) voters believe the best way to reduce the federal budget deficit is with a balanced approach that both cuts programs and increases taxes. A slim majority (52%) of Republican voters also agree with this approach, although more than 4-in-10 (41%) believe that the government should focus only cutting major programs.
Little Consensus on Specific Approaches to Deficit Reduction
While voters, for the most part, agree on a general combined approach of cutting programs and increasing taxes, there is more disagreement on specific spending cuts.
When asked about specific cuts to federal programs to reduce the deficit, roughly two-thirds (66%) of voters overall oppose cutting federal funding for social programs that help the poor, and nearly 7-in- 10 (69%) oppose cutting funding for the military.
- This agreement among all voters, however, masks significant political divides, particularly regarding social programs that help the poor. More than 8-in-10 (86%) Democratic voters and nearly 7-in-10 (68%) independent voters oppose cutting federal funding for social programs to help the poor, while only 41% of Republican voters oppose these cuts. A slim majority (53%) of Republican voters favor cutting funding for social programs that help the poor in order to reduce the federal deficit.
- At least 6-in-10 black (84%), Hispanic (75%), and white (62%) voters oppose cutting federal funding for social programs.
- There are no significant differences between white working-class voters (35%) and white college-educated voters (32%) on support for cutting programs to help the poor. However, nearly 8-in-10 (79%) white working-class voters oppose cutting funding for the military, compared to a slimmer majority (57%) of white college-educated voters.
- White evangelical Protestant voters are the only religious group that is divided over cutting federal funding for social programs that help the poor (49% favor vs. 46% oppose). Strong majorities of every other major religious group oppose these cuts. White evangelical Protestant voters are also the strongest opponents of cutting military spending, with 83% opposing these cuts.
- There is also a significant gender gap. Female voters (73%) are more likely than male voters (59%) to oppose cutting federal funding for social programs that help the poor.

Political polarization is also evident on proposals to increase taxes and eliminate tax breaks for large corporations in order to reduce the deficit. More than 6-in-10 (63%) voters favor increasing taxes on Americans making at least $250,000 per year, and a majority (55%) favor eliminating tax breaks for large corporations. There are, however, substantial divisions by party affiliation, particularly on increasing taxes for wealthy Americans.
- While nearly two-thirds (65%) of Republican voters oppose increasing taxes on Americans making at least $250,000 a year, nearly 9-in-10 (87%) Democratic voters and nearly two-thirds (66%) of independent voters favor this proposal.
- At least 6-in-10 black (68%), Hispanic (65%), and white (62%) voters favor increasing taxes on those making at least $250,000 a year.
- With the exception of white evangelical Protestant voters, at least 6-in-10 voters in every major religious group supports increasing taxes on Americans making more than $250,000 per year. White evangelical Protestant voters are divided, with half (50%) in favor and 47% opposed.
Endnotes
1 The number of cases for Hispanic voters is less than 100 (n=72) and should be interpreted with caution.
2 “Battleground states” in this analysis refers to the following nine states: Colorado, Florida, Iowa, North Carolina, Ohio, Virginia, Wisconsin, New Hampshire, and Nevada
3 It is commonly known in the academic literature that perceived socially desirable behaviors, such as voting and church attendance are over-reported, as is likely the case here.
4 Ohio population density is based on county-level population density (i.e., total population divided by total land area in square miles). County is based on self-reported zip code, and counties are divided into density quintiles where 1=lowest density and 5=highest density.
5 The targets for each candidate were based on the number of popular votes as reported on nytimes.com on 11/9/2012.
Recommended citation:
Jones, Robert P., Daniel Cox, and Juhem Navarro-Rivera. “The 2012 Post-election American Values Survey.” PRRI. 2012. http://www.prri.org/research/american-values-post-election-survey-2012/.