Executive Summary
 Nearly two-thirds (66%) of younger Millennials (age 18-25) say they are currently registered to vote, compared to about 6-in-10 (61%) who reported being registered to vote in March 2012. White younger Millennials (71%) are significantly more likely to report being registered to vote than black younger Millennials (60%) or Hispanic younger Millennials (53%).
Between March and September, however, there was little change in younger Millennials’ self-reported probability of voting. Half (50%) of younger Millennials currently report that they are absolutely certain to vote in the 2012 presidential election, compared to 46% in March.
Younger Millennials whose parents took them to the voting booth on Election Day are much more likely to be registered to vote (84%) and are more likely to say they are absolutely certain that they will vote in the upcoming election (66%).
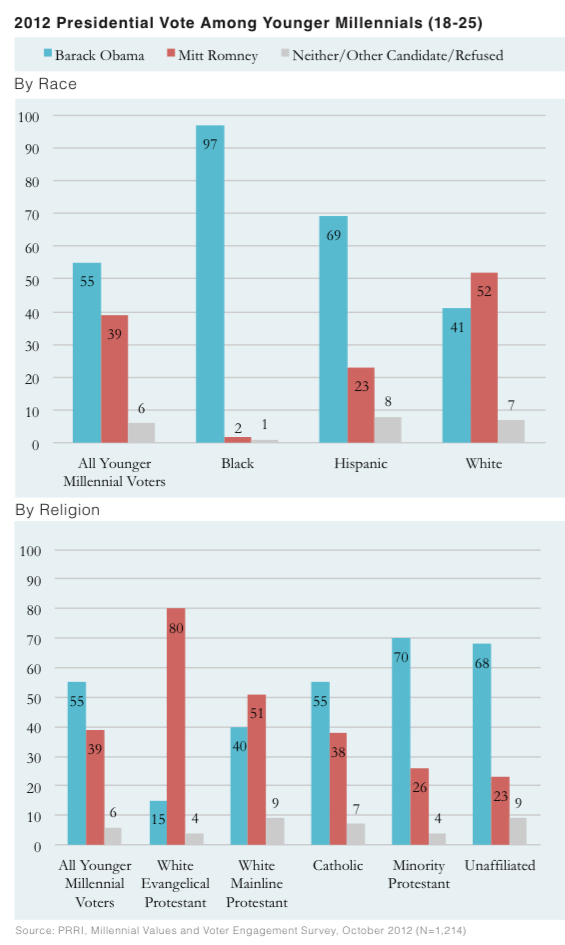
At this point in the campaign, Obama holds a 16-point lead over Romney among younger Millennial voters (55% vs. 39%). Obama’s lead among these voters has increased significantly since March, when he held a modest 7-point lead over Romney (48% vs. 41%).
- There are, however, substantial racial and ethnic divisions in voter preferences. Black younger Millennial voters overwhelmingly support Obama over Romney (97% vs. 2%), while Obama’s lead among younger Hispanic Millennial voters is also substantial (67% vs. 23%). By contrast, Romney has an 11-point advantage over Obama among white younger Millennial voters (52% vs. 41%).
- Romney has a commanding lead among white Christian younger Millennials. Eight-in-ten (80%) white evangelical Protestant younger Millennial voters support Romney, while just 15% support Obama. A slim majority (51%) of white mainline Protestant younger Millennial voters also prefer Romney, while 4-in-10 (40%) say they support Obama. Obama, however, has a significant advantage among Catholic younger Millennial voters overall (55% vs. 38%), minority Protestant younger Millennial voters (70% vs. 26%), and religiously unaffiliated younger Millennial voters (68% vs. 23%).
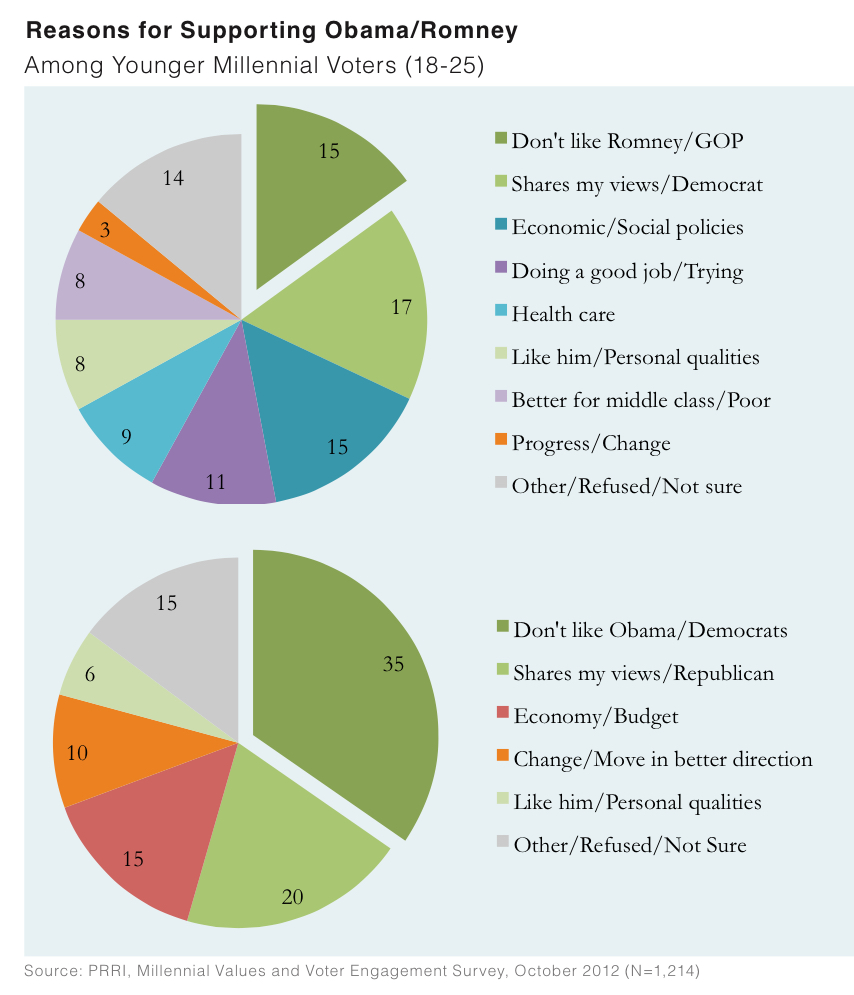
Obama supporters are nearly equally as likely to say they support him because he shares their views (17%) as they are to say that they support him because they do not like Romney (15%). By contrast, younger Millennial voters who support Romney are significantly more likely to say they support the GOP candidate because they dislike Obama (35%) than they are to report they support Romney because he shares their views (20%).
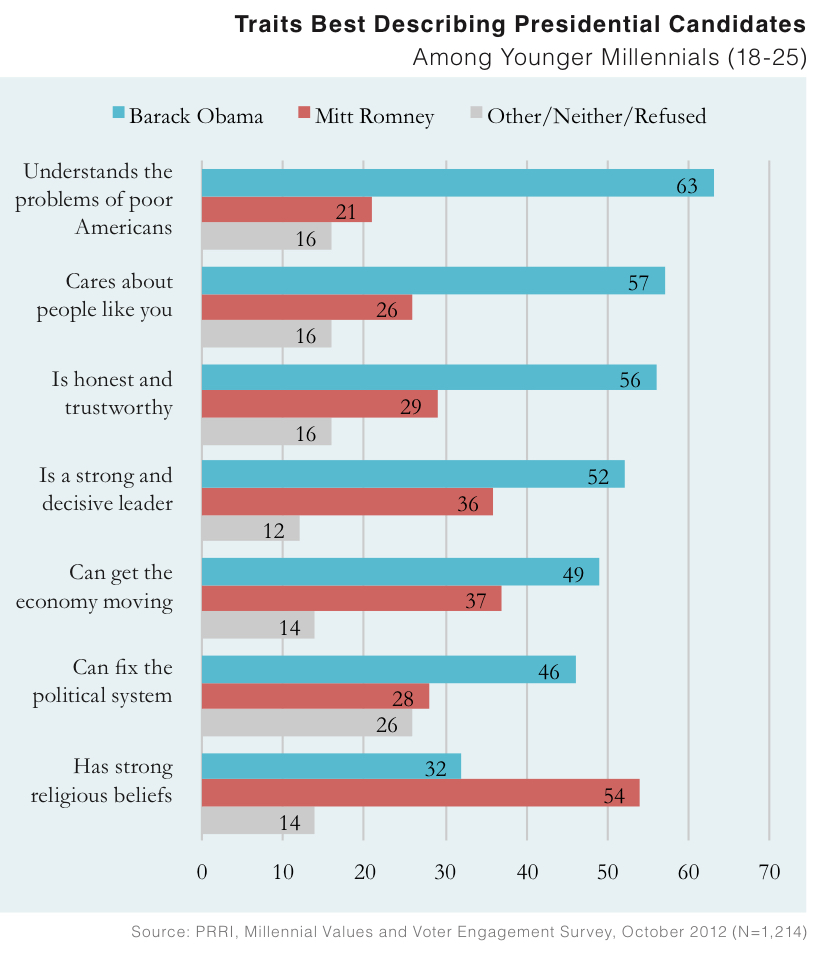
On a range of candidate traits related to empathy, trustworthiness, and leadership, Obama has a significant advantage over Romney. Of eight different traits, Romney outperforms Obama on only one: having strong religious beliefs.
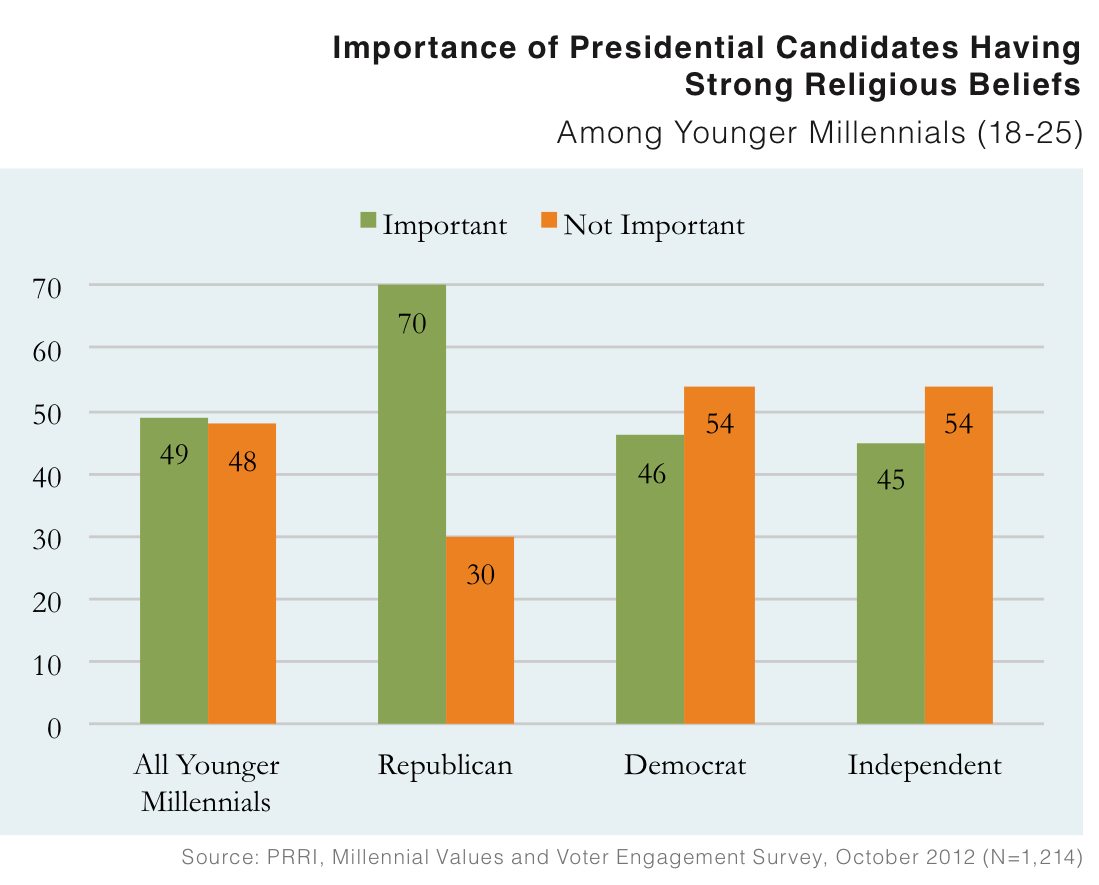
Nearly half (49%) of younger Millennials say it is somewhat or very important for a candidate to have strong religious beliefs, while 48% say it is not too important or not at all important for a presidential candidate to have strong religious beliefs.
- Seven-in-ten (70%) younger Millennial Republicans agree that it is important for a presidential candidate to have strong religious beliefs.
- By contrast, a majority of younger Millennial Democrats (54%) and younger Millennial Independents (54%) say it is not too or not at all important for a presidential candidate to have strong religious beliefs.
- A majority of black (68%) and Hispanic (57%) Millennials agree that it is important for a presidential candidate to have strong religious beliefs, compared to only 44% of white Millennials. A majority (53%) of white Millennials believe that it is notimportant for a presidential candidate to have strong religious beliefs.
Less than half of younger Millennials say they would be comfortable with a Mormon (44%), atheist (43%), or Muslim (30%) President.
- There is a strong correlation between younger Millennials’ level of comfort with a Mormon president and their support for Romney. Younger Millennial voters who say a Mormon president would make them uncomfortable are strongly supporting Obama over Romney (68% vs. 23%) while those who say they would be comfortable favor Romney (55% vs. 41%).
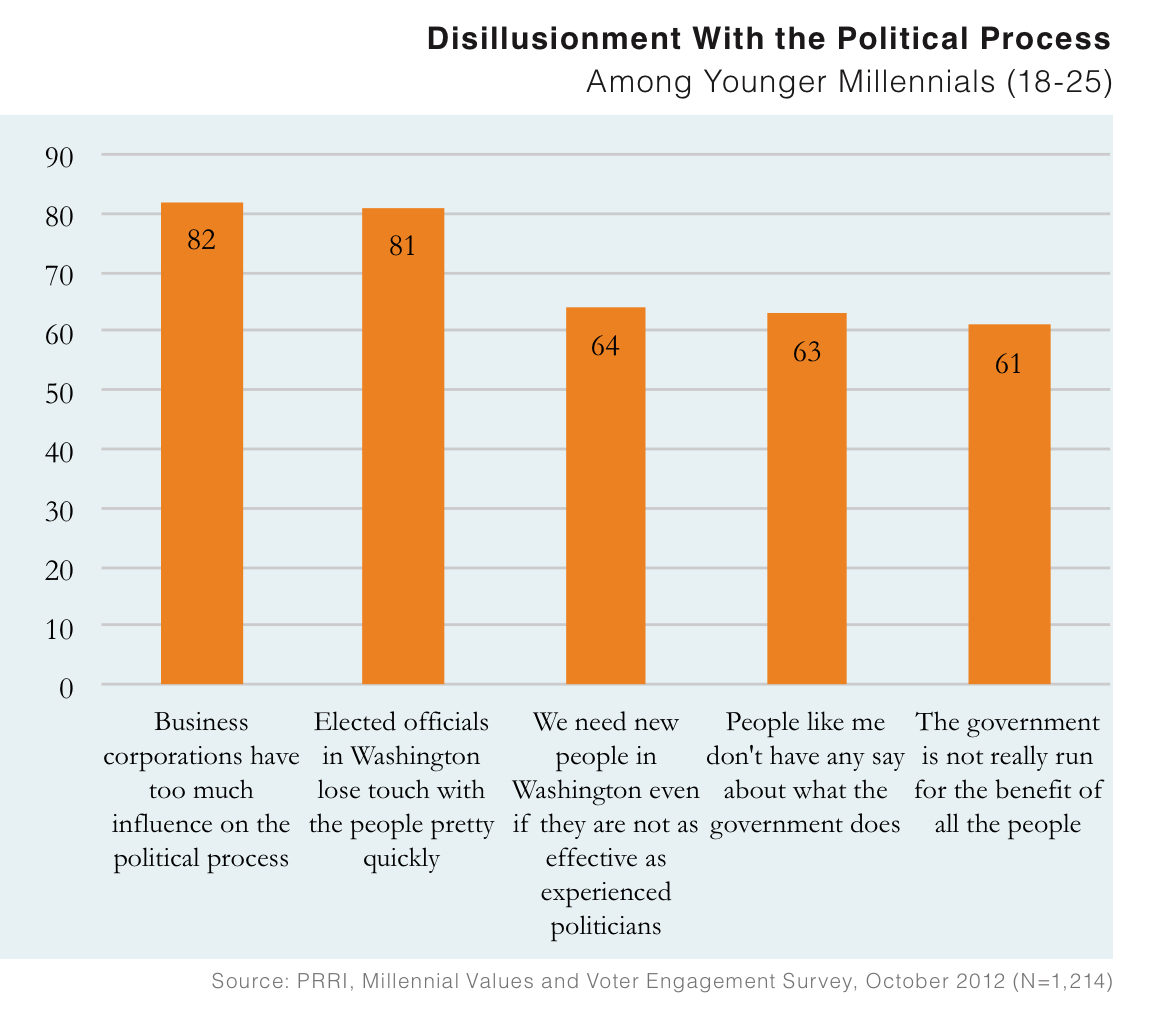
Overall, younger Millennials exhibit a high degree of pessimism about the democratic process and the government.
- More than 6-in-10 (63%) younger Millennials agree that “people like me don’t have any say about what the government does,” while more than 8-in-10 (82%) believe that business corporations have too much influence on the political process.
- Most (61%) younger Millennials reject the idea that “the government is really run for the benefit of all the people,” and younger Millennials are six times more likely to say they think about government as “the” government (86%) rather than “our” government (12%).
- This significant disillusionment with the government and the political process cuts across political affiliation, race, religious affiliation, and gender.
Despite the pessimism on a range of issues above, more than two-thirds (68%) of younger Millennials nonetheless say that “voting gives people like me some say about how government runs things.”
- There is a strong connection between likelihood of voting among younger Millennials and views about the efficacy of voting.
- Nearly 8-in-10 (79%) younger Millennials who say they are certain to vote in the presidential election agree that voting gives people like them some say about how the government runs things, compared to 41% of younger Millennials who say they are not likely to vote.
Nearly half (47%) of younger Millennials oppose programs that make special efforts to help blacks and other minorities to get ahead because of past discrimination, while around 4-in-10 (38%) favor these programs.
- Less than 1-in-5 (19%) white younger Millennials favor programs designed to help blacks and other minorities get ahead because of past discrimination, while nearly two-thirds (66%) are opposed.
- By contrast, three-quarters (75%) of black younger Millennials and more six-in-ten (63%) Hispanic younger Millennials favor such programs.
Support for affirmative action programs diminishes considerably when younger Millennials are asked specifically about affirmative action for college admissions.
- Nearly 7-in-10 (69%) younger Millennials believe that blacks and other minorities should not receive preference in college admissions to make up for past inequalities, while around 1-in-5 (19%) younger Millennials favor such programs.
- Black and Hispanic younger Millennials are divided on whether there should be affirmative action in college admissions, but white younger Millennials are strongly opposed.
Relatively few (15%) younger Millennials report that they were hurt in the college admissions process because of their race or gender, while about 1-in-10 (8%) say they were helped by these policies. Nearly 7-in-10 (69%) younger Millennials say their race or gender did not affect them.
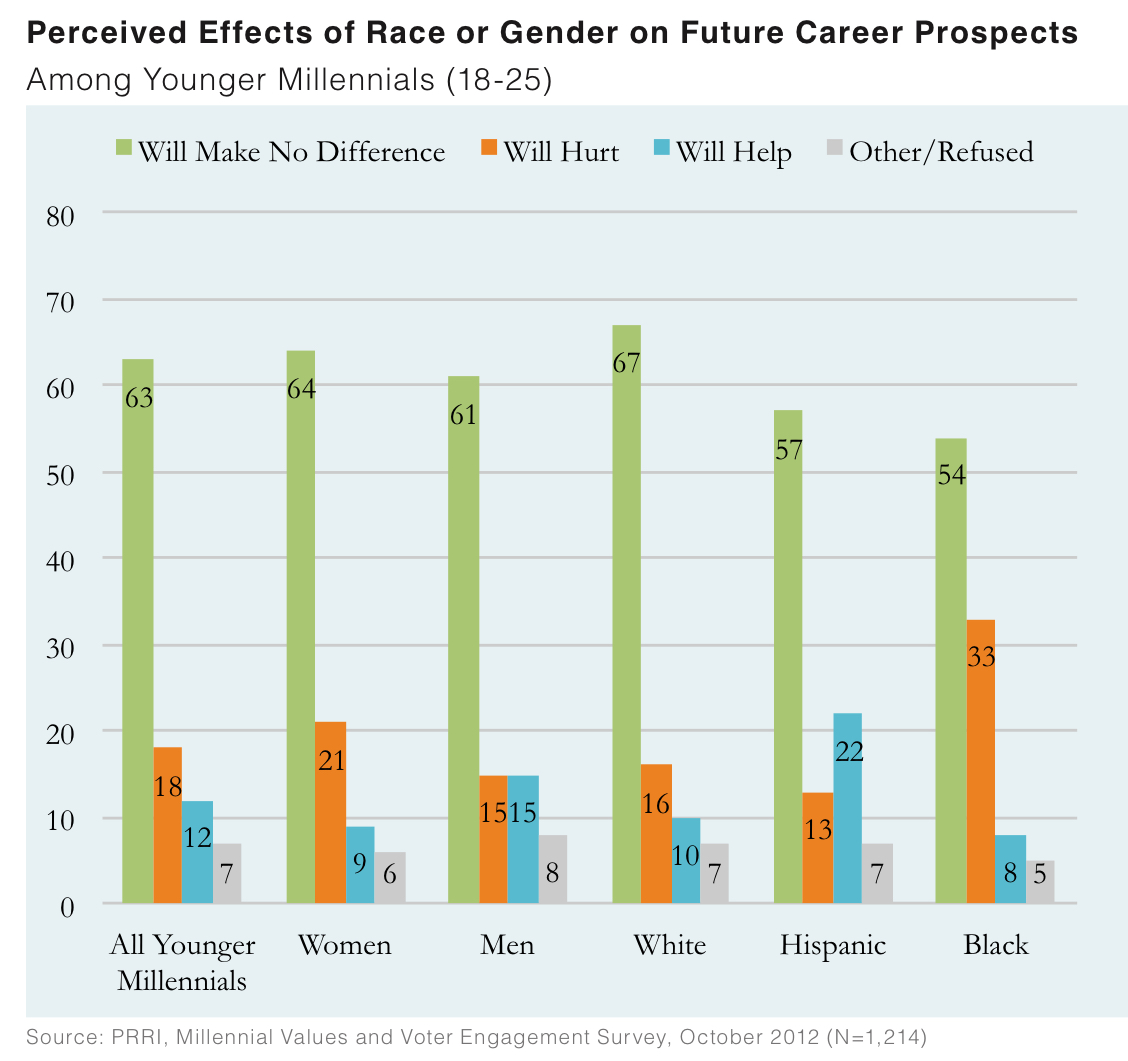
Most younger Millennials do not believe their race or gender will have an effect on their future career prospects.
- More than 6-in-10 (63%) younger Millennials believe that their gender or race will make no difference in their career, while 12% think it will help them, and 18% think it will hurt them.
- Majorities of white (67%), black (54%), and Hispanic (57%) younger Millennials say that their race or gender will make no difference in their career prospects.
I. Millennials and the 2012 Election
Introduction
The 2012 Millennial Values and Voter Engagement Survey is the second wave of a major two-part study of college-age Millennials (age 18-25) conducted during the 2012 presidential election campaign by Public Religion Research Institute and Georgetown University’s Berkley Center for Religion, Peace, and World Affairs. Together, the two surveys provide an unprecedented look at the voting preferences, social attitudes, and political engagement of this diverse generation of Americans. The surveys also explore the impact of worldview, values, familial and social relationships, and religion on younger Millennials’ political beliefs and behavior.
The first wave of this study, fielded in March 2012, highlighted the unique demographics and social experiences of this group of younger Millennials. There we noted that this generation is marked by considerable racial and ethnic diversity and fluidity in religious identity. Notably, younger Millennials are significantly more likely than the general population to be religiously unaffiliated. The survey also found that younger Millennials are being strongly influenced by technology and social media, and are shaped by close relationships with their parents. The full impact of education, however, has yet to be felt, since many of this cohort have yet to graduate from college. For more on the demographic characteristics of this diverse group, see the report from the first wave of the survey, “A Generation in Transition: Religion, Values, and Politics among College-Age Millennials.”
This report is based on the second wave survey of 1,214 adults ages 18 to 25 who were re-contacted from the first wave Millennials Values Survey between August 28 and September 10, 2012. The second wave of this study finds a significant increase in support for President Obama, but no significant increase in voter engagement over this period. Younger Millennials remain largely disillusioned about the democratic process and the government’s responsiveness to their needs. The survey also finds that despite perceptions of Millennials as “the diversity generation,” marked by tolerance and acceptance of difference, deep divisions remain among younger Millennials across a range of issues along racial and religious lines.
Voter Registration and Engagement in the 2012 Election
Nearly two-thirds (66%) of younger Millennials (age 18-25) say they are currently registered to vote, while about 6-in-10 (61%) who reported being registered to vote in March 2012.(1) White Millennials (71%) are significantly more likely to report being registered to vote than black (60%) or Hispanic Millennials (53%).
Between March and September, there was little change in younger Millennials’ self-reported probability of voting. Half (50%) of Millennials currently report that they are absolutely certain to vote in the 2012 presidential election, compared to 46% in March. Less than 1-in-5 (16%) say they will probably vote, and roughly one-third (32%) say the chances are 50-50 or less that they will vote. By contrast, 7-in-10 (70%) Americans overall say they are absolutely certain to vote in the presidential election, while 10% say they will probably vote, and 17% say the chances are 50-50 or less.(2)
Although there are no differences between younger Millennial men and women, there are differences in younger Millennials’ self-reported likelihood of voting by race and ethnicity and educational attainment. Hispanic Millennials (34%) are much less likely to say they are absolutely certain to vote than are white (54%) and black (58%) Millennials. Millennials with at least some college education (76%) are also more likely than those with a high school education or less (54%) to say they will probably vote.
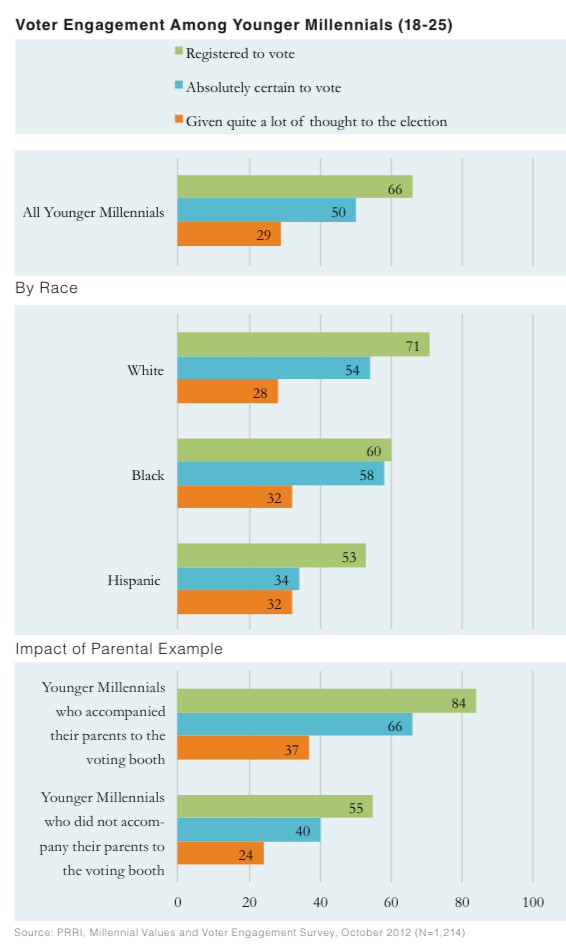
As the presidential campaign moves into the home stretch, most younger Millennials remain unengaged. Less than 3-in-10 (29%) younger Millennials report that they have given a lot of thought about the upcoming presidential election. Approximately 4-in-10 (37%) say they have given it “some” thought, and one-third say they have given little (22%) or no (11%) thought to the presidential campaign. There are no differences in attentiveness to the election by race or ethnicity, but Millennial men (72%) are more likely than Millennial women (61%) to report that they are paying at least some attention to the election.
The Power of Parental Example on Voting
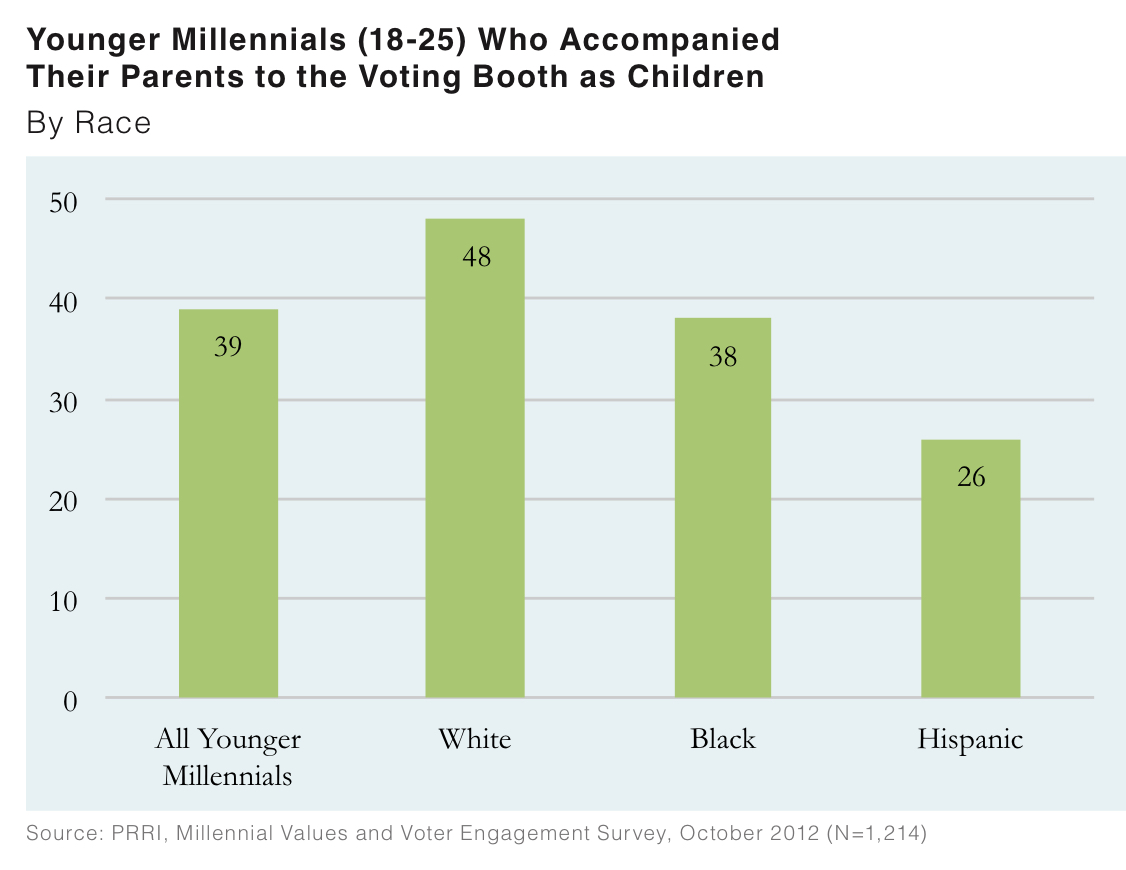
Roughly 4-in-10 (39%) younger Millennials report that, as children, they accompanied their parents to voting booth on Election Day. White Millennials (48%) are significantly more likely than black (38%) or Hispanic (26%) Millennials to say they accompanied their parents to the voting booth as children. A majority (54%) of ideologically conservative Millennials report that their parents took them to the voting booth, compared to 41% of ideologically liberal Millennials and 31% of ideologically moderate Millennials.
Younger Millennials who are religiously affiliated are significantly more likely than those who are not to have accompanied their parents to the voting booth as children. More than 6-in-10 (64%) white Catholic Millennials say that they accompanied their parents to the voting booth as children. Approximately half of white evangelical Protestant (52%), white mainline Protestant (50%), and Catholic Millennials overall (53%) say that their parents took them to the voting booth on Election Day. More than 3-in-10 (31%) minority Protestant Millennials and around one-quarter (26%) of religious unaffiliated Millennials say that as children, they went with their parents to the voting booth on Election Day.
Younger Millennials whose parents took them to the voting booth on Election Day are much more likely to be registered to vote and are more certain that they will vote in the upcoming election. More than 8-in-10 (84%) younger Millennials who report that they went with their parents to the voting booth say they are currently registered to vote, compared to 55% of those who did not accompany their parents. Similarly, nearly two-thirds (66%) of Millennials who traveled with their parents to the voting booth say they are absolutely certain they will vote this year, compared to 40% of those who did not.
Why Millennials Do Not Vote
In response to an open-ended question about why more people their age do not vote, the most frequently cited reason is electoral apathy or lack of interest in politics (27%). Comments like, “Politics can be boring,” and, “They don’t care enough,” are fairly typical of the responses offered. Younger Millennials are less likely to explain their generation’s low voting rates by citing the belief that their vote doesn’t count or matter (13%), that they are too busy or voting is too difficult (14%), that young people are simply lazy (13%), that they are uninformed (9%), or that they dislike politicians (4%).
There are few divides among younger Millennials on why more young people do not vote. However, Millennial women (14%) are more likely than Millennial men (4%) to say that being uninformed was a reason more young people do not vote.
Campaign Outreach
Roughly 4-in-10 (43%) younger Millennials (age 18-25) report that someone has talked to them about voting or registering to vote. A majority (56%) of black Millennials report that they have been contacted by someone about voting or registering to vote, compared to roughly 4-in-10 white (41%) and Hispanic (41%) Millennials. Younger Millennials who are currently attending a college or university (50%) are much more likely to have been contacted about voting or registering to vote than those who have already graduated (39%) or who have never attended (37%).
Six-in-ten younger Millennials report that they have seen a lot (32%) or at least some (28%) campaign commercials featuring one of the candidates. Nearly 1-in-5 (19%) report that they have not seen any. Younger Millennials are most likely to report seeing or hearing campaign commercials on television (89%); few report seeing or hearing them on a news website or blog (17%), on the radio (13%) or through social networking sites like Facebook (16%). There are few demographic differences, but younger Millennials who identify as ideologically liberal (27%) are more than twice as likely as younger Millennials who identify as ideologically conservative (10%) or moderate (13%) to say that they have seen campaign commercials on social media.
Voting Preferences in 2012
Obama vs. Romney
At this point in the campaign, President Barack Obama holds a 16-point lead over Governor Mitt Romney among younger Millennial voters (55% vs. 39%). Obama’s lead among these voters has increased since March, when he held a modest 9-point lead over a generic Republican candidate (48% vs. 39%).
There are, however, substantial racial and ethnic divisions in younger Millennial voters’ preferences. Black Millennial voters overwhelmingly support Obama over Romney (97% vs. 2%), while Obama’s lead among Hispanic Millennial voters is also substantial (69% vs. 23%).(3) By contrast, Romney has an 11-point advantage over Obama among white Millennial voters (52% vs. 41%). However, there are also pronounced regional differences among white Millennial voters. Romney holds a lead over Obama in the South (62% vs. 30%). By contrast, white Millennial voters in the West (48% vs. 47%) and Midwest (44% vs. 49%) are divided between Romney and Obama.(4)
One reason for Obama’s advantage among younger Millennial voters overall is that he performs much better among his party’s ideological base than Romney. Nearly 9-in-10 (86%) liberal Millennial voters support Obama, while more than 7-in-10 (72%) conservative Millennial voters support Romney. Nearly 1-in-4 (23%) conservative Millennial voters report that they would vote for Obama if the election were held today.
There are substantial religious divisions in younger Millennials’ support for the two candidates. Romney has a commanding lead among white Christian voters. Eight-in-ten (80%) white evangelical Protestant Millennial voters support Romney, while just 15% support Obama. A slim majority (51%) of white mainline Protestant Millennial voters also prefer Romney, while 4-in-10 (40%) say they support Obama. Obama, however, has a significant advantage over Romney among Catholic Millennial voters overall (55% vs. 38%), minority Protestant voters (70% vs. 26%), and religiously unaffiliated Millennial voters (68% vs. 23%).
Behind Vote Preferences: Reasons for Supporting Obama and Romney
Younger Millennial voters articulate a broader range of reasons for supporting Obama than for supporting Romney. Obama supporters are nearly equally as likely to say they support him because he shares their views (17%) as they are to say that they support him because they do not like Romney (15%). About 1-in-10 say they support Obama because he is trying to do or doing a good job (11%), because of personal qualities (8%), or because he cares more about the poor and middle class (8%). About one-quarter of Obama supporters say they support him because of some policy stance, such as health care (9%), economic policies (6%), reproductive or social policies (4%), education and environmental policies (3%), and immigration (2%). Only 3% of younger Millennial voters mention progress, hope, or change, the major themes of Obama’s 2008 campaign.(5)
By contrast, younger Millennial voters who support Romney are more likely to say they support the GOP candidate because they dislike Obama (35%) than they are to report they support Romney because he shares their views (20%). Six percent of Millennial voters who are supporting Romney cite his personal qualities or the fact that they like him. Few Romney supporters mention policy specifics: 15% mention the economy or budget in general, and only a handful of supporters mentioned other specific policies. One-in-ten (10%) mention change or moving in a different direction.
Influence of Voting Preferences of Millennials’ Parents
When asked about their parents’ voting preferences, less than 4-in-10 (37%) younger Millennials say their parents are likely voting for Obama, while nearly as many (31%) say that their parents are supporting Romney. About 1-in-10 (9%) Millennials reported their parents are likely splitting their vote between the candidates. Nearly 1-in-5 (19%) Millennials say that their parents are probably not going to vote.
Parental voting patterns strongly affect the voting patterns of younger Millennials. Nearly all (96%) Millennial voters whose parents are both supporting Obama are also supporting the President. Among Millennials whose parents are both supporting Romney, 84% say they are supporting the Republican nominee.
Parental voter participation also has a strong influence on younger Millennials’ voter participation. Among Millennials who say their parents are probably not going to vote, only 30% are registered to vote and only 13% say they are absolutely certain to vote.
Views of the Candidates and the Parties
Obama’s Job Performance
Overall, a slim majority (51%) of younger Millennials (age 18-25) say they approve of the way Barack Obama is handling his job as President. Nearly 4-in-10 (39%), however, say they disapprove of Obama’s job performance.
There are striking partisan divides on this question. More than 9-in-10 (92%) Millennial Democrats say they approve of the way Obama is handling his job as President, compared to only 1-in-10 (10%) Millennial Republicans. Millennial Independents are divided: 40% say they approve of Obama’s job performance, while 44% disapprove.
Black (84%) and Hispanic (65%) Millennials are much more likely than white Millennials (36%) to say they approve of the way Obama is handling his job as President. A majority (55%) of white Millennials say they disapprove of Obama’s job performance, but white Millennials’ views are highly stratified by region. Nearly two-thirds (66%) of white Millennial voters in the South say they disapprove of Obama’s job performance, while only around one-quarter (26%) approve. By contrast, white Millennial voters in the Midwest (44% approve, 48% disapprove) and West (50% approve, 46% disapprove) are divided.
Views of Barack Obama and Mitt Romney
In terms of personal appeal, Obama has a significant edge over Romney. A majority (56%) of younger Millennials (age 18-25) have a favorable opinion of Obama, while roughly 4-in-10 (38%) have an unfavorable opinion. By contrast, approximately one-third (32%) of younger Millennials have a favorable opinion of Romney, while nearly 6-in-10 (58%) view the Republican nominee unfavorably. Views of the candidates are sharply divided by race and party affiliation.
Younger Millennials’ views about the two candidates are highly politically polarized. Millennial Democrats have a nearly unanimously (95%) positive impression of Obama, while only around 1-in-10 (12%) Millennial Republicans say they have a favorable view of the President. Similarly, more than 8-in-10 (83%) Millennial Republicans say they view Romney favorably, compared to 8% of Millennial Democrats. However, Millennial Independents have a more positive view of Obama than of Romney. Half (50%) of Millennial Independents say they view Obama favorably, while less than 3-in-10 (29%) say the same of Romney.
Black (92%) and Hispanic (72%) Millennials are far more likely than white Millennials (40%) to have a favorable view of Obama. However, white Millennials have similarly lukewarm feelings about Romney (44% favorable). Less than 1-in- 5 (16%) Hispanic Millennials and 1-in-10 (10%) black Millennials have favorable opinion of the GOP nominee.
Majorities of minority Protestant Millennials (78%), religiously unaffiliated Millennials (66%), and Catholic Millennials overall (59%) have a favorable opinion of Obama. However, less than half of white mainline Protestant Millennials (38%), white Catholic Millennials (31%), and white evangelical Protestant Millennials (26%) have a favorable opinion of the President.
The reverse is true with regard to Romney. Majorities of white evangelical Protestant Millennials (63%) and white Catholic Millennials (56%) have a favorable opinion of Mitt Romney. Less than half of white mainline Protestant Millennials (48%), Catholic Millennials (38%), minority Protestant Millennials (20%), and religiously unaffiliated Millennials (19%) have a favorable view of the GOP nominee.
Candidate Traits
With regard to candidate traits related to empathy and trustworthiness and leadership and efficacy. Barack Obama generally has a significant advantage over Mitt Romney. On traits related to empathy and trustworthiness, Obama enjoys a greater advantage. Most Millennials believe the phrase, “understands the problems of poor Americans,” better describes Obama (63%) than Romney (21%). A majority (56%) of Millennials believe that Obama can be more accurately described as “honest and trustworthy,” compared to Romney (29%). Younger Millennials are also more likely to say that “cares about people like you” is more applicable to Obama (57%) than to Romney (26%).
Obama also has double-digit advantage over Romney on traits related to leadership. Obama holds a 16-point edge over Romney on being perceived as a “strong and decisive leader” (52% vs. 36%), a 12-point advantage over Romney on being perceived as the leader who “can get the economy moving again” (49% vs. 37%), and an 18-point advantage on being perceived as a leader who “can fix the political system” (46% vs. 28%).
Younger Millennials are, however, more likely to believe the phrase “has strong religious beliefs,” better describes Romney (54%) than Obama (32%).
There are substantial racial divisions on these questions about candidate traits, with black and Hispanic Millennials favoring Obama across nearly all measures, while white Millennials are more divided. White Millennials are, for the most part, more likely to believe Romney better exemplifies traits related to leadership than Obama. Nearly 4-in-10 (39%) white Millennials say that Romney is the leader who can “fix the political system,” while about one-third (32%) say this better describes Obama. Similarly, a majority (51%) of white Millennials believe that Romney is more likely to get the economy moving, while 35% say this better describes Obama. White Millennials are also more likely to believe that Romney (48%) can be better described as a “strong and decisive leader,” rather than Obama (39%).
White Millennials are also divided on traits related to empathy and trustworthiness. White Millennials are about equally likely to say that Obama (43%) and Romney (39%) care more about people like them. Similarly, 41% of white Millennials report that Obama is more honest and trustworthy, while 43% say this better describes Romney. Nearly two-thirds (66%) of white Millennials say that Romney holds stronger religious beliefs, while 1-in-5 (20%) say the same of Obama.
Majorities of all religious groups believe that Romney possesses stronger religious beliefs than Obama. More than 8-in-10 (82%) white evangelical Protestant Millennials, 7-in-10 (70%) white Catholic Millennials, and around 6-in-10 (61%) white mainline Protestant Millennials say that Romney holds stronger religious beliefs than Obama, while slimmer majorities of religiously unaffiliated Millennials (58%) and Catholic Millennials overall (53%) say the same. Minority Protestant Millennials are the only group in which a majority (53%) say Obama has stronger religious beliefs than Romney.
Views of Joe Biden and Paul Ryan
Overall, younger Millennials (age 18-25) are divided in their view of Vice President Joe Biden: 42% have a favorable opinion, while 39% have an unfavorable opinion, and 14% say they are unfamiliar with the Vice President. Younger Millennials are nearly twice as likely to have an unfavorable (45%) rather than favorable (25%) view of vice presidential nominee Paul Ryan, while nearly 3-in-10 (27%) say they have not heard of Ryan.
As with the presidential candidates, younger Millennials show high levels of partisan polarization in their opinions of the vice presidential candidates. More than three-quarters (76%) of Millennial Democrats hold a favorable view of Biden, while only 7% have a favorable view of Ryan. Similarly, nearly two-thirds (64%) of Millennial Republicans hold favorable views of Ryan, while only 15% have a favorable view of Biden.
Although Ryan is less well known among younger Millennials overall, Catholic Millennials are about equally as likely to have heard of both vice presidential candidates. Among all Catholic Millennials, Biden (48%) has a nearly 20-point advantage in favorability over Ryan (30%). However, only one-third (33%) of white Catholics view Biden favorably, while more than 4-in-10 (43%) have a favorable impression of Ryan.
Views of the Major Parties
A slim majority (51%) of younger Millennials (age 18-25) have a favorable opinion of the Democratic Party, while one-third (33%) hold a favorable view of the Republican Party.
Younger Millennials are highly politically polarized in their views of the two major parties. More than 9-in-10 (93%) Millennial Democrats have a favorable view of the Democratic Party, while only 6% say the same of the Republican Party. Similarly, nearly 9-in-10 (89%) Millennial Republicans have a favorable view of the Republican Party, while only 12% say the same of the Democratic Party. Millennial Independents express dissatisfaction with both major parties: majorities of Millennial Independents say they have an unfavorable view of both the Republicans (59%) and the Democrats (51%).
There are substantial racial divides in younger Millennials’ perspectives on the two parties. Solid majorities of black (87%) and Hispanic (60%) Millennials say they have a favorable opinion of the Democratic Party. Less than one-quarter (23%) of Hispanic Millennials and less than 1-in-10 (6%) black Millennials say they have a favorable view of the Republican Party. Notably, neither political party is viewed favorably by a majority of white Millennials. Only 36% of white Millennials say they have a favorable view of the Democratic Party, while less than half (44%) say they have a favorable opinion of the Republican Party.
Millennial women (56%) are more likely than Millennial men (44%) to hold a favorable opinion of the Democratic Party. There are no divisions by gender in terms of the Republican Party’s favorability.
Perceptions of the Major Parties’ Political Identities
Younger Millennials are more likely to say the Republican Party is politically conservative (64%) than they are to identify the Democratic Party as politically liberal (53%). Three-in-ten (30%) younger Millennials identify the Democratic Party as moderate, while about one-quarter (23%) say the same of the GOP. Few Millennials identify the Democrats as conservative (12%) or the Republicans as liberal (8%).
There are substantial differences in how younger Millennial partisans view their own party and the opposition party. When asked where the Democratic Party falls on the ideological spectrum, Millennial Democrats are less likely than Millennial Republicans to report that the Democratic Party is liberal (53% vs. 78%). Millennial Democrats are four times more likely than Republican Millennials to say that the Democratic Party is moderate (33% vs. 8%).
There is greater agreement about ideological identity of the GOP. Roughly three-quarters of Millennial Republicans and Democrats believe the GOP is conservative (74% each). However, Millennial Democrats are more likely to believe the GOP is “very conservative” (51% vs. 15%). Millennial Republicans are nearly twice as likely as Millennial Democrats to say the Republican Party is moderate (24% vs. 13%).
Religion and Voting
The Importance of a Presidential Candidate’s Religion
Younger Millennials (age 18-25) are nearly evenly divided on whether it is important for a presidential candidate to have strong religious beliefs. Nearly half (49%) of younger Millennials say it is somewhat or very important for a candidate to have strong religious beliefs, while 48% say it is not too important or not at all important for a presidential candidate to have strong religious beliefs.
There are significant differences by political affiliation. Seven-in-ten (70%) Millennial Republicans agree that it is important for a presidential candidate to have strong religious beliefs. By contrast, a majority (54% each) of Millennial Democrats and Millennial Independents say it is not important.
There are also substantial differences by race. A majority of black (68%) and Hispanic (57%) Millennials agree that it is important for a presidential candidate to have strong religious beliefs, compared to only 44% of white Millennials. A majority (53%) of white Millennials believe that it is not important for a presidential candidate to have strong religious beliefs.
Majorities of all religiously affiliated younger Millennials say that it is important for a presidential candidate to have strong religious beliefs. More than three-quarters (77%) of white evangelical Protestant Millennials, three-quarters (74%) of minority Protestant Millennials, nearly 6-in-10 Catholic Millennials overall (57%) and white Catholic Millennials (57%), and a slim majority (51%) of white mainline Protestant Millennials say it is important for a presidential candidate to have strong religious beliefs. By contrast, nearly 8-in-10 (78%) religiously unaffiliated Millennials disagree. Notably, 60% of religiously unaffiliated Millennials say it is not at all important for a presidential candidate to have strong religious beliefs.
Younger Millennials with a four-year college degree (34%) are significantly less likely than those with a high school education or less (53%) to say that it is important for a presidential candidate to have strong religious beliefs.
Comfort With a Mormon President and Impact on Vote
Younger Millennials report varying degrees of comfort with the idea of presidents from different religious backgrounds. Overall, younger Millennials express more comfort with the idea of an evangelical Christian serving as president, than with a Mormon, atheist, or Muslim. More than 6-in-10 (61%) of younger Millennials say they would be comfortable with an evangelical Christian serving as president, while less than half say they would be comfortable with a Mormon (44%), atheist (43%), or Muslim (30%) president.
White Millennials (50%) are more likely than both black (33%) and Hispanic (27%) Millennials to express comfort with a Mormon president. White (44%) and Hispanic (43%) Millennials are more likely than black Millennials (30%) to express comfort with the idea of an atheist president.
Millennial Republicans are significantly more comfortable than Millennial Democrats with the idea of a Mormon president (62% vs. 39%). By contrast, Millennial Democrats are significantly more likely than Millennial Republicans to be comfortable with an atheist (53% vs. 25%) or a Muslim (46% vs. 13%) President. There is more accord among Millennial Democrats and Republicans in their comfort with an evangelical President (63% and 75%).

Majorities of white mainline Protestant Millennials (56%), white evangelical Protestant Millennials (56%), and white Catholic Millennials (57%) say they would be comfortable with a Mormon president. By contrast, majorities of religiously unaffiliated Millennials (59%) and minority Protestant Millennials (63%) say they would be uncomfortable with a Mormon president.
There is a strong relationship between younger Millennials’ level of comfort with a Mormon president and their support for Romney. Among registered voters, younger Millennials who say a Mormon president would make them uncomfortable strongly support Obama over Romney (69% vs. 23%), while those who say they would be comfortable with a Mormon president favor Romney (55% vs. 41%).
Differences in Candidates’ Religious Beliefs and Impact on Vote
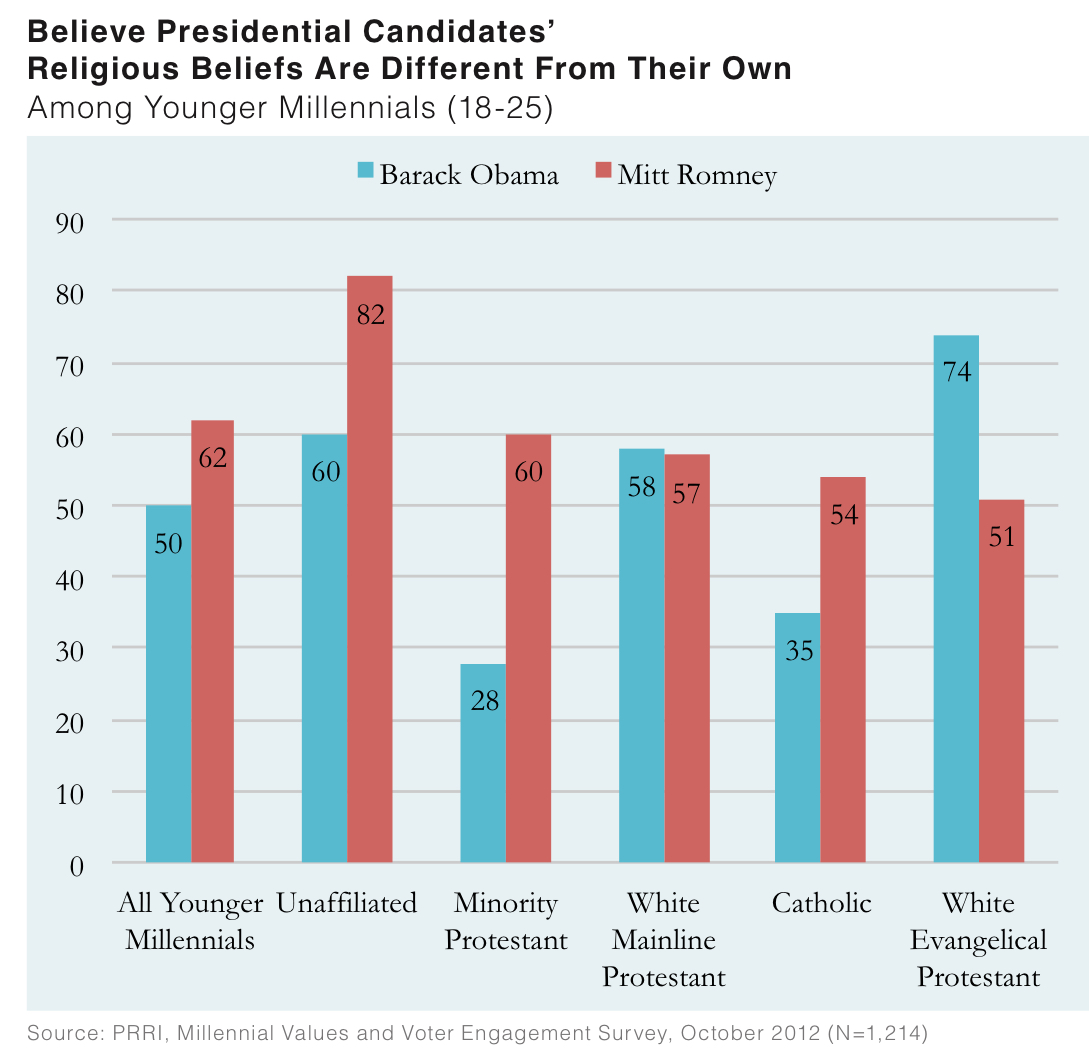
Although most younger Millennials report that the statement “has strong religious beliefs” is a more apt description for Romney rather than Obama, they are more likely to believe that Obama’s religious beliefs are similar to their own. More than 6-in-10 Millennials say that Romney’s religious beliefs are somewhat (22%) or very different (40%) than their own religious beliefs. Younger Millennials are divided on whether Obama’s religious beliefs are similar to their own.
Half (50%) of Millennials say that Obama’s beliefs are different from their own, while 45% say that Obama’s beliefs are similar to their own.
There are major cleavages by religious affiliation. Nearly three-quarters (74%) of white evangelical Protestant Millennials, and about 6-in-10 white mainline Protestant Millennials (58%) and religiously unaffiliated Millennials (60%) say that Obama’s religious beliefs are different from their own. About two-thirds (67%) of minority Protestant Millennials and 6-in-10 (61%) Catholic Millennials say that Obama’s religious beliefs are similar to their own. Majorities of all religious groups believe that Romney’s religious beliefs are different from their own, including 82% of religiously unaffiliated Millennials, 60% of minority Protestant Millennials, 57% of white mainline Protestant Millennials, 54% of Catholic Millennials overall, and 51% of white evangelical Protestant Millennials.
There are substantial political divisions on this question. More than 6-in-10 (63%) Millennial Democrats agree that Obama’s religious beliefs are similar to their own, compared to only 24% of Millennial Republicans. By contrast, a majority (57%) of Millennial Republicans say that Romney’s religious beliefs are similar to their own, compared to 1-in-5 (20%) Millennial Democrats. Majorities of Millennial Independents agree that both Romney’s (63%) and Obama’s (55%) religious beliefs are different from their own.
Perceptions of religious difference are strongly correlated to support. Among younger Millennial voters who see Romney’s religion as different from their own, Obama leads Romney (69% vs. 25%). However, among those who see Obama’s religion as different from their own, Romney leads Obama (55% to 36%).
II. Affirmative Action
The Millennial generation is the most religiously, ethnically, and racially diverse generation in American history. This diversity has resulted in dramatically increased levels of social interaction among Millennials with different backgrounds, which in turn correlates with greater levels of tolerance and acceptance of difference. However, the first wave of the current survey, conducted in March 2012, uncovered surprising racial tensions among younger Millennials, particularly on the issue of discrimination on the basis of race. Specifically, the previous survey found that nearly 6-in-10 (58%) white Millennials agree that discrimination against whites has become as big a problem as discrimination against blacks and other minorities. Hispanic (59%) and black (65%) Millennials, however, strongly reject this statement. In order to provide a deeper understanding of how attitudes about discrimination and race remain operative in this generation, we asked a series of questions about affirmative action, a topic that is relevant to many younger Millennials as they seek admission into colleges and the job market.
General Support for Affirmative Action Programs
Nearly half (47%) of younger Millennials (age 18-25) oppose programs that make special efforts to help blacks and other minorities get ahead because of past discrimination, while around 4-in-10 (38%) favor these programs.
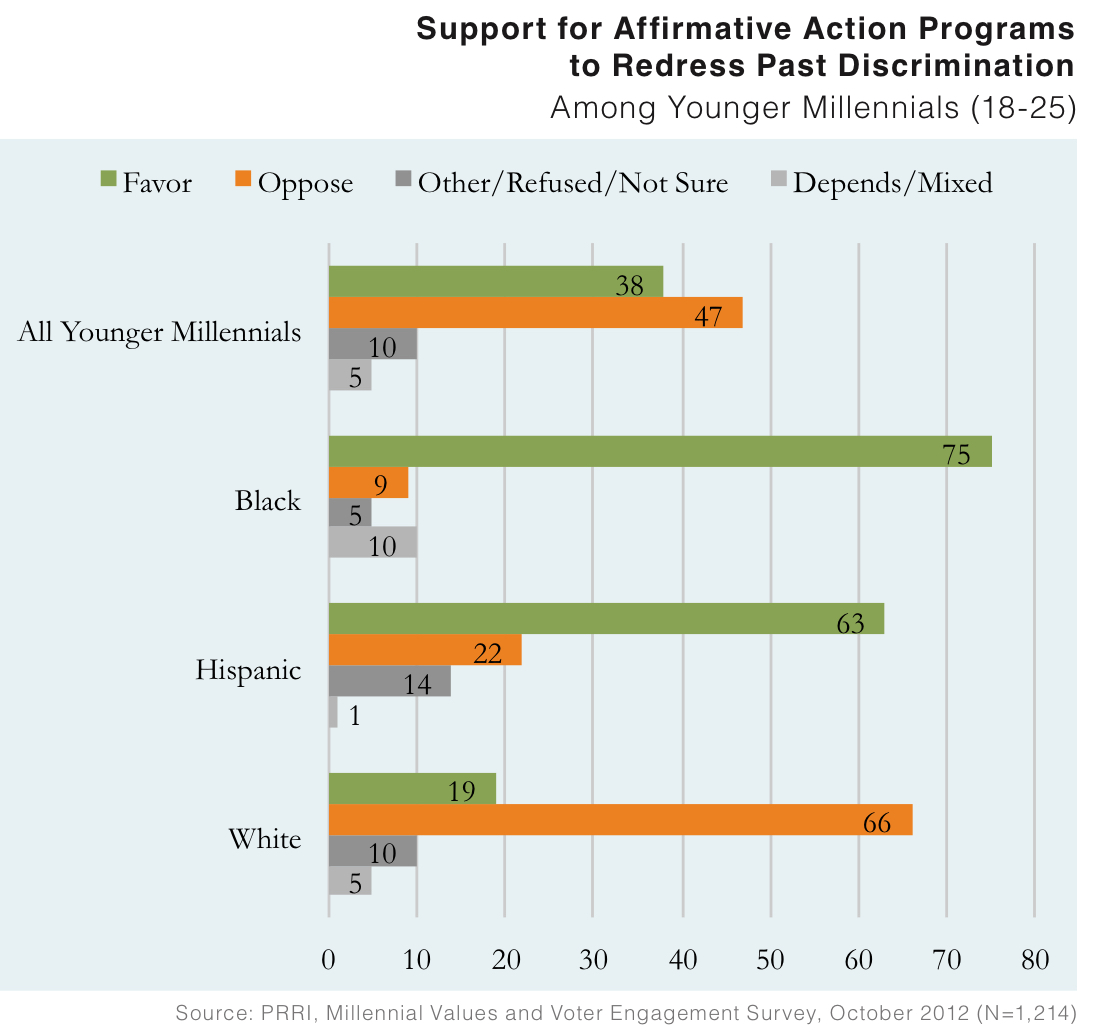
The racial differences on this question are striking. Less than one-in-five (19%) white Millennials favor programs designed to help blacks and other minorities get ahead because of past discrimination, while nearly two-thirds (66%) are opposed. By contrast, three-quarters (75%) of black Millennials and more than six-in-ten (63%) Hispanic Millennials favor such programs.
There are also strong partisan divisions. Roughly 1-in-10 (12%) Republican Millennials favor programs that make special efforts to help blacks and other minorities get ahead because of past discrimination, while nearly 8-in-10 (78%) are opposed. Six-in-ten (62%) Millennial Democrats favor such programs, while less than 3-in- 10 (28%) are opposed. There are, however, significant racial divides among Millennial Democrats; less than half (48%) of white Millennial Democrats support these programs, compared to 72% of non-white Millennial Democrats.
Attitudes toward affirmative action among religious groups generally fall along racial and ethnic lines. Nearly 8-in-10 white Catholic Millennials (78%), three-quarters (74%) of white evangelical Protestant Millennials, and 7-in-10 (70%) white mainline Protestant Millennials oppose affirmative action programs. By contrast, more than 6-in-10 (63%) minority Protestant Millennials support these programs. Religiously unaffiliated Millennials are divided: 45% oppose affirmative action programs, while a similar number (42%) are in favor.
Affirmative Action in College Admissions
While about four-in-ten (38%) younger Millennials support affirmative action programs in general, support for such programs diminishes considerably when asked specifically about affirmative action for college admissions. Nearly 7-in-10 (69%) younger Millennials believe that blacks and other minorities should not receive preference in college admissions to make up for past inequalities, while around 1-in-5 (19%) younger Millennials favor such programs.
White Millennials are strongly opposed to affirmative action in college admissions, while black and Hispanic Millennials are more divided. Less than 1-in-10 (8%) white Millennials believe that blacks and other minorities should receive preference in college admissions, while more than 8-in-10 (83%) are opposed. By contrast, more than 4-in-10 (42%) black Millennials believe that blacks and other minorities should receive preference in college admissions to make up for past inequalities, while a similar percentage (44%) think they should not. Nearly 4-in- 10 (39%) Hispanic Millennials think blacks and other minorities should receive preference in college admissions, while 47% are opposed.
There is bipartisan opposition to affirmative action in college admissions, but there remain varying degrees of intensity. At least 6-in-10 (61%) Millennial Democrats, Millennial Independents (70%), and Millennial Republicans (90%) oppose affirmative action in college admissions.
All major religious groups oppose programs that would give preference in college admissions to blacks and other minorities. White evangelical Protestant Millennials (93%), white Catholic Millennials (89%), and white mainline Protestant Millennials (87%) are most strongly opposed to affirmative action in college admissions. Nearly 7-in-10 (69%) religiously unaffiliated Millennials are also opposed to affirmative action. A slim majority (53%) of minority Protestant Millennials oppose programs that give preference in college admissions to blacks and other minorities, while 32% are in favor.
Affirmative Action for Specific Groups
Younger Millennials do not, overall, believe that any one group should be singled out for preference in college admissions or in hiring. At least 7-in-10 younger Millennials believe that Asian Americans (75%), black Americans (71%), gay and lesbian people (77%), Hispanic Americans (72%), and women (70%) should not be given preference in college admissions and in hiring.
As with the previous two questions on affirmative action, there are significant racial divisions. At least eight-in-ten white Millennials agree that none of these groups should be given preference in college admissions and in hiring (ranging from a low of 82% for women and a high of 88% for Asian Americans, gays and lesbians, and Hispanic Americans; the figure for black Americans was 85%).
Black Millennials are divided about whether preference should be given for Hispanic Americans (46% should, 48% should not) and black Americans (46% should, 49% should not). A majority of black Millennials think that neither women (53%), nor Asian Americans (58%), nor gay and lesbian people (60%) should be given preference in college admissions and in hiring.
Hispanic Millennials are divided on whether preferences should be given to Hispanic Americans (49% should, 43% should not), black Americans (46% should, 49% should not), and women (45% should, 47% should not) in college admissions and in hiring. However, a majority of Hispanic Millennials believe that Asian Americans (52%) and gay and lesbian people (58%) should not be given preference.
Rationale for Affirmative Action Programs
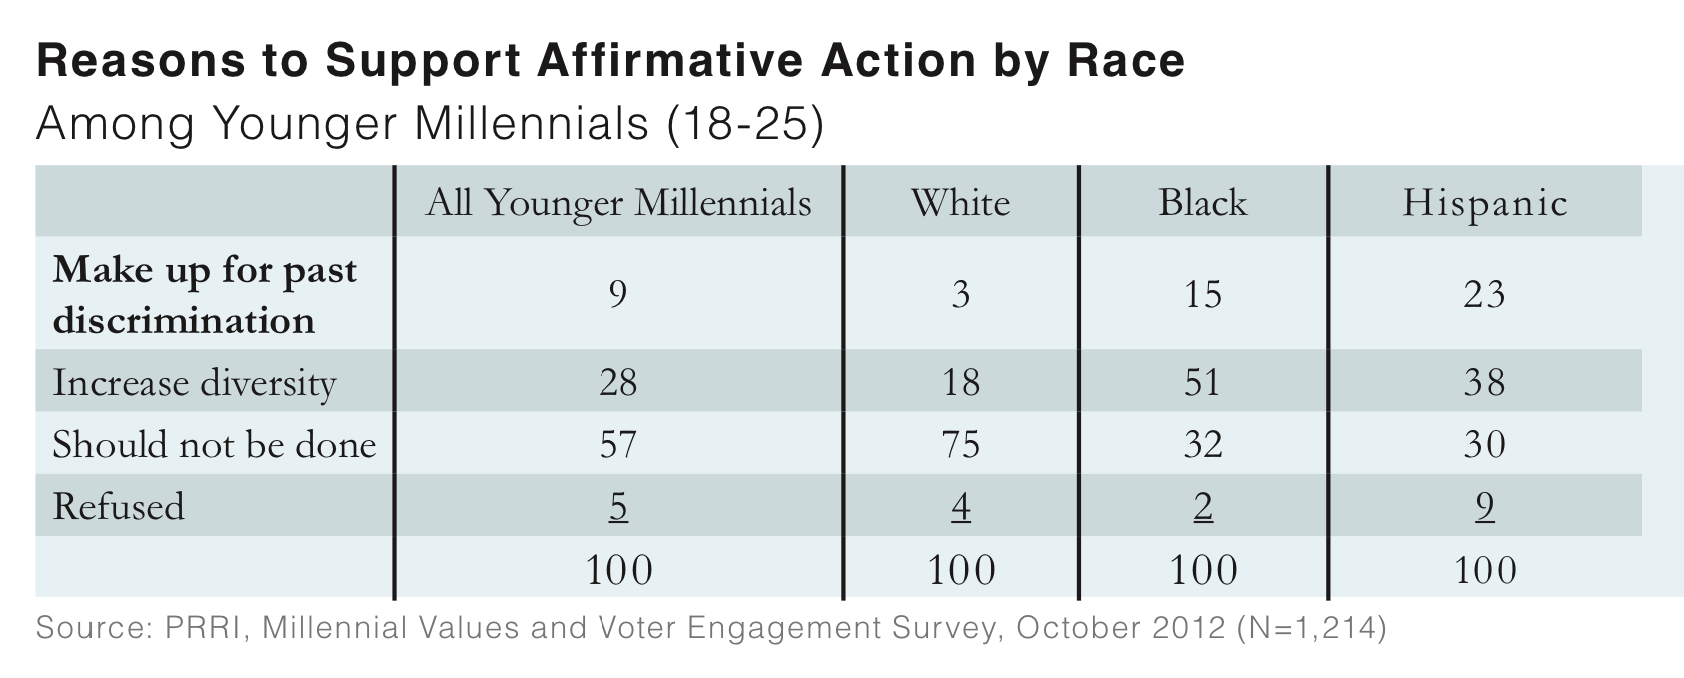
Younger Millennials are three times more likely to say that affirmative action programs should be implemented to increase diversity (28%) than to say it should be implemented to make up for past discrimination (9%). However, nearly 6-in-10 (57%) younger Millennials say there should be no preferences in college admissions or hiring.
There are no differences between Millennial men and women, but there are significant racial divisions. A slim majority (51%) of black Millennials say preferences in college admissions and hiring should be made to increase diversity, compared to 15% who say they should be made to make up for past discrimination. Similarly, roughly 4-in-10 (38%) Hispanic Millennials think that preferences in college admissions and in hiring should be made to increase diversity, compared to 1-in-4 (25%) who say they should be made to make up for past discrimination. Roughly 3-in-10 black Millennials (32%) and Hispanic Millennials (30%) say preferences should not be made at all. Less than 1-in-5 (18%) white Millennials say preferences should be made to increase diversity, and 3% think they should be made to make up for past discrimination. Three-quarters (75%) of white Millennials say preferences in hiring and in college admissions should not be made at all.
Close to half (45%) of Millennial Democrats say that preferences should be made to increase diversity, while only 10% say they should be made to make up for past discrimination. Close to half (45%) say preference should not be made at all. Few Millennial Republicans believe that preferences should be made to increase diversity (10%) or to make up for historic discrimination (5%). More than 8-in-10 (84%) Millennial Republicans say there should be no preferences in college admissions and hiring. Millennial Independents fall in between: more than one-quarter (26%) favor preferences to increase diversity, and slightly more than 1-in-10 (12%) favor preferences to make up for past discrimination, while nearly 6-in-10 (59%) do not support preferences in hiring and college admissions at all.
Effect of Race or Gender on College Admissions
Although most younger Millennials are firmly opposed to affirmative action programs in college admissions, relatively few report that they were hurt in the college admissions process because of their race or gender. Fifteen percent of Millennials say they were hurt by their race or gender, while about 1-in-10 (8%) say they were helped by these policies. Nearly 7-in-10 (69%) say their race or gender did not affect them in the college admissions process.
There are modest differences by race, but no significant differences by gender. About 1-in-5 (18%) white Millennials report that they were hurt in the college admissions process because of their race or gender. Seven-in-ten (70%) say it didn’t make a difference. Interestingly, black Millennials are equally as likely to say that their race or gender hurt them (10%) as they are to say that their race or gender helped them (9%). Nearly 1-in-5 (18%) Hispanic Millennials believe that their race or gender helped them (18%), while 11% believe their race or gender hurt their admissions prospects.
There are no major differences by party affiliation. Approximately 7-in-10 Millennial Democrats (72%), Republicans (72%), and Independents (70%) report that their race or gender made no difference in the college admissions process.
Effect of Race or Gender on Future Career Prospects
Perhaps one reason younger Millennials show lower support for affirmative action programs than their political and social profile might suggest is that most Millennials simply do no think their race or gender will have an effect on their future career prospects. More than 6-in-10 (63%) Millennials believe that their gender or race will make no difference in their career, while 12% think it will help them, and 18% think it will hurt them.
There are modest differences by race, but no divisions by gender. Majorities of white (67%), black (54%), and Hispanic (57%) Millennials say that their race or gender will make no difference in their future career prospects. White Millennials are slightly more likely to say their careers will be hurt (16%) than helped (10%) by their race or gender. Black Millennials are four times more likely to say their careers will be hurt (33%) rather than helped (8%) by their race or gender. By contrast, significantly more Hispanic Millennials believe they will be helped (22%) rather than hurt (13%) by their race or gender.
Millennial women (64%) are about equally as likely as Millennial men (61%) to say that their race or gender will make no difference for their career. Less than 1-in-5 Millennial men (15%) and less than 1-in-10 (9%) Millennial women say they will be helped in their career by their race or gender, while around 1-in-5 Millennial men (15%) and Millennial women (21%) say they will be hurt.
Nearly one-quarter (24%) of Millennials with a college degree think that they will be helped in their career by their race or gender, at least twice the rate of those with a high school education or less (12%) and those with some college (9%).
III. The Efficacy of Democratic Participation
Pessimism About Politicians, the Democratic Process, and Government
Overall, younger Millennials (age 18-25) exhibit a high degree of pessimism about elected officials, the democratic process, and the government. More than 8-in-10 (81%) younger Millennials believe that elected officials in Washington lose touch with people pretty quickly, and nearly two-thirds (64%) agree that we need new people in Washington even if they are not as effective as experienced politicians. Similarly, more than 6-in-10 (63%) younger Millennials agree that “people like me don’t have any say about what the government does,” while more than 8-in-10 (82%) believe that business corporations have too much influence on the political process. More than 6-in-10 (61%) Millennials reject the idea that “the government is really run for the benefit of all the people,” and Millennials are six times more likely to say they think about government as “the” government (86%) rather than “our” government (12%).
This significant disaffection with the government and the political system cuts across political affiliation, race, religious affiliation, and gender. However, there are significant differences among demographic subgroups, particularly with respect to the intensity of their opinion.
Although majorities of younger Millennials from all racial and ethnic groups agree that “people like me don’t have any say in what the government does,” there are varying degrees of intensity. White (65%) and Hispanic (68%) Millennials are more likely than black Millennials (51%) to agree with this statement.
Although there is bipartisan agreement that business corporations have too much influence on the political process, younger Millennials exhibit differing degrees of intensity. Nearly 9-in-10 (88%) Millennial Democrats and more than 8-in-10 (84%) Independent Millennials agree that business corporations have too much influence, while roughly 7-in-10 (71%) Millennial Republicans say the same.
There are also varying levels of intensity between younger Millennial men and women. Seven-in-ten (71%) Millennial men agree that we need new people in Washington even if they are not as effective as experienced politicians, compared to 57% of younger Millennial women.
Optimism About the Efficacy of Voting and Impact on Voter Engagement
Despite their pessimism about government and politicians, more than two-thirds (68%) of younger Millennials nonetheless say that “voting gives people like me some say about how government runs things.” Younger Millennials who are affiliated with one of the two major political parties are more likely to articulate confidence in the power of their vote than younger Millennials who identify as politically Independent. While about 8-in-10 Millennial Democrats (77%) and Millennial Republicans (81%) believe that voting gives people like them some say about how the government runs things, only 56% of Millennial Independents agree.
Younger Millennials who say they were taken to the voting booth as children are also more optimistic about the power of their vote. More than three-quarters (76%) of younger Millennials who were taken to the voting booth by their parents as children agree that voting gives people like them some say about how the government runs things, compared to about 6-in-10 (62%) of those who did not accompany their parents to the voting booth.
There is a strong connection between vote registration status among younger Millennials and views about the relevance of voting. Three-quarters (75%) of younger Millennials who are registered to vote agree that voting gives people like them some say about how the government runs things, compared to roughly half 52% of those who are not registered.
A similar pattern exists with regard to Millennials’ self-reported likelihood of voting. Nearly 8-in-10 (79%) younger Millennials who say they are certain to vote in the presidential election agree that voting gives people like them some say about how the government runs things, compared to 41% of younger Millennials who say they are not likely to vote.
Pessimism About the Long-term Stability of Social Security
One additional measure about confidence in government is how certain younger Millennials are that government programs will be there when they need them. Less than 3-in-10 (27%) younger Millennials say they are confident that Social Security will be there for them when they retire, while nearly 7-in-10 (69%) say they are not confident about this. Majorities of younger Millennials across gender, race, and religious and political affiliations report that they are not confident that Social Security will be there for them when they retire. There are, however, some varying degrees of intensity among demographic subgroups.
White Millennials (21%) are significantly less likely than Hispanic (36%) and black (35%) Millennials to say that Social Security will be there for them when they retire. Millennial Democrats (36%) are more confident than Millennial Republicans (27%) and Independents (24%) that Social Security will be there for them when they retire.
There are also significant differences by level of educational attainment and religious affiliation. Younger Millennials with a high school education or less (33%) are more confident than those with a bachelor’s degree or higher (17%) that Social Security will be there when they retire. Similarly, minority Protestant Millennials (33%) and religiously unaffiliated Millennials (32%) are more confident than white evangelical Protestant Millennials (19%) and white mainline Protestant Millennials (15%) that Social Security will be there for them when they retire.
Economic Issues: Health Care and Taxes
The 2010 Health Care Law
Younger Millennials are divided on whether the 2010 health care law should be repealed and eliminated, with 46% in favor and 50% opposed. There are substantial differences by race, party affiliation, and religious affiliation.
A majority (59%) of white Millennials favor repealing the 2010 health care law while 37% are opposed. By contrast, approximately three-quarters (76%) of black Millennials and more than 6-in-10 (63%) Hispanic Millennials oppose eliminating and repealing the health care law.
More than 8-in-10 (82%) Millennial Republicans favor repealing and eliminating the health care law. Roughly three-quarters of Millennial Democrats (76%) say the law should not be repealed. Millennial Independents are divided, with half (50%) in favor of repealing the law and 48% opposed.
Eight-in-ten (80%) white evangelical Protestants Millennials, two-thirds (67%) of white mainline Protestant Millennials, and more than 6-in-10 (64%) white Catholic Millennials favor repealing and eliminating the 2010 health care law. Catholic Millennials are divided, with a slim majority (52%) in favor of repealing the law, while 46% are opposed. Around two-thirds of minority Protestant Millennials (67%) and religiously unaffiliated Millennials (65%) say the 2010 health care law should not be repealed.
The Buffett Rule
There is strong support among younger Millennials for a policy popularly known as the Buffett Rule, which would increase taxes on Americans making at least $1 million per year. Seven-in-ten (70%) Millennials favor increasing the tax rate on Americans earning more than $1 million a year, while 27% are opposed.
There are few differences among younger Millennials on this question, although there are some variations in intensity by political affiliation. Millennial Democrats (85%) and Independents (71%) are more likely than Millennial Republicans (51%) to favor increasing the tax rate on Americans earning more than $1 million a year.
Majorities of all religious groups, including 77% of religiously unaffiliated Millennials, 75% of Catholic Millennials overall, 72% of white mainline Protestant Millennials, 68% of white Catholic Millennials, 62% of minority Protestant Millennials, and 60% of white evangelical Protestant Millennials, favor increasing the tax rate on Americans earning more than $1 million a year.
IV. Social Issues
Same-sex Marriage
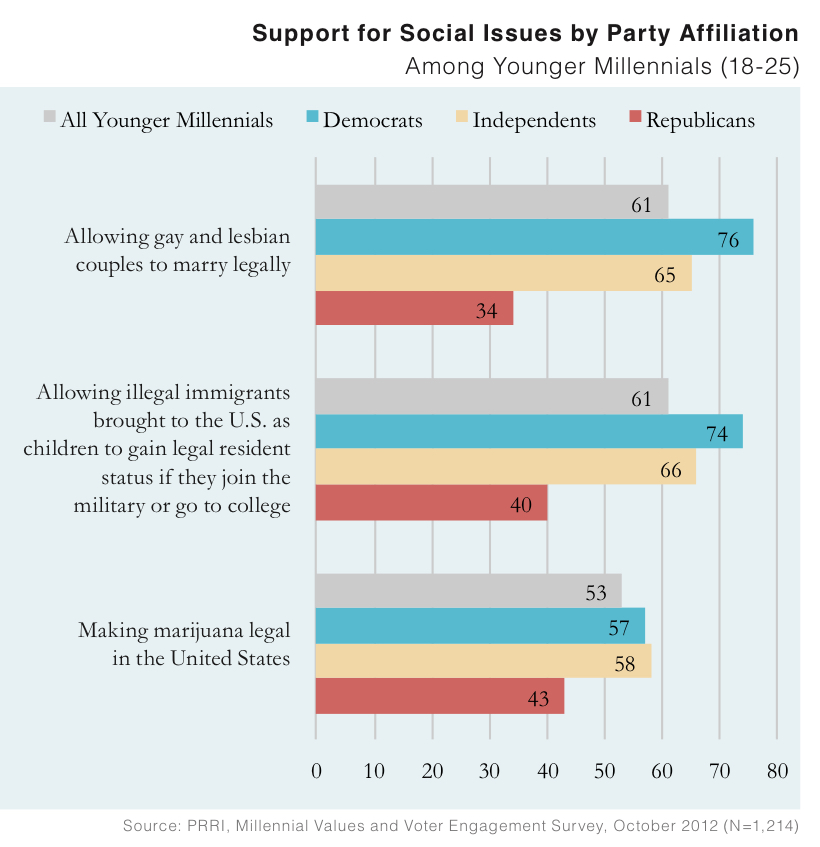
More than 6-in-10 (61%) younger Millennials (age 18-25) support allowing gay and lesbian couples to marry legally, while 36% are opposed. This is roughly the same level of support for same-sex marriage that younger Millennials articulated in March 2012.
There are substantial divisions among younger Millennials on the issue of same-sex marriage. Millennial Democrats (76%) and Independents (65%) are significantly more likely than Millennial Republicans (34%) to favor allowing gay and lesbian couples to marry legally.
Majorities of religiously unaffiliated Millennials (78%), Catholic Millennials overall (76%), white Catholic Millennials (68%), and white mainline Protestant Millennials (67%) support same-sex marriage. By contrast, majorities of minority Protestant Millennials (57%) and white evangelical Protestant Millennials (61%) oppose same-sex marriage.
Millennial women (67%) are more likely than Millennial men (54%) to support allowing gay and lesbian couples to marry legally.
Obama’s decision to publicly support same-sex marriage has had little effect on younger Millennials’ opinions. In March 2012, roughly 6-in-10 (59%) Millennials reported that they were in favor of allowing gay and lesbian people to marry, compared to 61% in the current survey. There are also no significant differences in the opinions of black Millennials (49% favored same-sex marriage in March compared to 46% currently) or Millennial Democrats (74% favored this policy in March compared to 76% currently) over this period.
Marijuana
A majority (53%) of younger Millennials favor making marijuana legal in the United States, while 44% are opposed. There are no significant differences by race, gender, or educational attainment on this question; however, there are some divisions by political affiliation and religious affiliation. Nearly 6-in-10 Millennial Independents (58%) and Millennial Democrats (57%) favor the legalization of marijuana, compared to about 4-in-10 (43%) Millennial Republicans. Nearly 6-in-10 (58%) Millennial Republicans are opposed.
Majorities of religiously unaffiliated Millennials (68%), Catholic Millennials overall (60%), white Catholic Millennials (57%), and white mainline Protestant Millennials (53%) favor the legalization of marijuana. Minority Protestant Millennials are divided, with 46% in favor of the legalization of marijuana and a slim majority (53%) opposed. Only 35% of white evangelical Protestant Millennials favor the legalization of marijuana, while 62% are opposed.
The DREAM Act
More than 6-in-10 (61%) younger Millennials favor the basic tenets of the DREAM Act (“allowing illegal immigrants brought to the U.S. as children to gain legal resident status if they join the military or go to college”).
There are clear divisions by political affiliation on this question. Millennial Democrats (74%) and Independents (66%) are substantially more likely than Millennial Republicans (40%) to support the central elements of the DREAM Act.
Although majorities of all racial and ethnic groups support the central tenets of the DREAM Act, there are some variations in intensity. Hispanic (78%) and black (72%) Millennials are more likely than white Millennials (53%) to support the basic elements of the DREAM Act.
There are also substantial divisions by religious affiliation. Majorities of minority Protestant Millennials (75%), religiously unaffiliated Millennials (67%), Catholic Millennials overall (63%), and white mainline Protestant Millennials (51%) support allowing illegal immigrants brought to the U.S. as children to gain legal resident status if they join the military or go to college. By contrast, less than half of white Catholic Millennials (41%) and white evangelical Protestant Millennials (42%) support this policy.
Millennial women (67%) are more likely than Millennial men (54%) to favor the basic tenets of the DREAM Act.
Endnotes
1 The original sample was comprised of younger Millennials, age 18-24. In the time that elapsed between the first survey and the second, however, some of the sample turned 25. The age range has been modified to reflect this.
2 Public Religion Research Institute, 2012 Race, Class, and Culture Survey, September 2012. http://publicreligion.org/research/2012/04/millennial-values-survey-2012
3 These results are based on fewer than 100 black Millennial voters (N=85) and should be interpreted with caution.
4 There are too few white Millennial voters in the Northeast to analyze.
5 This section includes only Millennials who reported that they are currently registered to vote.
Recommended citation:
Jones, Robert P., Daniel Cox, and Juhem Navarro-Rivera. “Diverse, Disillusioned, and Divided: Millennial Values and Voter Engagement in the 2012 Election.” PRRI. 2012. http://www.prri.org/research/millennial-values-voter-engagement-2012/.