Executive Summary
 The results of this survey are based on telephone interviews conducted between August 2, 2012 and August 15, 2012, among a random sample of 2,501 adults living in the continental United States. The survey includes a special focus on white working-class Americans, who are defined as non-Hispanic white Americans without a four-year college degree who hold non-salaried jobs, and make up roughly one-third (36%) of all Americans.
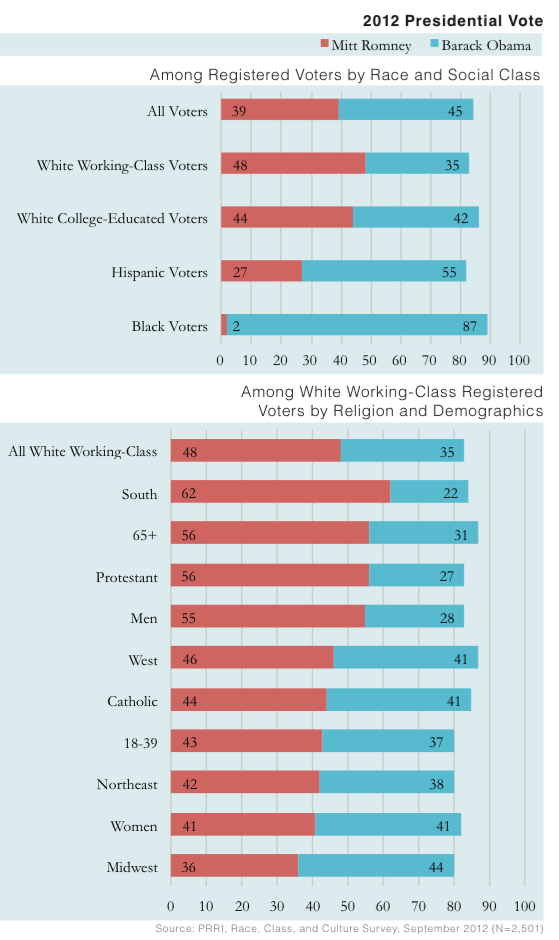
In mid-August, Governor Mitt Romney held a double-digit advantage over President Barack Obama among white working-class voters (48% vs. 35%), while white college-educated voters were nearly evenly divided in their voting preferences (44% supporting Romney vs. 42% supporting Obama). However, white working-class voters are not monolithic and their preferences varied substantially by region, religious affiliation, and gender.
In mid-August, Romney held a commanding 40-point lead over Obama among white working-class voters in the South (62% vs. 22%). However, neither candidate held a statistically significant lead among white working-class voters in the West (46% Romney vs. 41% Obama), Northeast (42% Romney vs. 38% Obama), or the Midwest (36% Romney vs. 44% Obama).
Romney enjoyed a 2-to-1 advantage over Obama among white working-class Protestant voters (56% vs. 27%), but white working-class Catholic voters were nearly evenly divided (44% Romney vs. 41% Obama).
White working-class men favored Mitt Romney over Barack Obama by a margin of nearly 2-to-1 (55% vs. 28%), but white working-class women were evenly divided between Romney and Obama (41% each).
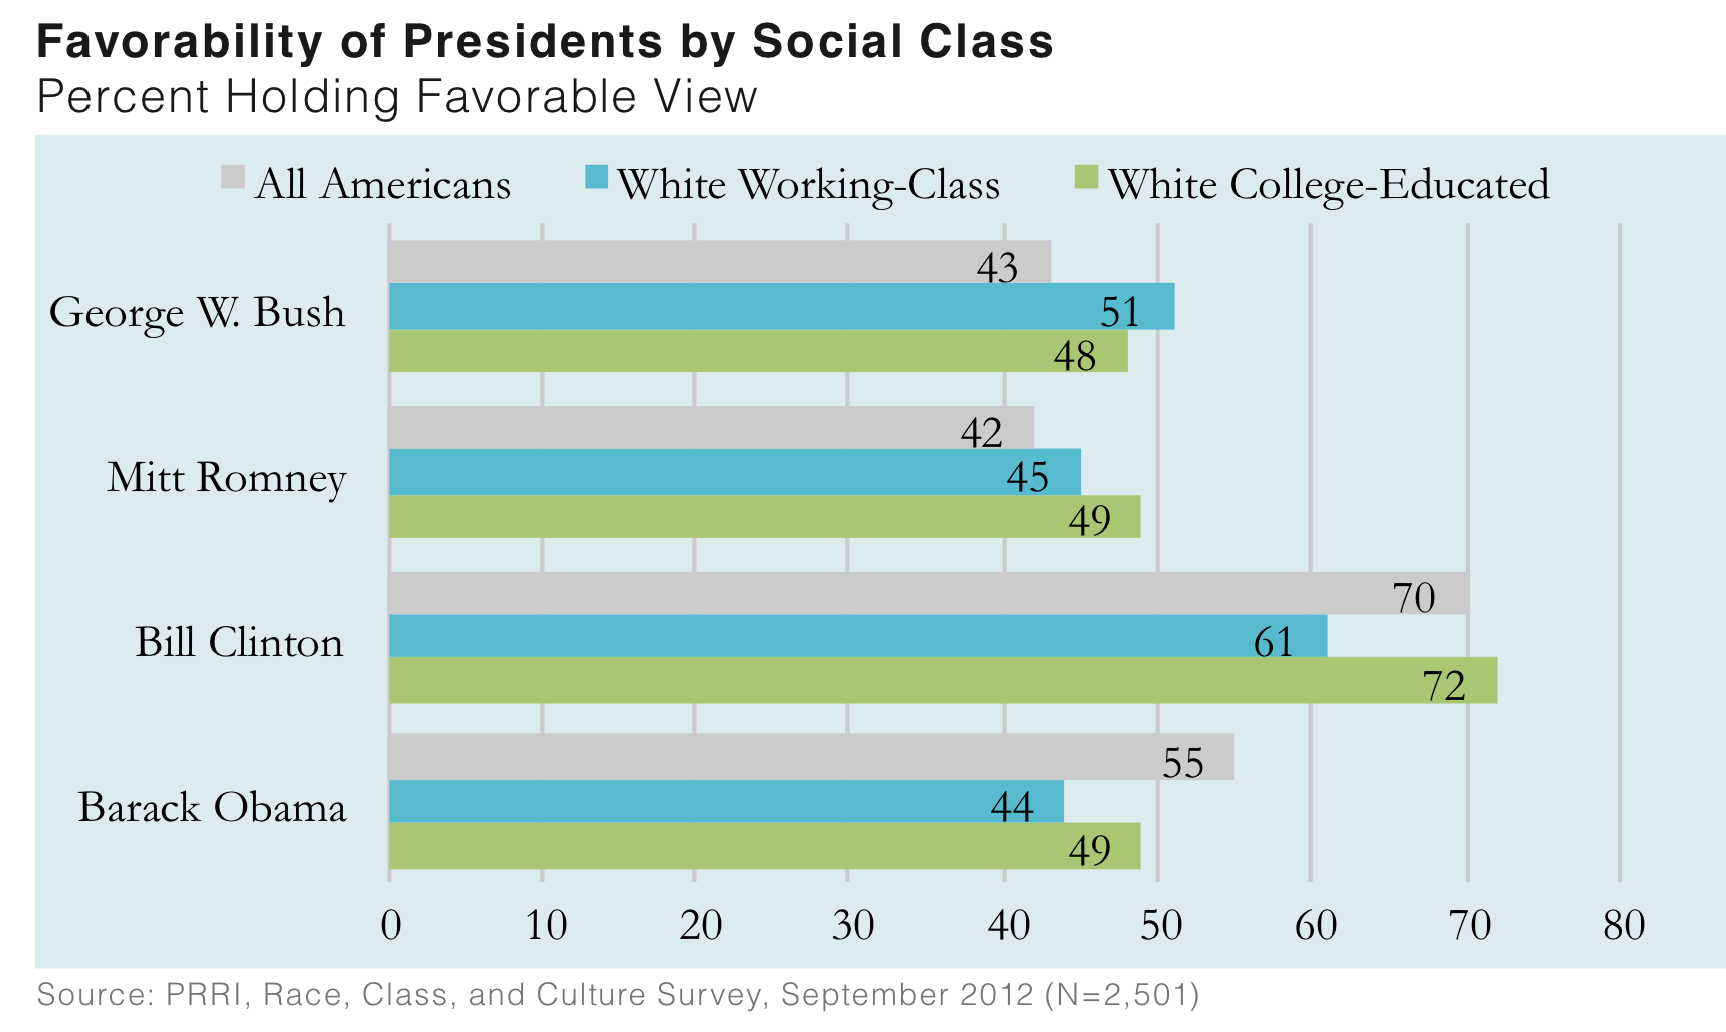
Despite Romney’s overall lead among white working-class voters, neither candidate holds strong appeal. Less than half of white working-class Americans have a favorable view of Obama (44%) or Romney (45%). By contrast, over 6-in-10 (61%) white working-class Americans have a favorable opinion of former President Bill Clinton, and a slim majority (51%) have a favorable opinion of former President George W. Bush.
Despite working more hours than white college-educated Americans (51 hours vs. 46 hours), white working-class Americans are more likely to report that they are in worse financial shape. Approximately two-thirds of white working-class Americans report being in fair (39%) or poor shape (27%) financially. By contrast, over 6-in-10 white college-educated Americans say they are in good (51%) or excellent (12%) financial shape.
One-in-five (20%) white working-class Americans do not have health insurance. White working-class Americans who are insured are significantly less likely than white college-educated Americans to say they receive health insurance through their employer or their spouse’s employer (47% vs. 69%). More than one-third (36%) of white working-class Americans who are insured rely on government programs like Medicare and Medicaid for health insurance.
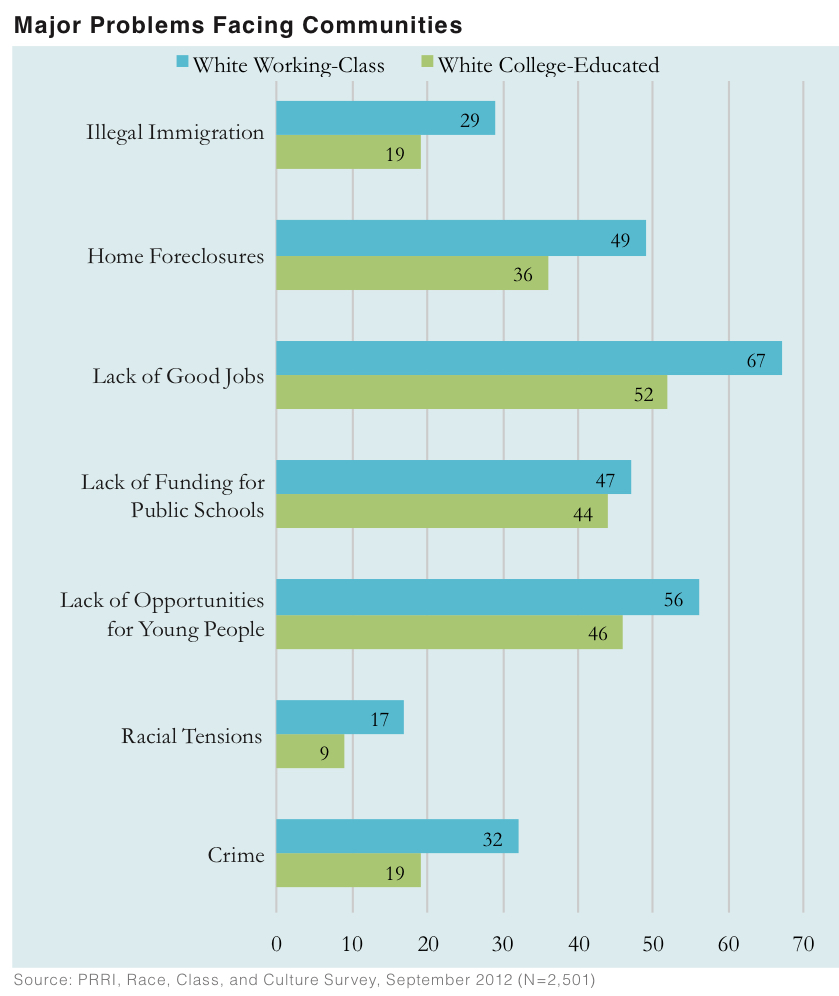
White working-class Americans are more likely than white college-educated Americans to report that a lack of good jobs (67% vs. 52%) and a lack of opportunities for young people (56% vs. 46%) are major problems facing their communities.
White working-class Americans are also significantly more likely than white college-educated Americans to report that home foreclosures (49% vs. 36%), crime (32% vs. 19%), illegal immigration (29% vs. 19%), and racial tensions (17% vs. 9%) are major problems facing their communities.
Southern white-working class Americans stand out from white working-class Americans in the Northeast, Midwest, and West on a number of cultural attitudes and attributes.
White working-class Americans in the South (62%) are more likely than white working-class Americans in the West (50%), Midwest (48%), or Northeast (38%) to live in households with firearms.
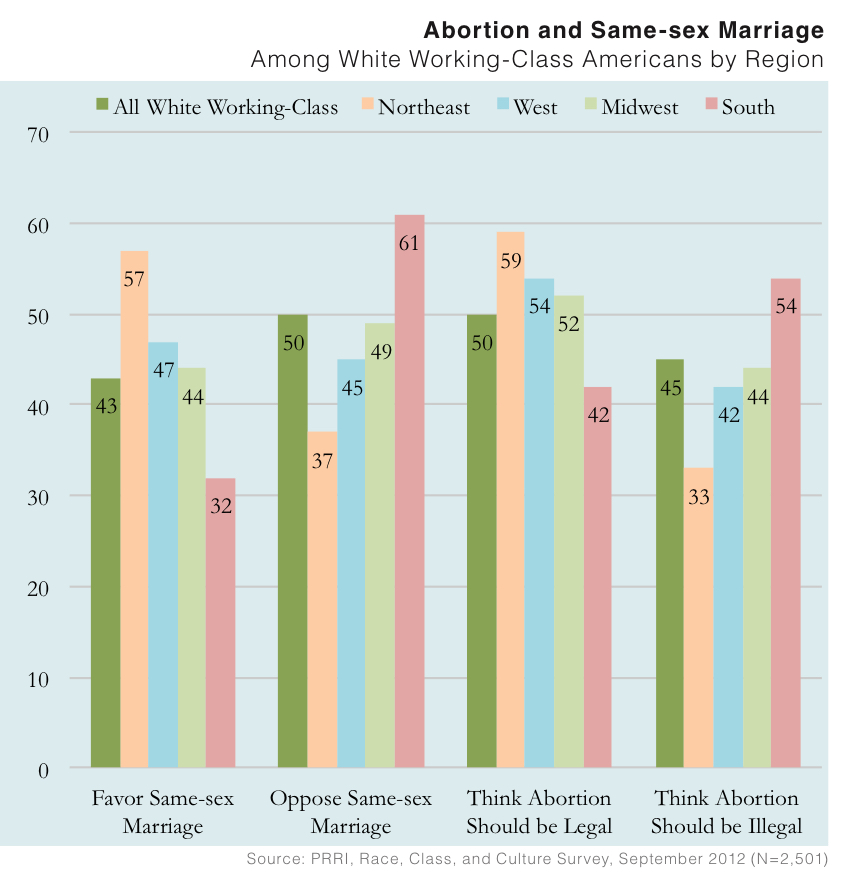
There is much greater opposition to same-sex marriage among white working-class Americans in the South than among white working-class Americans in other regions. Less than one-third (32%)of white working class Americans in the South favor allowing gay and lesbian people to marry, compared to 44% in the Midwest, 47% in the West, and 57% in Northeast.
Five Myths of the White Working Class
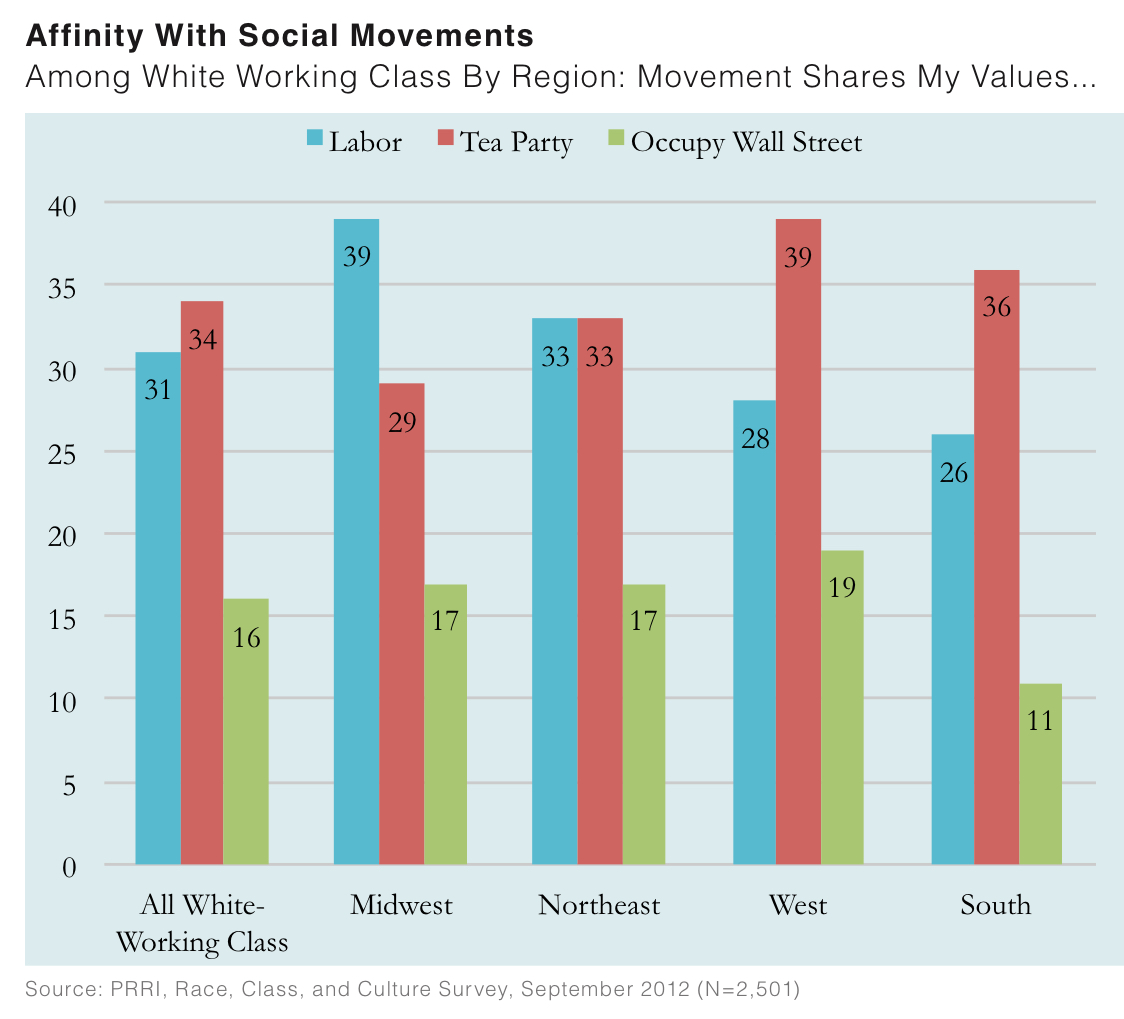
Myth 1. White working-class Americans strongly identify with the Tea Party movement. White working-class Americans (13%) are no more likely than white college-educated Americans (10%) to say they consider themselves part of the Tea Party. White working-class Americans (34%) are also about equally as likely as white college-educated Americans (31%) to say the Tea Party movement shares their values.
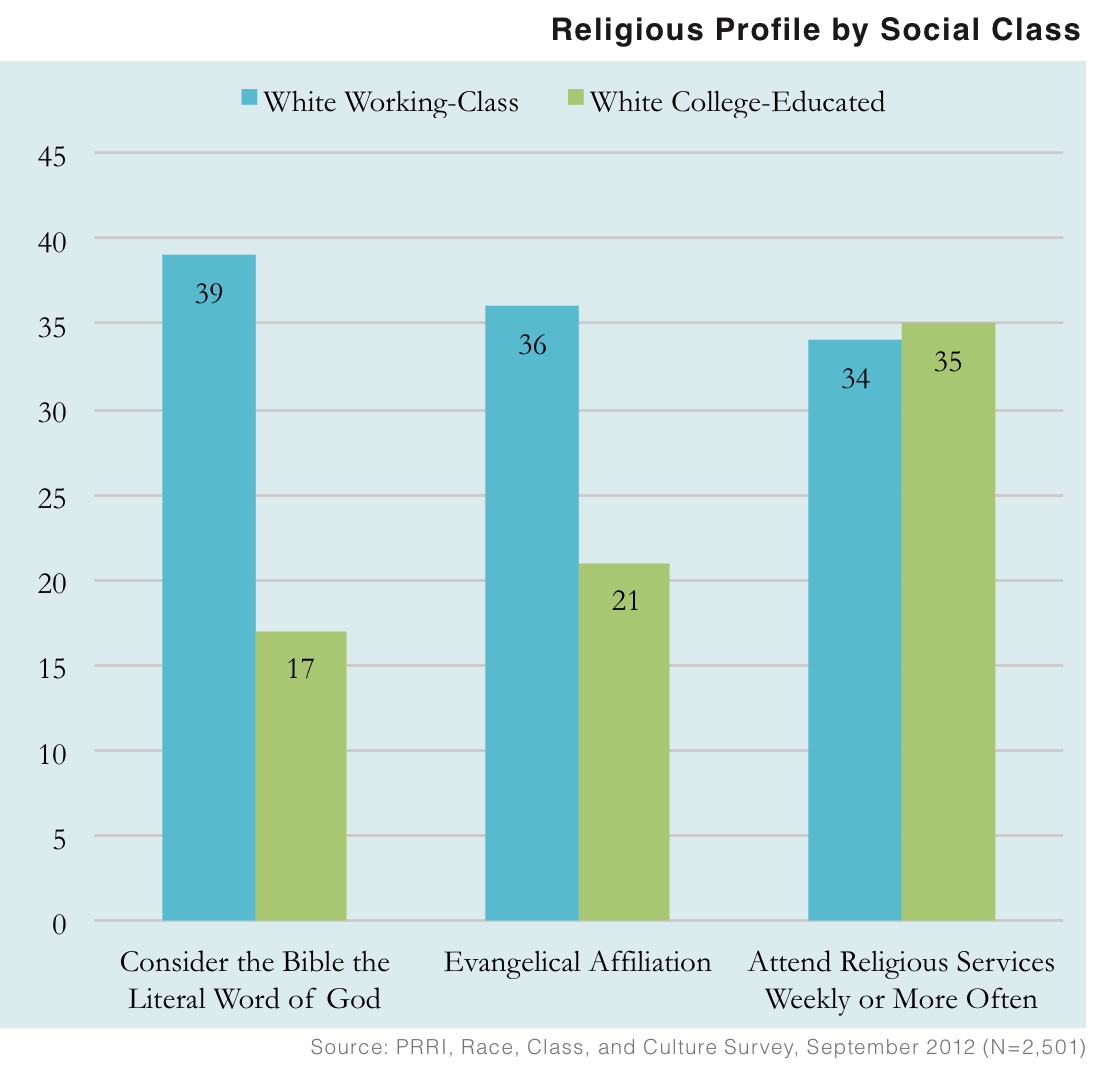
Myth 2. White working-class Americans have abandoned traditional religiosity and a strong work ethic. White working-class Americans are more likely than Americans overall to identify as white evangelical Protestants (36% vs. 21%). They do not attend religious services less frequently than Americans overall (48% vs. 50% attend at least once a month), and do not report that religion is less important in their lives (60% vs. 59% say religion is important in their lives). White working-class Americans also work hard, averaging more hours per week than white college-educated Americans (51 vs. 46).
Myth 3. White working-class Americans vote against their economic interests. Low-income white working-class Americans and white working-class Americans who have received food stamps within the last two years were significantly less likely to support Romney, whose economic plan would reduce funding for government programs like food stamps.
- White working-class voters in households that make less than $30,000 per year were nearly evenly divided in their voting preferences (39% favored Obama, 42% favored Romney). However, a majority (51%) of white working-class voters with annual incomes of $30,000 or more a year supported Romney, while 35% preferred Obama.
- Half (50%) of white working-class voters who have not reported using food stamps in the past two years supported Romney, while less than one-third (32%) supported Obama. By contrast, white working-class voters who reported receiving food stamps in the last two years preferred Obama to Romney by a significant margin (48% vs. 36%).
Myth 4. White working-class Americans are animated by culture war issues like abortion or same-sex marriage.
- White working-class Americans are somewhat divided on abortion. Half (50%) say that abortion should be legal in all or most cases, compared to 45% who say it should be illegal in all or most cases.
- While half (50%) of white working-class Americans are opposed to allowing gay and lesbian couples to marry legally, more than 4-in-10 (43%) favor same-sex marriage.
- Only 1-in-20 white working-class Americans say that either abortion (3%) or same-sex marriage (2%) is the most important issue to their vote. By contrast, a majority (53%) of white working-class Americans say the economy is their most important voting issue.
Myth 5. White working-class Americans embrace unfettered free market capitalism.In fact, white working-class Americans display a strong strain of economic populism.
- Seven-in-ten (70%) white working-class Americans believe the economic system in this country unfairly favors the wealthy, and a majority (53%) say that one of the biggest problems in this country is that we don’t give everyone an equal chance in life.
- A plurality (46%) of white working-class Americans believe that capitalism and the free market system are at odds with Christian values, while 38% disagree.
- Nearly 8-in-10 white working-class Americans say that corporations moving American jobs overseas are somewhat (25%) or very (53%) responsible for Americans’ current economic distress.
- Over 6-in-10 (62%) white working-class Americans favor raising the tax rate on Americans with household incomes of over $1 million per year.
Confirming Five Pieces of Conventional Wisdom
1. White working-class Americans embrace different consumer preferences, lifestyle choices, and parenting choices than white college-educated Americans.
- A majority (56%) of white working-class Americans report that they would prefer to shop at Walmart as opposed to Target, while 6-in-10 (60%) white college-educated Americans say the reverse.
- Only 31% of white working-class Americans have a close friend or family member who is vegetarian, compared to a majority (53%) of college-educated Americans.
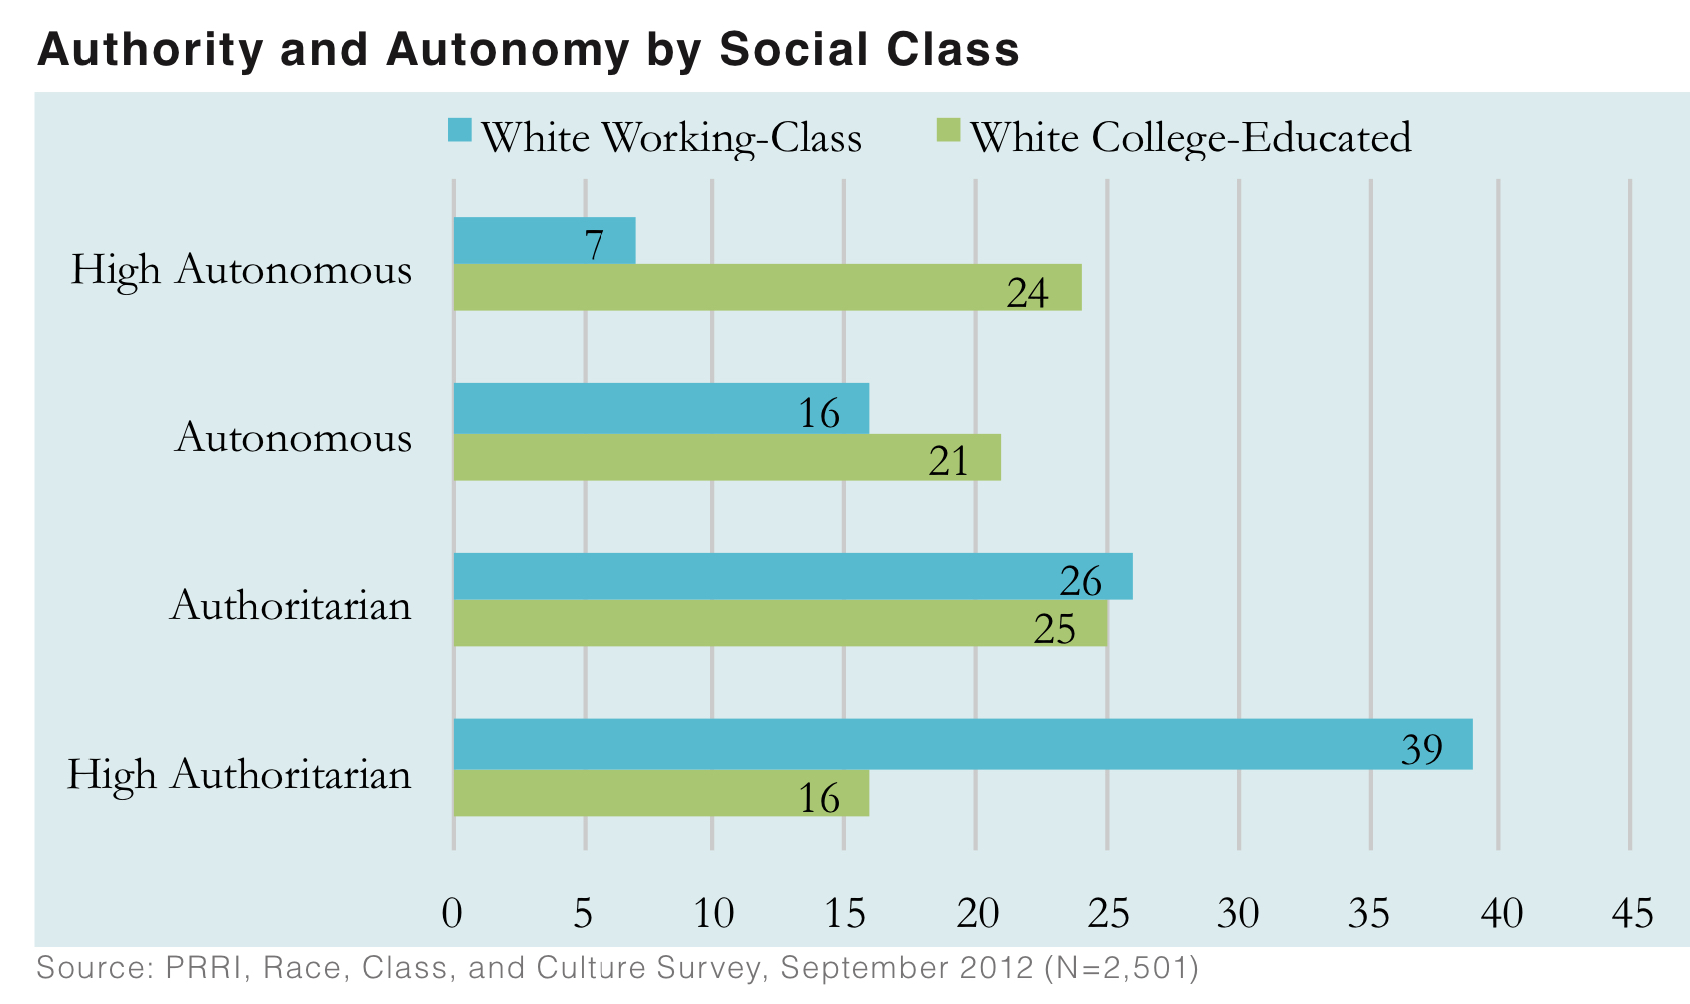
White working-class Americans are more likely than white college-educated Americans to value deference to authority over autonomy. When asked to choose between pairs of traits that emphasize children’s autonomy versus deference to parental authority, nearly two-thirds (65%) of white working-class Americans favor authoritarian childrearing traits, compared to around 4-in-10 (41%) white college-educated Americans.
2. White working-class Americans are less likely than white college-educated Americans to feel connected to government. While a majority (51%) of white college-educated Americans say they think of the U.S. government as “our” government rather than “the” government, only 39% of white working-class Americans think about the U.S. government as “our” government.
3. White working-class Americans are more likely than white college-educated Americans to believe that blacks and other minorities have received too many advantages and government attention.
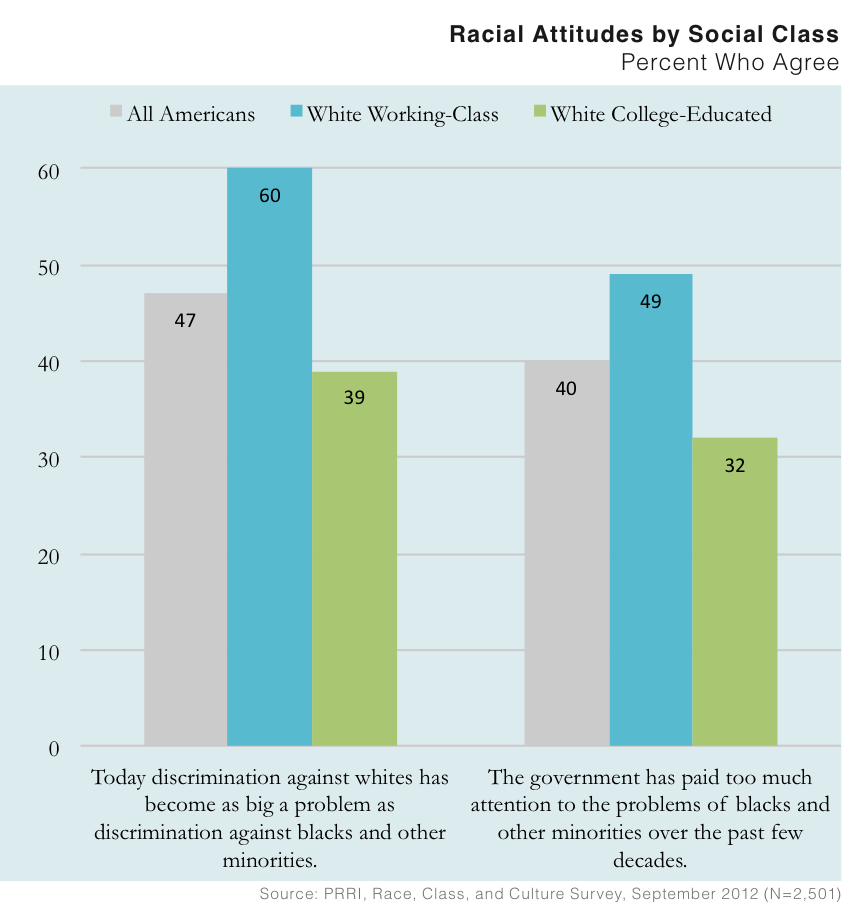
- Six-in-ten (60%) white working-class Americans agree that discrimination against whites has become as big a problem as discrimination against blacks and other minorities, compared to only 39% of white college-educated Americans.
- Nearly half (49%) of white working-class Americans agree that over the past few decades the government has paid too much attention to the problems of blacks and other minorities, compared to 32% of white college-educated Americans.
- White working-class Americans in the West (40%), Midwest (48%), and Northeast (48%) are less likely than white working-class Americans in the South (58%) to believe that over the past few decades, the government has paid too much attention to the problems of blacks and other minorities.
4. White working-class Americans have concerns about immigrants competing with them for jobs. White working-class Americans are 20 points more likely than white college-educated Americans to agree that illegal immigrants taking jobs that would otherwise be filled by American citizens are responsible for our current economic problems (57% vs. 37%).
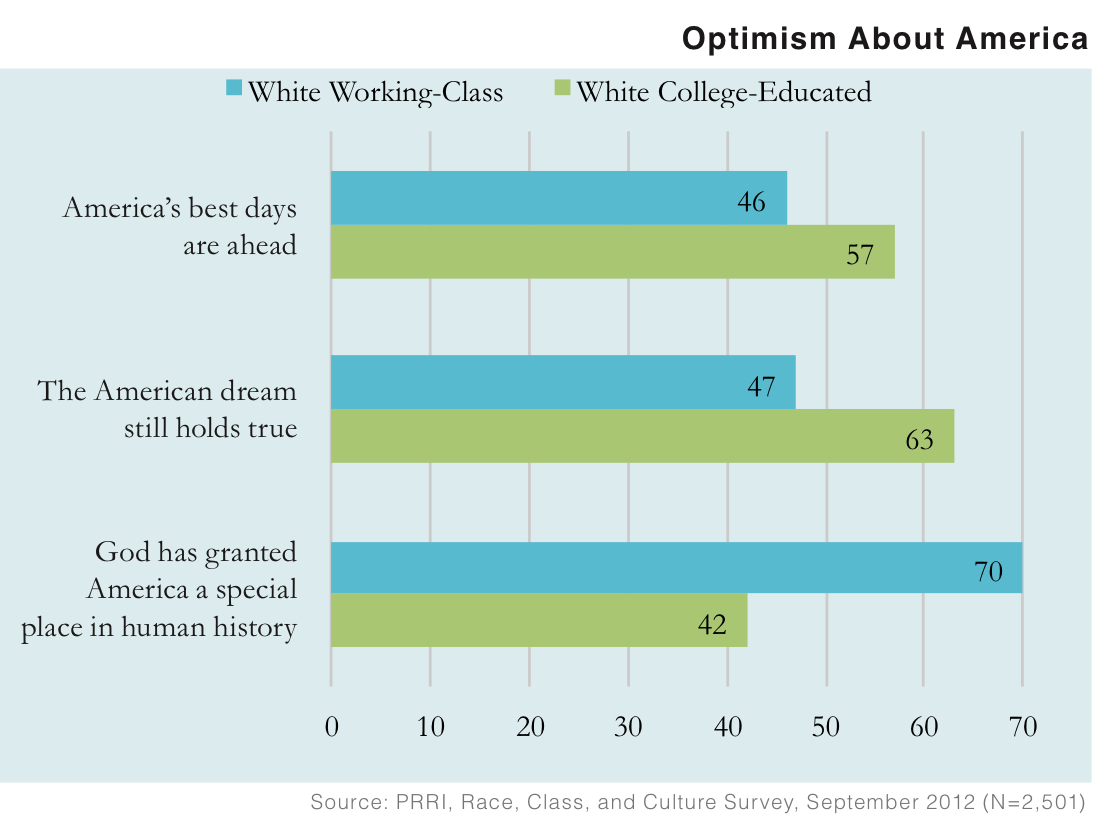
5. Despite being economically disillusioned, white working-class Americans strongly believe in American exceptionalism. Although white working-class Americans are less likely than white college-educated Americans to believe the American Dream still holds true (47% vs. 63%), they are more likely than white college-educated Americans to believe that God has granted America a special place in human history (70% vs. 42%).
I. White Working-Class Americans
Definition
Defining the white working class is a complex task, not least because of the lack of consensus about how to conceptualize and measure social class in the United States. Most definitions of social class rely on three measures, either alone or in combination: educational attainment, income, and occupation.
Definitions using a single measure have the advantage of conceptual clarity and portability across datasets, but they also have significant deficiencies (Abramowitz and Teixeira 2008, 111). Abramowitz and Teixeira note that “education by definition does not capture the actual job a given individual holds and, therefore, departs from traditional definition of class, which is rooted in the worker’s role in the economy.” It also likely overestimates the size of the white working class (McTague 2012).(1) Income is also a problematic indicator of class and shared cultural experience. As Manza and Brooks note, “[t]he part-time school teacher, the semi-skilled factory worker, the college student working part-time as a computer programmer, and the self-employed artist might all report the same income on their tax returns. But as salaried, hourly, or self-employed they have different sources of income… and ultimately very different life chances” (Manza and Brooks 1999, 56). Moreover, it is often difficult to get people to be completely forthcoming about their income on surveys—refusal rates of up to 20% are not uncommon—and income also varies widely by geographic location. Occupation provides the most direct measure of class, but as Abramowitz and Teixeira (2008) note, it has its own limitations. Occupation is notoriously difficult to measure in telephone opinion surveys, categories vary widely, and significant numbers of people are not currently in the workforce.
These classification decisions can have significant impact on the composition and especially the political identity and behavior of this important group. For instance, McTague notes that income-based definitions of the white working class tend to find stronger connections between white working class Americans and the Democratic Party, while education based definitions tend to find stronger associations with the Republican Party (McTague 2012, 12).
In light of these challenges, this report defines the white working class using a combination of race (white), ethnicity (non-Hispanic), education (less than a 4-year college degree), and occupation pay type (an occupation that pays hourly or by the job and is not salaried).(2) We include whites with some college education, rather than high school education only, because educational attainment levels across all sectors of society have risen sharply over the last several decades (Teixeira and Rodgers 2001). We also include occupation pay type as an additional criterion to ensure that people with salaried positions, which are more often associated with white-collar positions, would be excluded.
A Portrait of the White Working Class
White Working-Class Americans vs. White College-Educated Americans
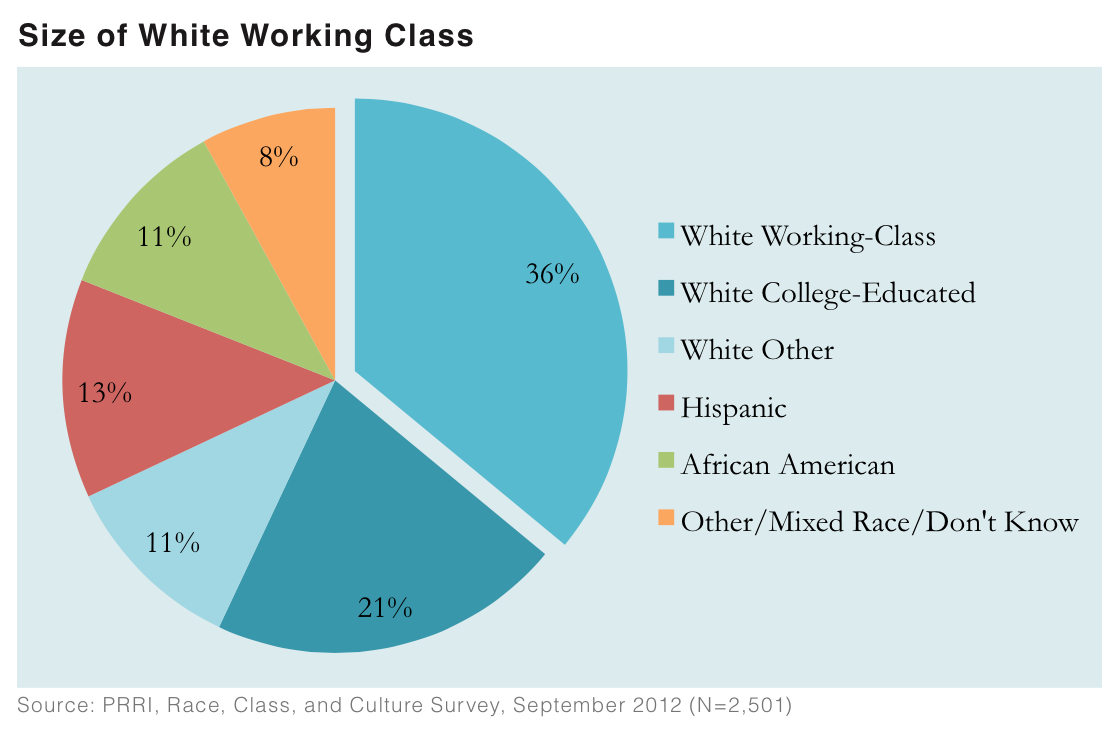
Using this definition—non-Hispanic white Americans without a four-year college degree who hold non-salaried jobs—more than one-third (36%) of all Americans and more than half (53%) of all whites are part of the white working class. By contrast, white college-educated Americans make up roughly 1-in-5 (21%) of all Americans, and roughly one-third (31%) of all white Americans.
Similarities Between White Working-Class Americans and White College-Educated Americans
Notably, white working-class Americans do not differ from white college-educated Americans in terms of age, gender, or party affiliation.
Like white college-educated Americans, white working-class Americans are nearly evenly divided by age and gender. Half (50%) of white working-class Americans are at least 50 years of age, while nearly as many (48%) are younger than 50. A slim majority (51%) of white working-class Americans are women, while 49% are men. Like white college-educated Americans (39%), a plurality of white working-class Americans identify as political Independents (38%). The rest are fairly evenly divided between white working-class Americans who identify as Republicans (30%) and those who identify as Democrats (28%). Similar numbers of white college-educated Americans identify as Republicans (30%) and Democrats (27%). There are also no differences between the two groups in terms of Tea Party affiliation: around 1-in-10 white working-class Americans (13%) and white college-educated Americans (10%) identify with the Tea Party movement.
Differences Between White Working-Class Americans and White College-Educated Americans
However, there are large differences between white working-class and white college-educated Americans in terms of their ideological, religious, and social characteristics. While the two groups’ party affiliations are similar, white working-class Americans are significantly less likely than white college-educated Americans to identify as liberal (19% vs. 28%).
White working-class Americans’ religious profile is unusual because they are more likely than white college-educated Americans to identify as evangelical Protestants. Close to 4-in-10 (36%) white working-class Americans identify as evangelical Protestant, while roughly 1-in-5 identify as either mainline Protestant (19%) or Catholic (20%). Fewer than 1-in-5 (16%) identify as religiously unaffiliated. By contrast, white college-educated Americans are nearly evenly divided between four different religious groups: evangelical Protestants (21%), mainline Protestants (23%), Catholics (23%), and religiously unaffiliated (21%).
Consistent with their strong evangelical orientation, white working-class Americans are more than twice as likely as white college-educated Americans to believe that the Bible should be taken literally, word for word (39% vs. 17%). By contrast, a plurality (43%) of white college-educated Americans believe the Bible is a book written by men and is not the word of God.
However, despite significant differences between the two groups’ religious identities and beliefs, religious attendance patterns are nearly identical. Roughly one-third (34%) of white working-class Americans say they attend worship services at least once a week, one-third (33%) attends occasionally (once or twice a month or a few times a year), and nearly one-third (32%) say they seldom or never attend church. Similarly, 35% of white college-educated Americans say they attend worship services at least weekly, while 32% say they attend occasionally, and 32% say they seldom or never attend church. White working-class Americans are significantly less likely than white college-educated Americans to be married (46% vs. 63%), and about twice as likely to be divorced (15% vs. 8%). The differences between the two groups’ marriage and divorce rates are at least to some extent a function of the greater economic insecurity facing white working-class Americans.
Nearly two-thirds (65%) of white working class Americans live in small towns or in rural areas, compared to only 4-in-10 (40%) white college-educated Americans. A majority (59%) of white college-educated Americans live in large cities or the suburbs of large cities.
White working-class Americans are more likely than white college-educated Americans to reside in the Midwest (29% vs. 23%). They are also less likely than white college-educated Americans to live in the Northeast (18% vs. 23%). White working-class Americans are about equally as likely as white college-educated Americans to live in the South and the West.
Socioeconomic Characteristics and Challenges Facing Working-Class Communities
On basic socioeconomic measures, white working-class Americans look markedly different from white college-educated Americans.
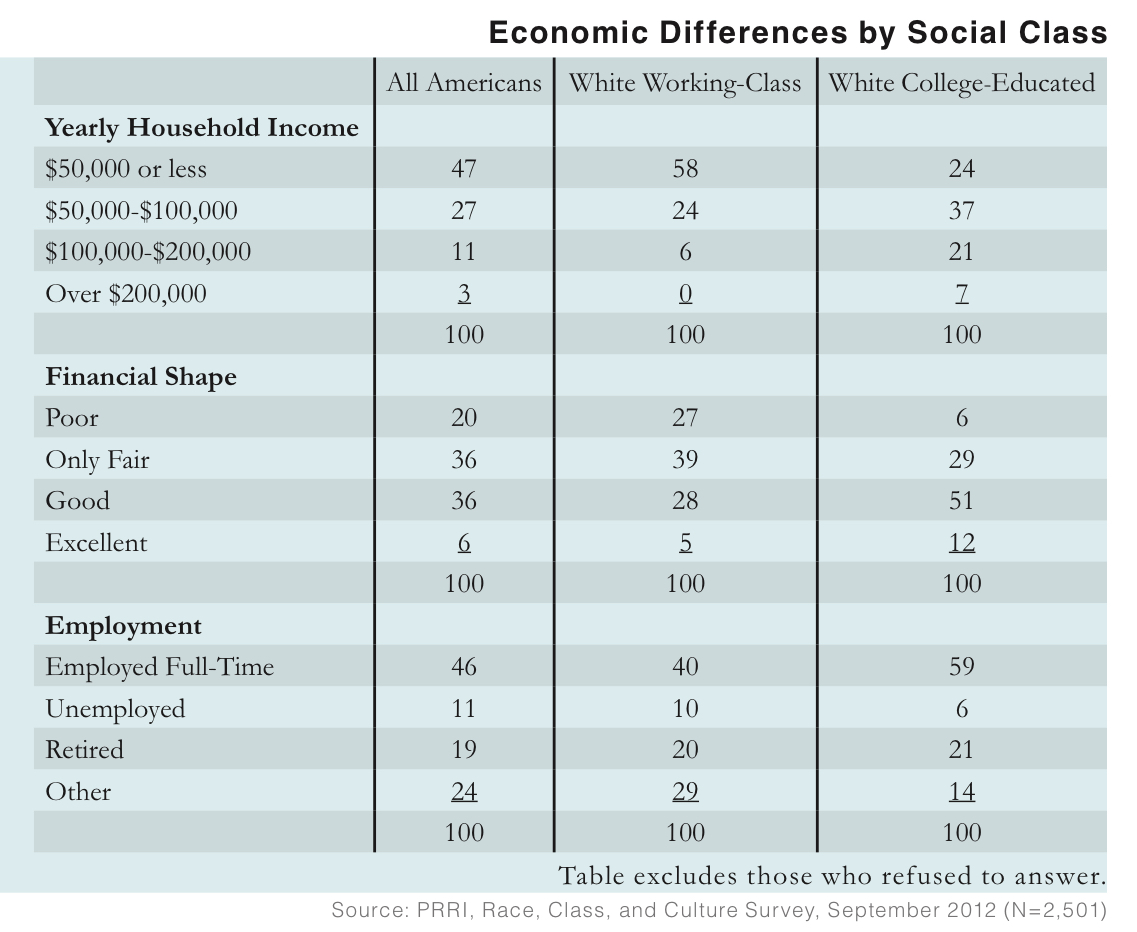
White working-class Americans are more than twice as likely as white college-educated Americans to have incomes of $50,000 or less (58% vs. 24%). Approximately two-thirds of white working-class Americans report being in only fair (39%) or poor shape (27%) financially. By contrast, over 6-in-10 white college-educated Americans say they are in good (51%) or excellent (12%) financial shape.
Only 4-in-10 (40%) white working-class Americans report that they are employed full-time, while roughly 1-in-5 say they have part-time employment (11%) or are unemployed (10%). By contrast, nearly 6-in-10 (59%) white college-educated Americans are employed full-time.
Only 3% of white working-class Americans currently have or had a job that requires a college degree, compared to nearly two-thirds (65%) of white college-educated Americans. Nevertheless, white working-class Americans are not more likely than white college-educated Americans to say they work multiple jobs (14% vs. 15%). White working-class Americans do report working more average hours per week than white college-educated Americans (51 hours vs. 46 hours per week).(3)
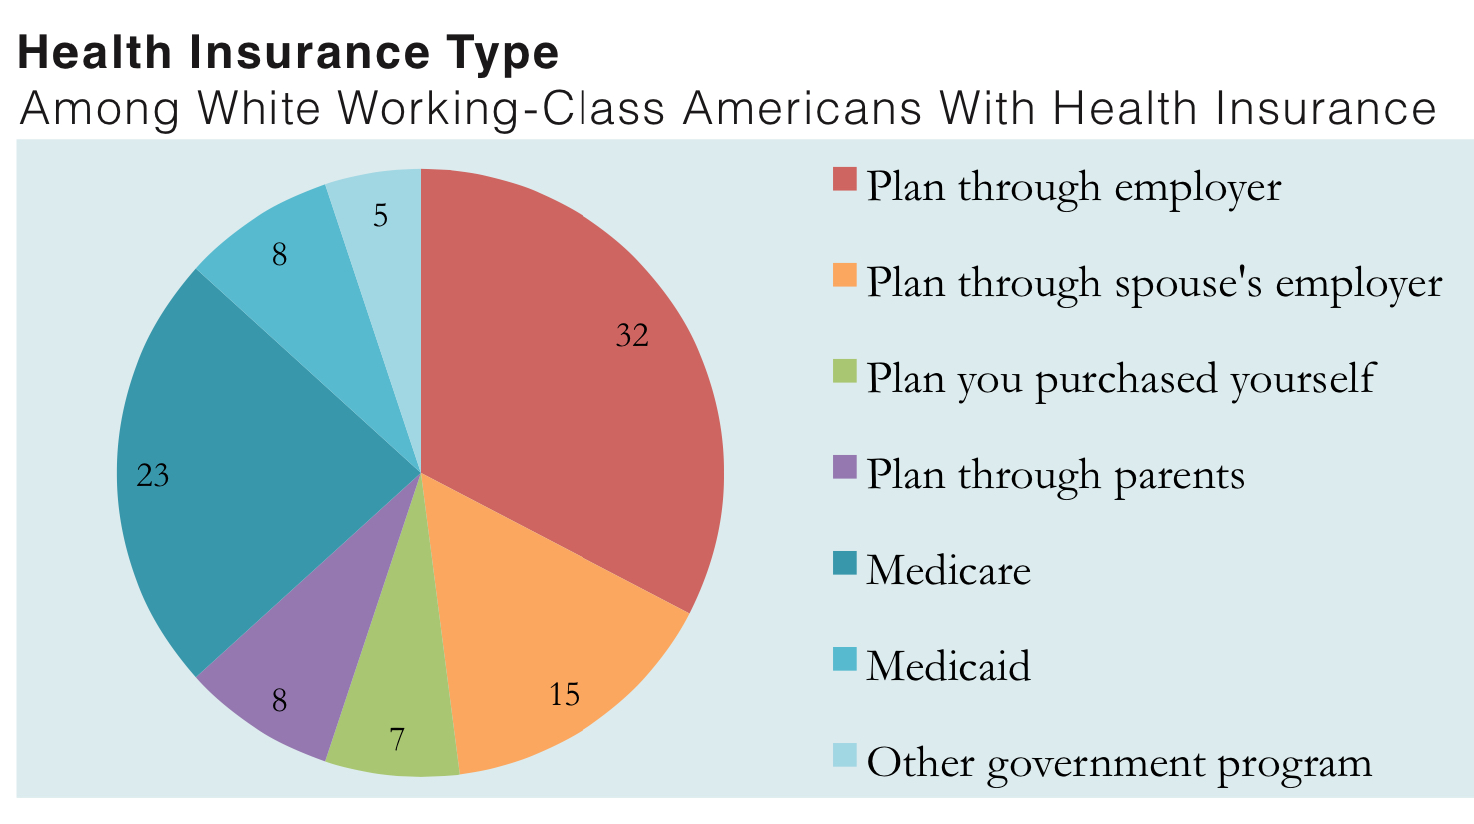
One-in-five (20%) white working-class Americans do not have health insurance. White working-class Americans who are insured are significantly less likely than white college-educated Americans to say they receive health insurance through their employer or their spouse’s employer (47% vs. 69%). More than one-third (36%) of white working-class Americans who are insured rely on government programs like Medicare and Medicaid for health insurance.
White working-class Americans are more likely than white college-educated Americans to identify significant challenges facing their respective communities. Two-thirds (67%) of white working-class Americans report that a lack of good jobs is a major problem in their community, compared to 52% of white college-educated Americans. A majority (56%) of white working-class Americans say that a lack of opportunities for young people is a major problem, compared to less than half (46%) of white college-educated Americans. White working class Americans are also significantly more likely than white college-educated Americans to report that home foreclosures (49% vs. 36%), crime (32% vs. 19%), illegal immigration (29% vs. 19%), and racial tensions (17% vs. 9%) are major problems facing their communities. Nearly equal numbers of white working-class and white college-educated Americans report that a lack of funding for public schools is a major problem in their respective communities (47% vs. 44%).
Cultural Influences and Consumer Preferences
The consumer preferences of white working-class Americans, as well as their cultural profiles, differ significantly from those of white college-educated Americans.
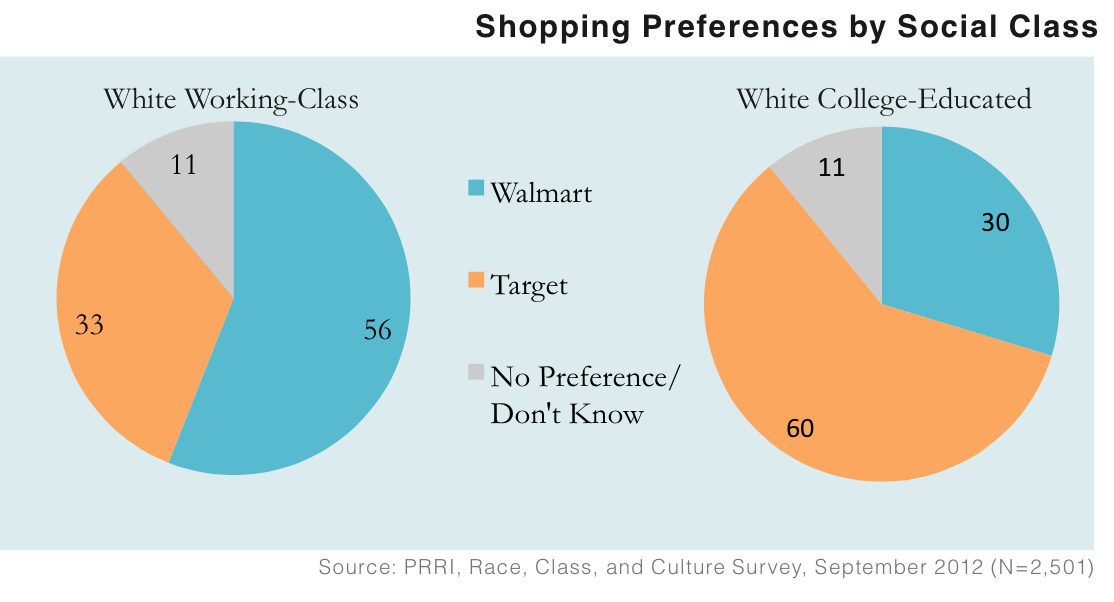
A majority (56%) of white working-class Americans report that they would prefer to shop at Walmart as opposed to Target. Conversely, 6-in-10 (60%) white college-educated Americans say they would prefer to shop at Target as opposed to Walmart. White working-class Americans are more than twice as likely to prefer Dunkin Donuts to Starbucks (51% vs. 25%), while more than 1-in-5 (22%) say they have no preference. White college-educated Americans also prefer Dunkin Donuts over Starbucks, but by a much smaller margin (46% vs. 37%).
White working-class Americans are much less likely than white college-educated Americans to have a close friend or family member who is a vegetarian (35% vs. 59%). White working-class Americans are also less likely than college-educated Americans to say that they have a close friend or family member of a different race or ethnicity (69% vs. 77%). However, white working-class Americans and white college-educated Americans are about equally as likely to be part of a household with at least one person in a labor union (16% vs. 17%), or to be part of a household where at least one person is a military veteran (32% vs. 32%).
About half of white working-class Americans and white college-educated Americans report that they live in a household with a gun (51% vs. 47%). However, gun ownership varies among white working-class Americans by region. White working-class Americans in the Northeast (38%) are less likely than white working-class Americans in the South (62%), West (50%), or Midwest (48%) to own a gun.
Despite the overall parity of gun ownership between white working-class and white college-educated Americans, white working-class Americans have much more favorable views of the National Rifle Association (NRA) than white college-educated Americans (66% vs. 46%). Nearly half (46%) of white college-educated Americans have an unfavorable view of the NRA.
White working-class Americans (63%) are slightly more likely than white college-educated Americans (58%) to say they display the American flag at their home, in their office, or on their car.(4)
White working-class Americans (28%) are somewhat more likely than white college-educated Americans (21%) to say they most trust broadcast news networks (ABC, CBS and NBC) to give them accurate information about politics and current events. By contrast, white college-educated Americans (17%) are more likely than white working-class Americans (8%) to say that they most trust public television. Equal numbers of white working-class Americans (28%) and white college-educated Americans (27%) identify Fox News as their most trusted media source.
Cultural Generation Gaps
Younger white working-class Americans (age 18-39) differ significantly from senior white-working class Americans (age 65 and older) on a variety of cultural influences and consumer preferences. Younger white working-class Americans are substantially more likely than senior white working-class Americans to say that they have a friend or family member who is a vegetarian (42% vs. 26%) or to have a close friend or family member who is of a different race or ethnicity (82% vs. 52%).
Senior white working-class Americans are, by contrast, more likely than younger white working-class Americans to say that they or someone else in their household is a military veteran (44% vs. 25%). They are also more likely than younger white working-class Americans to say that they display the American flag at their home, in their office, or on their car (77% vs. 50%), and that they prefer to shop at Walmart rather than Target (67% vs. 50%).
Views about Authority and Autonomy
One of the central cultural divisions separating white working-class Americans and white college-educated Americans are their respective approaches to authority. In his classic work on the white working-class, Seymour Martin Lipset (1959) suggests that lower levels of education, greater economic insecurity, and familial instability result in lowered tolerance for differing viewpoints and the groups who espouse them, and greater support for traditional structures of authority.
Recent research on American attitudes toward authority has relied on indices based on paired traits that are desirable for children. These indices require respondents to chose between qualities that emphasize children’s autonomy and freedom and qualities that stress deference to parental authority and obedience (i.e. Feldman 2003 and Stenner 2005). These measures are independent of existing social and political arrangements that affect views about authority, reflecting instead a worldview that “self-consciously values authority” (Owen et. al 1991).
In the current survey, the pairs of desirable childhood traits were adopted from the American National Election Survey (ANES), with minor alterations.(5) Overall, Americans report a general preference for childhood characteristics that emphasize authority over autonomy. For instance, Americans prefer respect for elders (75%) to independence (18%), good manners (62%) to curiosity (31%), and good behavior (“well-behaved”) (51%) to creativity (41%). However, Americans also rate self-reliance (51%) more highly than obedience (43%).
Consistent with previous work in this area, we computed an additive scale that combined all four measures.(6) The scale runs from 1 (high authoritarian) to 5 (high autonomous). In general, Americans’ composite score places them higher on the authoritarian side of the scale. More than 6-in-10 Americans favor highly authoritarian (36%) or authoritarian (26%) childhood traits, compared to roughly 1-in-4 Americans who favor more autonomous (15%) or highly autonomous (11%) childhood traits. Roughly 1-in-10 (12%) Americans are mixed, preferring some authoritarian traits and some autonomous traits.
In terms of their tendency to favor autonomous or authoritarian traits, there are dramatic differences between white working-class Americans and white college-educated Americans. The profile of white working-class Americans looks fairly similar to the profile of the general population. Nearly two-thirds of white working-class Americans favor high authoritarian (39%) or authoritarian (26%) childhood traits, while less than 1-in-4 favor autonomous (16%) or high autonomous (7%) traits. By contrast, only 4-in-10 white college-educated Americans favor high authoritarian (16%) or authoritarian (25%) traits. Nearly half of white college-educated Americans favor autonomous (21%) or high autonomous (24%) childhood traits.
Cultural Issues: Abortion and Same-sex Marriage
Conventional wisdom suggests that white working-class Americans are socially conservative, and strongly oppose both legal abortion and same-sex marriage.
White working-class Americans, however, have a more complex profile on these issues than this stereotype suggests.
Abortion
White working-class Americans are somewhat divided on the issue of abortion. Half (50%) believe that abortion should be legal in all or most cases, while 45% believe that abortion should be illegal in all or most cases.
White college-educated Americans are, however, significantly more supportive of the legality of abortion than white working-class Americans. Nearly 6-in-10 (59%) white college-educated Americans support legal abortion in all or most cases, while 34% believe abortion should be illegal in all or most cases.
White working-class Americans’ perspectives on the issue of abortion vary significantly by region and religious affiliation. Over six-in-ten (63%) white working-class Americans in the Northeast believe that abortion should be legal in all or most cases. Smaller majorities of Midwesterners (52%) and Westerners (54%) also believe abortion should be legal in all or most cases. However, only 32% of white working-class Americans in the South believe abortion should be legal in all or most cases, while a majority (54%) think abortion should be illegal in all or most cases.
A majority (56%) of white working-class Catholics think abortion should be legal in all or most cases. By contrast, a majority (53%) of white working-class Protestants believe that abortion should be illegal in all or most cases.
Same-sex Marriage
White working-class Americans are more likely to think that same-sex marriage should be illegal rather than legal, although a significant minority support allowing gay and lesbian people to marry. Half (50%) of white working-class Americans are opposed to allowing gay and lesbian couples to marry legally, while 43% support this policy. By contrast, a solid majority (58%) of white college-educated Americans support allowing gay and lesbian couples to marry, while 38% are opposed.
Among white working-class Americans, there are large differences by region, religious affiliation, gender, and generation. A solid majority (57%) of white working-class Americans in the Northeast favor allowing gay and lesbian couples to marry legally. In the South, however, a solid majority (61%) of white working-class Americans oppose same-sex marriage. White working-class Americans in the West (47% in favor, 45% opposed) and Midwest (44% in favor, 49% opposed) are divided.
White working-class Catholics and white working-class women are more likely to favor same-sex marriage. A slim majority of white working-class Catholics (52%) favor same-sex marriage, while the same percentage of white working-class Protestants (52%) are opposed. White working-class women (47%) are more likely than white working-class men (38%) to favor allowing gay and lesbian couples to marry legally.
There is a sizeable generation gap among white working-class Americans on the issue of same-sex marriage. A majority (56%) of younger white working-class Americans (age 18-39) support allowing gay and lesbian couples to marry legally, while 39% are opposed. By contrast, two-thirds (67%) of white working-class seniors (age 65 and older) oppose same-sex marriage, while one-quarter (25%) are in favor.
II. The 2012 Presidential Election
The 2012 Vote
Eight-in-ten (80%) Americans say they are currently registered to vote in their current precinct or election district, and 7-in-10 (70%) say they are absolutely certain they will vote. White working-class Americans are less likely than white-college educated Americans to say they are certain to vote (66% vs. 87%). Nearly three-quarters of white Americans (74%) and black Americans (74%) say they are certain to vote, compared to less than half (49%) of Hispanic Americans.
In mid-August, when this survey was fielded, Obama held a slight lead over Romney among registered voters (45% vs. 39%), with 16% of voters reporting that they were not yet sure which candidate they would support.(7) Voters were divided by race, gender, and religious affiliation.
Romney had a double-digit advantage over Obama among white working-class voters (48% vs. 35%), while white college-educated voters were nearly evenly divided in their support (44% vs. 42%). Obama retained sizable advantages over Romney among black voters (87% vs. 2%) and Hispanic voters (55% vs. 27%).
Inside the White Working-Class Vote
Although in mid-August, Mitt Romney held a lead over Barack Obama among white working-class voters overall, there were substantial divides among white working-class voters by region, religious affiliation, gender, and generation.
White working-class voters’ support for Mitt Romney or Barack Obama varied greatly by region. Among white working-class voters in the South, Romney held a commanding 40-point lead over Obama (62% vs. 22%). However, neither candidate held a statistically significant lead among white working-class voters in the West (46% Romney vs. 41% Obama), Northeast (42% Romney vs. 38% Obama), and Midwest (36% Romney vs. 44% Obama).
There were also large divides according to religious affiliation. White working-class Catholic voters were nearly evenly divided (44% Romney vs. 41% Obama). Romney, meanwhile, enjoyed a 2-to-1 advantage over Obama among white working-class Protestant voters (56% vs. 27%).
There was a noticeable gender gap in white working-class voters’ preferences for the candidates. White working-class men were much more likely to favor Mitt Romney (55%) over Barack Obama (28%). White working-class women were evenly divided between Romney and Obama (41% each).
There were also substantial generational divides among white working-class voters. A majority (56%) of senior white working-class voters (age 65 and older) supported Romney, while only 31% favored Obama. Younger white working-class voters (age 18-39) were more divided, with 43% in favor of Romney and 37% supporting Obama. Notably, younger white working-class voters were more likely than white working-class seniors to say they are undecided as to their vote (20% vs. 13%).
Cultural and Economic Factors Influencing Vote Preferences Among the White Working Class
Attitudes about abortion were highly correlated to presidential vote choice among white Americans, but they influenced the presidential vote choice of white working-class voters less than they influenced white college-educated voters. Among white working-class voters, 66% of those who believe abortion should be illegal supported Romney, compared to 32% of those who believe abortion should be legal. Among white college-educated Americans, 74% of those who believe abortion should be illegal supported Romney, compared to 25% of those who believe abortion should be legal. In other words, the abortion vote gap—the difference in voting preference between those who believe abortion should be illegal and legal—was less pronounced among white working-class voters (a 34-point gap) than among white college-educated voters (a 49-point gap).
Although white working-class voters’ incomes fall within a fairly circumscribed range (and rarely exceed $75,000), there were substantial differences in voter preference by income even within this smaller range. White working-class voters with household incomes below $30,000 per year were nearly evenly divided in their voting preferences (39% favored Obama, 42% favored Romney). Among white working-class voters with annual household incomes of at least $30,000, a slim majority (51%) supported Romney, and 35% preferred Obama.
White working-class voters who have used government benefits like food stamps in the past few years were more likely to favor Obama, while white working-class voters who have not used food stamps were more likely to favor Romney. Half (50%) of white working-class voters who have not reported using food stamps in the past two years supported Romney, while less than one-third (33%) supported Obama. By contrast, white working-class voters who reported receiving food stamps in the last two years preferred Obama to Romney by a significant margin (48% vs. 36%).
The 2012 Vote by Religious Affiliation, Gender, and Generation
Among the general population, white evangelical voters strongly supported Romney over Obama (67% vs. 18%), while Obama held an equally large lead among religiously unaffiliated voters (63% vs. 20%) and non-Christian religious voters (65% vs. 19%). Romney also had a lead among white mainline Protestant voters (48% vs. 37%). Catholic voters were nearly evenly divided between Obama and Romney(43% vs. 41%).
Male voters overall supported Romney over Obama by a modest margin (46% vs. 40%), while Obama had a significant advantage over Romney among female voters (49% vs. 34%). Romney led Obama among senior voters (53% vs. 35%) while Obama had a similar advantage among Millennial voters (56% vs. 30%).
Views of the Candidates and Political Parties
Presidential Job Approval
In the lead-up to the election, Americans are roughly evenly divided in their perspectives on how well Obama is handling his job as President (46% approve and 43% disapprove). There are stark divisions on this question by race, religious affiliation, gender, and age.
A majority (53%) of white Americans disapprove of Obama’s performance as President, while just 36% approve. Majorities of both white working-class and white college-educated Americans also disapprove of the job Obama is doing as President (55% and 51%). By contrast, strong majorities of black (89%) and Hispanic (57%) Americans approve of Obama’s job performance.
There are also substantial religious divisions. Nearly three-quarters (73%) of white evangelicals and a majority (55%) of white mainline Protestants disapprove of Obama’s job performance. Meanwhile, majorities of black Protestants (87%) and the religiously unaffiliated (61%) approve of his job performance. Catholics are evenly divided (43% approve, 42% disapprove).
Nearly half (49%) of women approve of Obama’s job performance, while 39% disapprove. Men are more closely divided, with 47% reporting that they disapprove of Obama’s job performance, while 43% approve. A slim majority (52%) of Millennials (age 18-29) approve of Obama’s job as President, while a majority of seniors (age 65 and older) disapprove (56%).
Favorability of Romney & Obama
Despite Obama’s lackluster job approval numbers, most Americans have a favorable personal opinion of the President. A majority (55%) of Americans view Obama favorably, a higher percentage than the 46% of Americans who approve of his job as President. Roughly 4-in-10 (42%) Americans have an unfavorable opinion of the President.
By contrast, Americans’ views of Mitt Romney are negative. About 4-in-10 (41%) Americans have a favorable view of Romney, while nearly half (48%) have an unfavorable view of the GOP candidate.
Inside White Working-Class Attitudes About Candidate Favorability
In spite of white working-class voters’ preference for Romney at the ballot box, white working-class Americans are not particularly enthusiastic about either presidential candidate. Less than half of white working-class Americans have a favorable view of Obama (44%) or Romney (45%). Similarly, white college-educated Americans are not enamored of either candidate: about half (49%) report a favorable opinion of both Obama and Romney.
The regional differences evident in white working-class voting patterns are also apparent in the two candidates’ favorability ratings. Romney is viewed more favorably than Obama among white working-class Americans in the South (57% vs. 29%). However, Obama is viewed more favorably than Romney among white working-class Americans in the Midwest (55% vs. 36%). White working-class Americans in the Northeast (47% vs. 41%) and the West have about equally favorable opinions of Romney and Obama (44% vs. 47%).
While white working-class Protestants have a more favorable opinion of Romney than Obama (53% vs. 37%), Obama has a similar advantage over Romney among white working-class Catholics (51% vs. 37%).
White working-class women are more likely than white working-class men to hold a favorable view of Obama as opposed to Romney (49% vs. 39%), while white working class men are more likely than white working-class women to hold a favorable view of Romney as opposed to Obama (51% vs. 38%).
White working class seniors (age 65 and older) are significantly more likely to hold a favorable opinion of Romney than Obama (55% vs. 38%). Younger white working-class Americans (age 18-39) hold roughly equally favorable views of Obama (45%) and Romney (41%).
Candidate Favorability by Religious Affiliation, Generation, and Gender
The religious divisions in candidate favorability are plain. Romney is viewed more positively than Obama among white evangelical Protestants (64% vs. 28%), while Obama is viewed more favorably among black Protestants (86% vs. 16%), the religiously unaffiliated (72% vs. 25%), and Catholics (55% vs. 42%). However, Obama’s advantage among Catholics appears to be due primarily to his higher standing among Hispanic Catholics, nearly three-quarters (73%) of whom have a favorable opinion of Obama, while only 40% say the same of Romney. White Catholics view Obama (46%) and Romney (44%) about equally favorably. White mainline Protestants are also divided: 46% report that they have a favorable opinion of Obama, while and 48% say the same of Romney.
There are strong generational divisions on the favorability of the candidates. Nearly two-thirds (66%) of Millennials have a favorable view of Obama, compared to only 4-in-10 (40%) seniors. The reverse is true of Romney. A majority (54%) of seniors have a favorable view of the GOP nominee, compared to 36% of Millennials.
There is also a sizeable gender gap. Nearly 6-in-10 (59%) women have a favorable view of Obama, compared to 51% of men. Romney fares less well with both men and women, although women are more likely than men to hold an unfavorable view of the GOP candidate. Less than half (46%) of men and less than 4-in-10 (37%) women say they have a favorable view of Romney. Overall, Obama has a 22-point advantage over Romney in likeability among women, but only a five-point advantage among men.
Favorability of the Republican Party & Democratic Party
Overall, Americans hold slightly more positive views of the Democratic Party than the Republican Party. A slim majority (51%) of Americans say they have a favorable view of the Democratic Party, while roughly 4-in-10 (43%) say they have an unfavorable view. Less than half (44%) of Americans view the GOP favorably, while close to half (49%) have an unfavorable view.
White working-class Americans have a slightly more positive outlook on the Republican Party than on the Democratic Party, but not by a wide margin. Nearly half (49%) of white working class Americans say they view the Republican Party favorably, while 42% say they have a favorable view of the Democratic Party. A majority (51%) of white working-class Americans have an unfavorable view of the Democratic Party.
There are significant divisions by age and gender. Interestingly, these gaps are much more pronounced in Americans’ views of the Democratic Party, compared to their views of the Republican Party. Nearly 6-in-10 (57%) women have a favorable view of the Democratic Party, compared to less than half (46%) of men. Men and women have almost equally favorable views of the GOP (45% and 42%).
The generation gap is also substantial. More than 6-in-10 (63%) Millennials have a favorable view of the Democratic Party, compared to 41% of seniors. By contrast, a majority (53%) of seniors and only around 4-in-10 (43%) of Millennials have a favorable view of the Republican Party.
Favorability of Bill Clinton & George W. Bush
Of all the public figures included in this survey, former Democratic President Clinton is by far the most popular. Seven-in-ten (70%) Americans report having a favorable view of Clinton, while roughly 4-in-10 (43%) have a favorable view of former Republican President George W. Bush. A majority (54%) of Americans hold an unfavorable opinion of Bush.
Clinton is viewed favorably among all major demographic groups, including liberals (82%), Millennials (76%), women (73%), white college-educated Americans (72%), men (68%), white working-class Americans (61%), seniors (60%), and conservatives (57%). Even 44% of Republicans have a favorable view of Clinton. Bush is viewed favorably by a majority of Americans who identify with the Tea Party movement (79%), white evangelical Protestants (74%), conservatives (66%), seniors (62%), white mainline Protestants (51%), and white working-class Americans (51%).
Issues Most Important to Voters
The economy is by far the most important issue for registered voters this election year. A majority (55%) of registered voters report that the economy is the most important issue to their vote for president. Roughly 1-in-5 (19%) voters report that health care is the most important issue to their vote, while 1-in-10 (10%) voters say the same of education. Significantly fewer voters report that national security (5%), immigration (3%), same-sex marriage (3%), or abortion (2%) is most important to their vote.
However, voters are not unified on which economic issues are most important to their vote for president. Among those voters who say the economy is the most important voting issue, 4-in-10 (40%) report that the lack of jobs is the most important economic issue this election year. Nearly one-quarter (23%) cite the budget deficit, 17% cite the gap between rich and poor, and 13% point to tax policy.
White working-class voters are slightly less likely than white college-educated voters to say that the economy is the most important issue to their vote for president this year (55% vs. 62%). However, among voters who identify the economy as the most important voting issue this year, white working-class voters are slightly more likely than white college-educated voters to say that the lack of jobs is the most important economic issue to their vote this year (42% vs. 36%).
Perspectives on the Tea Party, Labor Movement, and Occupy Wall Street
Three movements in American politics—the Tea Party movement, the labor movement, and the Occupy Wall Street movement—draw support from significantly different demographic groups.
The Tea Party Movement
Around 3-in-10 (30%) Americans say the Tea Party movement shares their values. White working-class Americans are about equally as likely as white college-educated Americans to agree with this statement (34% and 31%).
White Americans (34%) are more likely than black (16%) or Hispanic (26%) Americans to say the Tea Party movement shares their values. Nearly 6-in-10 (58%) Republicans say the Tea Party movement shares their values, compared to 12% of Democrats and 29% of Independents.
Nearly half (45%) of white evangelical Protestants say the Tea Party shares their values, while over one-third of white mainline Protestants (37%) and Catholics (35%) say the same. By contrast, less than 1-in-5 black Protestants (16%) and religiously unaffiliated Americans (15%) say the Tea Party movement shares their values.
The Labor Movement
Around 3-in-10 (32%) Americans say the labor movement shares their values. White working-class Americans are about equally as likely as white college-educated Americans to agree with this statement (31% and 29%). Within the white working class, there are significant differences by region and religious affiliation. White working-class Americans in the Midwest (39%) are more likely than white working-class Americans in the South (26%%) and West (28%) to say that the labor movement shares their values. One-third (33%) of white working-class Americans in the Northeast say the labor movement shares their values. White working-class Catholics (44%) are also more likely than white working-class Protestants (28%) to say the labor movement share their values.
Among all Americans, there are significant divisions by race, political affiliation, and religious affiliation. Black (38%) and Hispanic (37%) Americans are more likely than white Americans (29%) to say the labor movement shares their values. A plurality (47%) of Democrats say the labor movement shares their values, compared to 27% of Independents and 1-in-5 (20%) Republicans.
Black Protestants (41%), Catholics (38%), and the religiously unaffiliated (34%) are more likely than white evangelical Protestants (24%) and white mainline Protestants (24%) to say the labor movement shares their values.
The Occupy Wall Street Movement
Roughly 1-in-5 (21%) Americans say the Occupy Wall Street movement shares their values. This is a drop since November 2011, a few months after the Occupy Wall Street movement’s inception, when 27% of Americans said the Occupy Wall Street movement shared their values.(8) White college-educated Americans are twice as likely as white working-class Americans to say that the Occupy Wall Street movement shares their values (28% vs. 16%).
Only 8% of Republicans say the Occupy Wall Street movement shares their values, compared to 20% of Independents and 33% of Democrats. A majority (53%) of Democrats say the Occupy Wall Street movement does not share their values.
Black Americans (31%) are more likely than white (20%) or Hispanic (19%) Americans to agree that the Occupy Wall Street movement shares their values. Millennials are more likely than seniors to say that the Occupy Wall Street movement shares their values (22% vs. 15%).
III. Economic Problems and Inequality in America
Who is Responsible for Today’s Economic Problems?
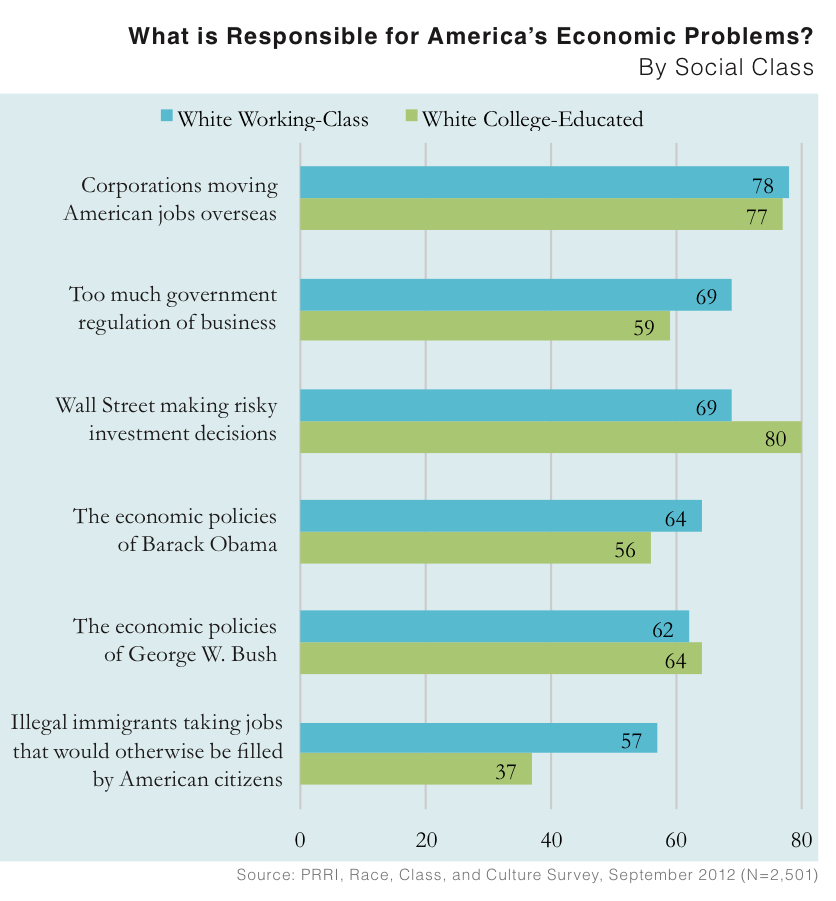
Americans believe that a wide range of issues prompted the country’s current economic problems. There is, however, widespread agreement on a few causes. Nearly three-quarters (74%) say that corporations moving American jobs overseas are somewhat or very responsible for America’s current economic problems, while over 7-in-10 (72%) point to risky investment decisions made by Wall Street. Around two-thirds (65%) of Americans believe that the economic policies of George W. Bush are somewhat or very responsible for the nation’s current economic woes, while 59% say the same of the economic policies of Barack Obama. Nearly two-thirds (65%) say that too much government regulation of business is responsible for the country’s current economic problems, while fewer than half (49%) say that illegal immigrants taking jobs that would otherwise be filled by American citizens are responsible.
There are, however, substantial divisions on the root causes of the nation’s economic problems, based on social class, race, and political affiliation. White working-class Americans are more likely than white college-educated Americans to name illegal immigrants taking jobs that would otherwise be filled by American citizens (57% vs. 37%). White working-class Americans and white college-educated Americans are about equally likely to say that corporations moving American jobs overseas are responsible for America’s current economic distress (78% and 77%), but there is a substantial difference in intensity: a majority (53%) of white working-class Americans say corporations are very responsible, compared to only 3-in-10 (31%) white college-educated Americans.
While around half of white (50%) and a slim majority (53%) of black Americans identify illegal immigrants taking jobs as somewhat or very responsible for the country’s economic problems, only 37% of Hispanic Americans agree. Black Americans (43%) are also less likely than white (61%) or Hispanic (62%) to say that the economic policies of Barack Obama are somewhat or very responsible.
Republicans (57%) are more likely than Democrats (43%) and Independents (47%) to say that illegal immigrants taking jobs that would otherwise be filled by American citizens are somewhat or very responsible for America’s current economic situation. Republicans (79%) are also more likely than Democrats (53%) and Independents (67%) to point to too much government regulation of business.
Unsurprisingly, Democrats are more likely than Republicans to believe that the economic policies of George W. Bush are responsible for the nation’s economic problems (77% vs. 49%), while Republicans are more likely than Democrats to identify the economic policies of Barack Obama (76% vs. 48%). Interestingly, however, there is strong bipartisan agreement that corporations moving jobs overseas are somewhat or very responsible for the nation’s economic problems. Around three-quarters of Republicans (74%), Democrats (73%), and Independents (73%) agree with this statement.
Fairness and Equal Opportunity
Nearly two-thirds (66%) of Americans agree that the financial system in this country unfairly favors the wealthy. Similarly, a majority (54%) of Americans believe that one of the big problems in this country is that we don’t give everyone an equal chance in life, while 39% say it’s not really that big a problem if some people have more of a chance in life than others. There are substantial differences on the issue of economic inequality by social class, gender, age, race, religious affiliation, and party affiliation.
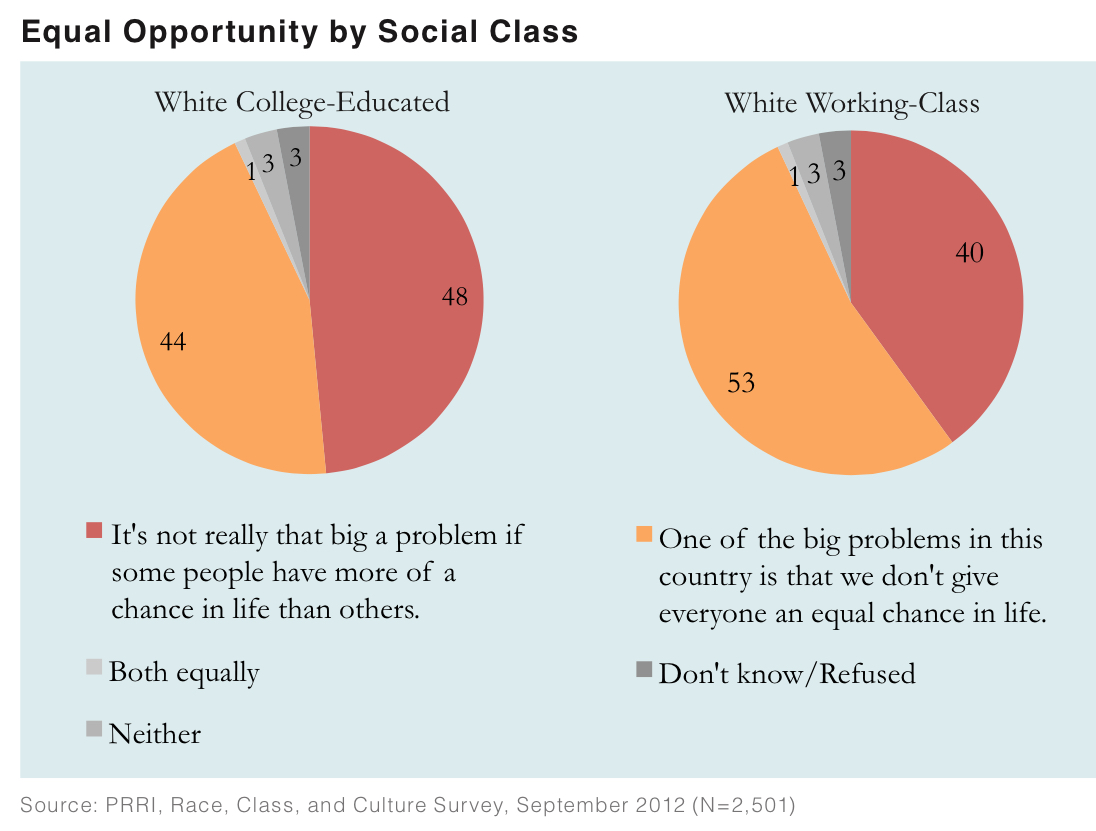
Seven-in-ten (70%) white working-class Americans and over 6-in-10 (62%) white college-educated Americans believe the economic system in this country unfairly favors the wealthy. A majority (53%) of white working-class Americans also say that one of the big problems in this country is that we don’t give everyone an equal chance in life. However, less than half (48%) of white college-educated Americans agree that it’s not really that big a problem if some people have more of a chance in life than others.
Substantial majorities of black (78%) and Hispanic (69%) Americans agree that the economic system in this country favors the wealthy. There is, however, a substantial difference in intensity: nearly half (46%) of black Americans strongly agree with this statement, compared to 28% of Hispanic Americans. Over three-quarters (77%) of black Americans and around 6-in-10 (62%) Hispanic Americans agree that one of the big problems in this country is that we don’t give everyone an equal chance in life.
There are deep political divisions on the issue of equal opportunity. Nearly three-quarters (72%) of Democrats and a slim majority of Independents (53%) agree that one of the big problems in this country is that we don’t give everyone an equal chance, while nearly 6-in-10 (58%) Republicans say it’s not really that big a problem if some people have more of a chance in life than others. Similarly, only 44% of Republicans believe that the economic system in this country unfairly favors the wealthy, compared to 85% of Democrats and two-thirds (67%) of Independents.
A majority of black Protestants (78%), the religiously unaffiliated (60%), and Catholics (55%) agree that one of the biggest problems in this country is that we don’t give everyone an equal chance in life. White evangelical Protestants and white mainline Protestants are divided. Majorities of all religious groups agree that the economic system in this country unfairly favors the wealthy.
Women are more likely than men to believe that the economic system in this country unfairly favors the wealthy (71% vs. 62%). Similarly, nearly 6-in-10 (58%) of women say that one of the big problems in this country is that we don’t give everyone an equal chance in life, compared to less than half (49%) of men.
Nearly two-thirds (64%) of Millennials (age 18-29) agree that one of the big problems in this country is that we don’t give everyone an equal chance in life, while only one-third (33%) say that it’s not really that big a problem if some people have more of a chance in life that others. By contrast, only 39% of seniors (age 65 and older) identify a lack of equal opportunity as one of America’s biggest problems. Millennials are also more likely than seniors to agree that America’s economic system unfairly favors the wealthy (72% vs. 59%).
The Buffett Rule
Over 6-in-10 (62%) Americans favor a policy commonly known as the Buffett Rule, which would increase the tax rate on Americans earning more than $1 million a year, while 36% are opposed. There are no substantial differences by social class, age, race, religious affiliation, or gender. Over 6-in-10 (62%) white working class Americans and nearly two-thirds (66%) of white college-educated Americans favor raising the tax rate on those with household incomes of over $1 million per year. Democrats (79%) and Independents (61%), however, are much more likely than Republicans (42%) or Americans who identify with the Tea Party (33%) to favor this measure.
The Compatibility of Capitalism and Christian Values
Americans are divided over the extent to which capitalism and the free market system and Christian values can coexist: a plurality (44%) believe that capitalism and the free market system are at odds with Christian values, while 41% agree that capitalism is consistent with Christian values. Fifteen percent say they do not know.
White working-class Americans are significantly more likely than white college-educated Americans to say that capitalism is at odds with Christian values. A majority (53%) of white college-educated Americans agree that capitalism and the free market system are consistent with Christian values, while 35% disagree. By contrast, a plurality (46%) of white working-class Americans believe that capitalism is at odds with Christian values, while 38% disagree. White working-class Americans who live in the Northeast (54%) are more likely than white working-class Americans who live in the South (43%) or West (42%) to say that capitalism is inconsistent with Christian values. White working-class Americans who live in the Midwest are divided.
A majority (56%) of black Americans and half (50%) of Hispanic Americans agree that capitalism and the free market system are at odds with Christian values. White Americans are nearly evenly divided, with 41% saying that capitalism is at odds with Christian values, and 44% saying that capitalism and the free market system are consistent with Christian values.
Republicans are substantially more likely than Democrats to believe that capitalism and the free market system are consistent with Christian values (57% vs. 30%). A majority (54%) of Democrats agree that capitalism is at odds with Christian values, compared to only 32% of Republicans. Independents are divided, with 44% saying that capitalism is at odds with Christian values, and 41% saying that capitalism and Christian values are consistent.
Christians are themselves divided on whether capitalism and Christian values are in accord. A majority (51%) of white mainline Protestants believe that capitalism is consistent with Christian values, while a majority (54%) of black Protestants who disagree, saying that capitalism is at odds with Christian values. White evangelical Protestants and Catholics are divided. Meanwhile, half (50%) of religiously unaffiliated Americans and a plurality (43%) of non-Christian religious Americans agree that capitalism and the free market system are at odds with Christian values.
Men are slightly more likely than women to believe that capitalism and Christian values are in accord. A plurality (46%) of men say that capitalism is consistent with Christian values, while 40% disagree. By contrast, nearly half (48%) of women say that capitalism is at odds with Christian values, while 36% disagree.
Younger Americans are more likely than older Americans to believe there is dissonance between capitalism and Christian values. A slim majority (51%) of Millennials agree that capitalism is at odds with Christian values, while half (50%) of seniors disagree, saying that capitalism is consistent with Christian values.
IV. Views of Government
“The” Government Vs. “Our Government
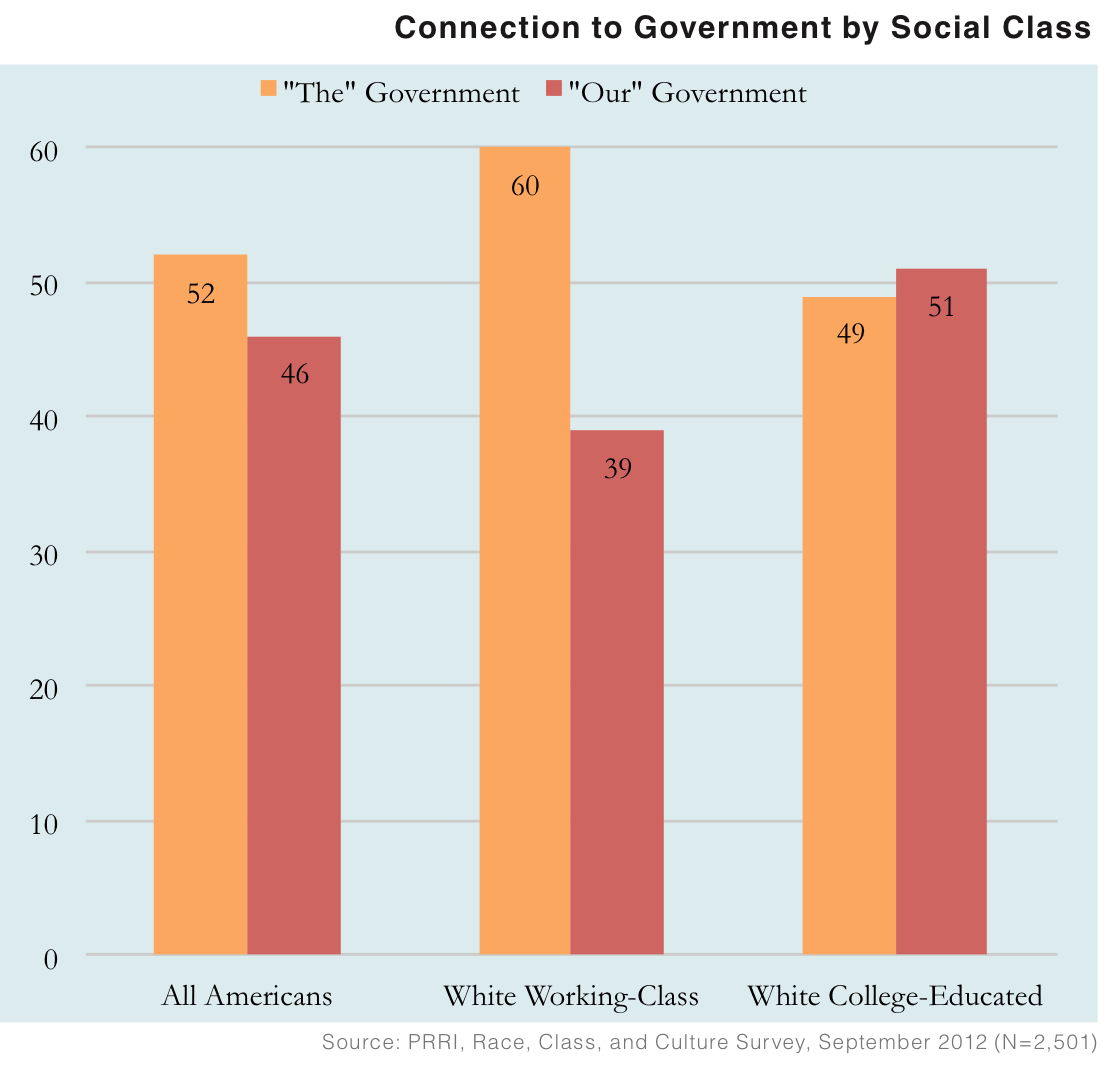
Overall, Americans are divided in the way they conceptualize their relationship with the government. A slim majority (52%) of Americans say that when they think and talk about government, they think of it as “the” government, while 46% say they think of it as “our” government.
White working-class Americans are more likely than white college-educated Americans to say they think of the U.S. government as “the” government, rather than “our” government. Like Americans overall, white college-educated Americans are divided: 51% say they think of the U.S. government as “our” government, while 49% say they think of it as “the” government. By contrast, 6-in-10 (60%) white working-class Americans say they think of government as “the” government, while 39% say they think of it as “our” government.
Among white working-class Americans, there are significant differences by region and generation. Younger white working-class Americans (age 18-39) are significantly more likely than senior white working-class Americans (age 65 and older) to articulate a lack of connectedness to the government. Approximately 7-in-10 (71%) of younger white working-class Americans say they think of the government as “the” government, rather than “our” government. By contrast, a majority (53%) of senior white working-class Americans say they think of the government as “our” government, rather than “the” government.
Notably, Hispanic Americans (58%) are considerably more likely than white (44%) and black (47%) Americans to say they think of the U.S. government as “our” government.
Democrats are more likely than Republicans and Independents to express a sense of affinity with the U.S. government. A solid majority (56%) of Democrats say that when they think and talk about government, they think of it as “our” government, compared to 42% of Republicans and 41% of Independents.
Millennials (age 18-29) are substantially more likely than seniors (age 65 and older) to convey a sense of disconnectedness from the government. Over 6-in-10 (62%) Millennials say they view government as “the” government, while only 37% think of it as “our” government. By contrast, a solid majority (56%) of seniors say they think and talk about government as “our” government, while 41% think of it as “the” government.
Government Assistance Programs
When presented with a choice between the federal government offering more services with higher taxes and the federal government offering fewer services with lower taxes, most Americans choose the latter. A solid majority (58%) of Americans agree that the federal government should provide fewer services and reduce taxes, while slightly more than one-third (36%) say the government should provide more services, even if it means higher taxes.
Around 6-in-10 white working-class Americans (61%) and white college-educated Americans (60%) agree that the federal government should provide fewer services and reduce taxes. By contrast, a slim majority of black Americans (52%) believe that the government should provide more services, even if it means higher taxes, while 44% say the government should provide fewer services and reduce taxes.
The partisan differences on this question are striking. A solid majority of Democrats (56%) favor expanded federal government services, even if it means higher taxes. By contrast, over 8-in-10 (82%) Republicans and 6-in-10 (60%) Independents believe the government should provide fewer services and reduce taxes.
Around half of black Protestants (51%) and the religiously unaffiliated (50%) favor more government services, even if it means higher taxes. However, solid majorities of white evangelical Protestants (72%), white mainline Protestants (63%), and Catholics (62%) support fewer services and reduced taxes.
Millennials are divided, with a slim majority (51%) in favor of fewer services and reduced taxes, and 45% in support of more services, even if it means higher taxes. Only one-quarter (25%) of seniors favor more services, even if means higher taxes, while 64% say the government should provide fewer services and reduce taxes.
Use of Government Resources and Benefits
Despite Americans’ desire for reduced government services and lower taxes, substantial numbers of Americans have received government benefits or taken advantage of government-funded public resources like libraries or parks. Roughly three-quarters of Americans say that over the past two years, someone in their household has visited a public library (79%) or a city, state, or public park (74%). Close to 4-in-10 (38%) Americans say they have received Social Security or disability payments at some point during the past two years. Around 1-in-5 Americans report that they have received unemployment benefits (18%) or food stamps (19%).
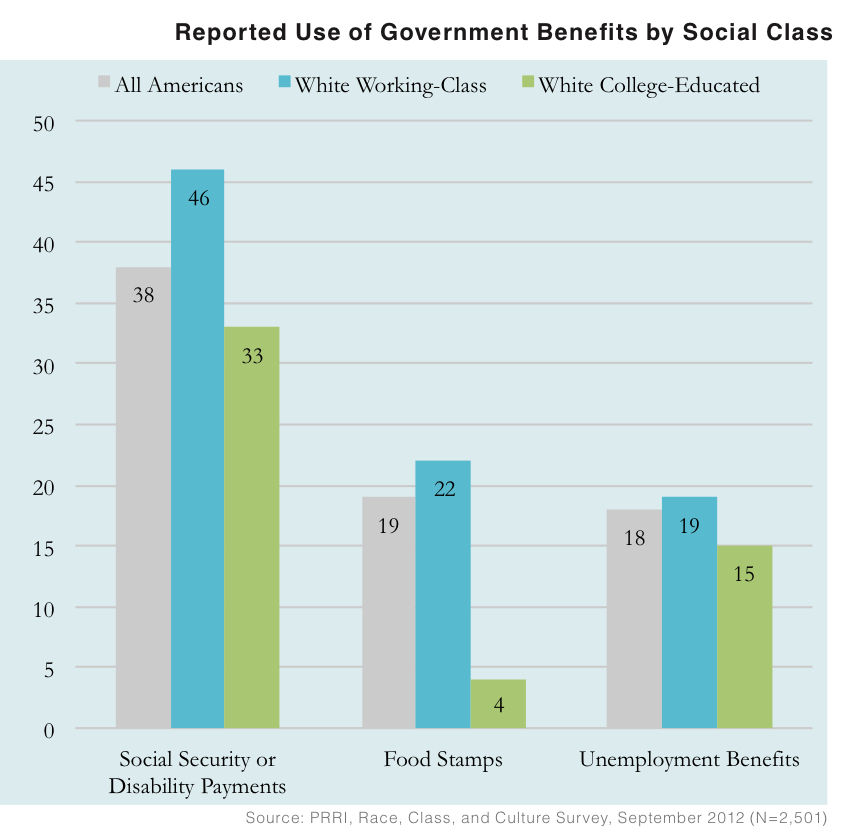
White working-class Americans are substantially more likely than white college-educated Americans to have received Social Security or disability payments at some point over the past two years (46% vs. 33%). They are also over five times more likely than white college-educated Americans to have received food stamps (22% vs. 4%). White working-class Americans are slightly more likely than white college-educated Americans to report having received unemployment benefits within the past two years (19% vs. 15%). White college-educated Americans, however, are considerably more likely than white working-class Americans to have visited a city, state, or national park (90% vs. 69%) or a public library (90% vs. 74%).
Black (34%) and Hispanic (28%) Americans are more likely than white Americans (14%) to report having received food stamps over the past two years. By contrast, white Americans (77%) are more likely than black (60%) and Hispanic (69%) Americans to have visited a city, state, or local park.
Democrats (23%) and Independents (20%) are about twice as likely as Republicans (11%) to report having received food stamps over the past two years.
Are the Poor Too Dependent on Government Assistance Programs?
Most Americans believe that poor people have become too dependent on government assistance programs. Seven-in-ten (70%) Americans agree with this statement, while fewer than 3-in-10 (28%) disagree. Three-quarters (75%) of white working-class Americans and more than two-thirds (68%) of white college-educated Americans believe that poor people have become too dependent on government assistance programs.
A majority of Democrats, Independents, and Republicans agree that Americans have become too dependent on government assistance programs, but there are notable divides in terms of intensity. A majority (55%) of Democrats agree that poor people have become too dependent on government programs, compared to nearly three-quarters (73%) of Independents and almost 9-in-10 (87%) Republicans.
Notably, these views about the dependency of the poor are shared by a substantial majority of Americans who have received government benefits. Solid majorities of Americans who report having received unemployment benefits (71%) or food stamps (63%) within the past two years also believe that poor people have become too dependent on government assistance programs.
White working-class Americans are more pessimistic than white college-educated Americans and the general public about the current promise of the American Dream, and America’s future as compared to its past. At the same time, they have more faith that God has granted the U.S. a special role in human history.
V. Perspectives on America
The American Dream
A slim majority (53%) of Americans agree that the American Dream (the notion that if you work hard, you’ll get ahead), still holds true, while over 4-in-10 (42%) believe that the American Dream once held true, but not anymore. Only 4% of Americans believe that the American Dream never held true.
White college-educated Americans are more optimistic about the status of the American Dream than are white working-class Americans. Over 6-in-10 (63%) white college-educated Americans say the American Dream still holds true, while less than one-third (32%) say it once held true, but not anymore. By contrast, less than half (47%) of white working-class Americans say the American Dream still holds true, while an equal number (47%) say that it once held true, but not anymore.
White (54%) and Hispanic (55%) Americans are more likely than black Americans (46%) to say the American Dream still holds true. Republicans (60%) are more likely than Democrats (50%) and Independents (51%) to say that the American Dream still holds true.
Optimism About America’s Future
A solid majority (54%) of Americans agree that America’s best days are ahead of us, while less than 4-in-10 (38%) say America’s best days are behind us. Some groups, however, are considerably more optimistic about America’s future than others.
While nearly 6-in-10 (57%) white college-educated Americans believe that America’s best days are ahead of us, white working-class Americans are evenly split on whether America’s best days are ahead of us (46%) or behind us (46%).
Within the white working class, there are significant differences by region and generation. White working-class Americans in the South are less optimistic about America’s future than are white working-class Americans in the West. A majority (52%) of white working-class Americans in the South believe that America’s best days are behind us. By contrast, nearly 6-in-10 (58%) white working-class Americans in the West believe that America’s best days are ahead of us. White working-class Americans in other regions of the country are more divided: a slim majority (51%) of white working-class Americans in the Northeast believe that America’s best days are ahead of us. Half (50%) of white working-class Americans in the Midwest agree that America’s best days are behind us. Younger white working-class Americans (age 18-39) are more likely than senior white working-class Americans (age 65 and older) to say that America’s best days are ahead of us (50% vs. 40%).
Black and Hispanic Americans are more hopeful about America’s prospects than are white Americans. Around two-thirds (66%) of black Americans and about 6-in-10 (58%) Hispanic Americans say America’s best days are ahead of us, compared to 51% of white Americans.
White evangelical Protestants, on the other hand, are decidedly more pessimistic about America’s current trajectory than are members of other religious faiths. A plurality (47%) of white evangelical Protestants say America’s best days are behind us, while 44% disagree, saying that America’s best days are yet to come. By contrast, black Protestants (64%) and Catholics (58%) say that America’s best days are ahead. Similarly, slim majorities of the religiously unaffiliated (53%) and white mainline Protestants (52%) agree that America’s best days are ahead of us.
Democrats’ views on America’s future are considerably more positive than Republicans’ outlook. More than 6-in-10 (64%) Democrats agree that America’s best days are ahead of us, while less than 3-in-10 (29%) say America’s best days are behind us. By contrast, Republicans are divided, with 47% saying America’s best days are ahead, and 43% saying America’s best days are behind us. Independents are about as optimistic as Republicans: half (50%) say America’s best days are yet to come, while 42% say America’s best days are over.
American Exceptionalism
Overall, most Americans believe that their country has a divinely ordained place in human history. A solid majority (62%) of Americans agree that God has granted America a special role in human history, while fewer than one-third (32%) disagree. White working-class Americans (70%) are substantially more likely than white college-educated Americans (42%) to believe that America has a divinely ordained place in history. There are, however, substantial regional differences among white working-class Americans. White working-class Americans in the South (80%) are more likely than white working-class Americans in the Midwest (66%), West (66%), and Northeast (61%) to agree that God has granted America a special role in human history.
With the exception of religiously unaffiliated Americans, all major religious groups agree that God has granted America a special role in human history. There are, however, significant variations in intensity. Over 8-in-10 white evangelical Protestants (85%) and black Protestants (82%) believe that America has a divinely ordained role in history, compared to 63% of Catholics and 55% of white mainline Protestants.
America As a Christian Nation
Americans are divided on the extent to which America can be considered a Christian nation. Americans are about as likely to believe that America was a Christian nation in the past, but is not now (41%) as they are to believe that America has always been and is currently a Christian nation (39%). Fewer than 1-in-5 (15%) say that American has never been a Christian nation.
White working-class Americans differ substantially from white college-educated Americans on this question. While roughly equal numbers of white working-class Americans and white college-educated Americans believe that America has always been and is currently a Christian nation (39% vs. 44%), white working-class Americans are more likely than white college-educated Americans to say that America was a Christian nation in the past, but is not now (46% vs. 30%). By contrast, white college-educated Americans are nearly twice as likely as white working-class Americans to say that America has never been a Christian nation (20% vs. 11%).
White working-class Americans from different regions are divided on this question. White working-class Americans from the West (45%) are more likely than white working-class Americans from the Northeast (35%) to believe that America is currently and always has been a Christian nation, while white working-class Americans from the Midwest (36%) and South (39%) fall in between. White working-class Americans in the South (53%) are more likely than white working-class Americans in the Northeast (43%) and West (39%) to say that America was a Christian nation in the past, but is not now.
A majority (52%) of Republicans agree that America has always been and is currently a Christian nation, while 42% believe that America was a Christian nation in the past, but is not now. Democrats are divided: 38% agree that American has always been and is currently a Christian nation, and 38% believe that America was a Christian nation in the past, but is not now. One-third (33%) of Independents believe that America has always been a Christian nation, but a plurality (42%) of Independents agree that America was a Christian nation in the past, but is not now. Notably, Democrats and Independents are over six times more likely than Republicans to believe that America has never been a Christian nation (19%, 18%, and 3%, respectively).
There are few differences among Americans of different religious denominations, with the exception of the religiously unaffiliated. Only one-quarter (25%) of religiously unaffiliated Americans believe that America has always been and is currently a Christian nation, while 32% say that America was a Christian nation in the past, but is not now. Notably, a plurality (34%) of religiously unaffiliated Americans say that America has never been a Christian nation.
A majority (56%) of seniors believe that America has always been and is currently a Christian nation, while 35% say that America was a Christian nation in the past but is not now. By contrast, a plurality (43%) of Millennials agree that America was a Christian nation in the past, but is not now, while 29% believe that America has always been and is currently a Christian nation. Millennials are more than four times as likely as seniors to say that America has never been a Christian nation (22% vs. 5%).
VI. Discrimination and Diversity in America
Government Attention to the Problems of Minorities
Nearly 6-in-10 (57%) Americans do not believe that the government has paid too much attention to the problems of blacks and other minorities over the past few decades, while 4-in-10 (40%) agree. There are large divisions by social class, race, and party affiliation on this question.
Nearly one-third (32%) of white college-educated Americans agree that the government has paid too much attention to the problems of minorities over the past few decades, while nearly two-thirds (65%) disagree. By contrast, white working-class Americans are nearly evenly divided (49% agree, 46% disagree).
There are large regional differences within the white working class. Only 40% of white working-class Americans in the West agree that the government has paid too much attention to the problems of minorities over the past few decades. However, a solid majority (58%) of white working-class Americans in the South agree that the government has paid too much attention to the problems of blacks and other minorities. White working-class Americans in the Northeast (48% agree, 48% disagree) and Midwest (48% agree, 47% disagree) are divided.
Black Americans (20%) are substantially less likely than white Americans (43%) to believe that the government has paid too much attention to the problems of blacks and other minorities over the past few decades. However, Hispanic Americans (43%) are equally as likely as white Americans to believe that the government has paid too much attention to the problems of blacks and other minorities.
Republicans (57%) are more than twice as likely as Democrats (26%) to agree that the government has paid too much attention to the problems of blacks and other minorities over the past few decades, while Independents (42%) fall in between. Similarly, nearly two-thirds (64%) of Americans who identify with the Tea Party believe that the government has paid too much attention to the problems of blacks and other minorities.
Perceptions of “Reverse Discrimination” Against White Americans
Americans are divided on whether discrimination against whites has become as big a problem as discrimination against blacks and other minorities (47% agree, while 51% disagree). There are substantial divides on this question by social class, age, party affiliation, religious affiliation, and race.
Six-in-ten (60%) white working-class Americans agree that discrimination against whites has become as big a problem as discrimination against blacks and other minorities, compared to only 39% of white college-educated Americans. However, these views are not uniformly shared among white working class Americans, and differ substantially according to region. White working-class Americans in the South (69%) are more likely than white working-class Americans in the West (59%), Midwest (56%), and Northeast (55%) to believe that discrimination against whites is as big a problem as discrimination against blacks and other minorities.
White Americans overall are nearly twice as likely as black Americans to agree that discrimination against whites has become as big a problem as discrimination against blacks and other minorities (53% vs. 27%). Roughly one-third (35%) of Hispanic Americans believe that discrimination against whites has become as big a problem as discrimination against blacks and other minorities, while more than 6-in-10 (62%) disagree.
Similarly, Republicans (66%) are twice as likely as Democrats (33%) to believe that discrimination against whites has become as big a problem as discrimination against blacks and other minorities. Less than half (46%) of Independents believe that discrimination against whites has become as big a problem as discrimination against blacks and other minorities, while a slim majority (51%) disagree.
Nearly two-thirds (65%) of white evangelical Protestants and a slim majority (52%) of white mainline Protestants agree that discrimination against whites has become as big a problem as discrimination against blacks and other minorities. Though Catholics overall are divided (49% agree, 49% disagree), white Catholics (55%) are substantially more likely than Hispanic Catholics (36%) to believe that discrimination against whites has become as big a problem as discrimination against blacks and other minorities.
Seniors (51%) are more likely than Millennials (40%) to believe that discrimination against whites has become as big a problem as discrimination against blacks and other minorities.
The DREAM Act
Overall, six-in-ten (60%) Americans favor the basic tenets of the DREAM Act – allowing illegal immigrants brought to the U.S. as children to gain legal status if they join the military or go to college – while 36% are opposed. Despite this high level of support, there are significant differences by social class, age, education, party affiliation, race, and religious affiliation.
Although a slim majority (51%) of white working-class Americans favor the basic tenets of the DREAM Act, their support for this policy is significantly lower than support among white college-educated Americans (67%). Notably, there are few regional differences among white working-class Americans: majorities of white working-class Americans in the Northeast (55%), West (55%), and South (52%) favor the basic tenets of the DREAM Act. White working-class Americans in the Midwest are divided: 47% favor allowing illegal immigrants brought to the U.S. as children to gain legal status if they join the military or go to college, while 48% are opposed.
Younger white working-class Americans (age 18-29) are more likely than senior white working-class Americans (age 65 and older) to support the basic tenets of the DREAM Act (62% vs. 46%).
Hispanic Americans have high levels of support for the central tenets of the DREAM Act: three-quarters (75%) of Hispanic Americans favor allowing illegal immigrants brought to the U.S. as children to gain legal status if they join the military or go to college. Majorities of black (61%) and white (57%) Americans also favor this policy, but with less intensity.
There are dramatic political differences. More than six-in-ten Democrats (68%) and Independents (61%) favor allowing illegal immigrants brought to the U.S. as children to gain legal status if they join the military or go to college. Less than half (48%) of Republicans support this policy, while 47% are opposed.
Almost seven-in-ten religiously unaffiliated Americans (69%) favor allowing illegal immigrants brought to the U.S. as children to gain legal status if they join the military or go to college. White evangelical Protestants are the only religious group in which a majority does not support the basic tenets of the DREAM Act. Instead, white evangelical Protestants are split on the issue, with 47% in favor and 49% opposed. There are also noteworthy differences in intensity between Hispanic Catholics and white Catholics. While 63% of Catholics overall favor the basic tenets of the DREAM Act, over 7-in-10 (71%) Hispanic Catholics support allowing illegal immigrants brought to the U.S. as children to gain legal status if they join the military or go to college, compared to 59% of white Catholics.
Similarly, while majorities of all age groups support allowing illegal immigrants brought to the U.S. as children to gain legal status if they join the military or go to college, Millennials are substantially more likely than seniors to favor this policy (72% vs. 51%).
VII. Other Issues
Same-sex Marriage
Americans remain divided on the issue of same-sex marriage. Overall, nearly half (49%) of Americans favor allowing gay and lesbian couples to marry legally, while 45% are opposed. There are substantial differences on this question by political affiliation, religious affiliation, and age. The differences between white working-class Americans and white college-educated Americans are covered above on page 19.
White Americans are, overall, divided on same-sex marriage, with 47% in favor, and 46% opposed. A majority (52%) of Hispanic Americans favor same-sex marriage, while 42% are opposed. Black Americans are evenly divided, with 47% in favor of same-sex marriage and 47% opposed.
More than 6-in-10 (63%) Democrats support allowing gay and lesbian couples to marry legally, compared to 51% of Independents and around one-quarter (26%) of Republicans.
Religious Americans are divided over the issue of same-sex marriage. Majorities of the religiously unaffiliated (73%), non-Christian religious Americans (70%), and Catholics (54%) favor same-sex marriage. Half (50%) of white mainline Protestants support allowing gay and lesbian couples to marry, while 42% are opposed. Black Protestants are divided on the issue of same-sex marriage (47% favor, 49% opposed). Seven-in-ten (70%) white evangelical Protestants are opposed to samesex marriage. A majority (51%) of white evangelical Protestants report that they are strongly opposed to this policy.
Women (54%) are more likely than men (44%) to support allowing gay and lesbian couples to marry legally. Similarly, nearly 7-in-10 (68%) Millennials (age 18-29) favor same-sex marriage, compared to less than one-third (31%) of seniors (age 65 and older).
Abortion
A majority of Americans believe that abortion should be legal in all or most cases (54%), while 41% think abortion should be illegal in all or most cases. There are no noteworthy differences by gender or age, but there are significant differences by race, party affiliation, and religious affiliation. The differences between white working class Americans and white college educated Americans are covered above on page 19.
Black Americans (60%) are more likely than white (54%) or Hispanic (47%) Americans to say that abortion should be legal in all or most cases. Similarly, Democrats (67%) and Independents (55%) are more likely than Republicans (37%) to believe that abortion should be legal in all or most cases.
With the exception of white evangelical Protestants, majorities of all religious groups – including 74% of religiously unaffiliated Americans, 73% of non-Christian religious Americans, 64% of white mainline Protestants, 61% of black Protestants, and 51% of Catholics – believe that abortion should be legal in all or most cases. Over 6-in-10 (64%) white evangelical Protestants say that abortion should be illegal in all or most cases, while 32% say it should be legal in all or most cases.
The Environment
A majority of Americans (53%) favor tougher laws and regulations to protect the environment even if it raises prices or cost jobs, while 45% are opposed. There are noteworthy differences by social class, age, political affiliation, and religious affiliation.
Nearly two-thirds (64%) of white college-educated Americans support tougher laws and regulations to protect the environment even if it raises prices or costs jobs. White working-class Americans, by contrast, are divided (48% favor, 49% opposed). However, younger white working-class Americans (18-39) are more likely than senior white working-class Americans (65 and older) to favor tougher laws and regulations to protect the environment even if it raises prices or costs jobs (52% vs. 39%).
There are substantial political differences on the extent to which the environment should be protected. Nearly two-thirds (64%) of Democrats favor tougher laws and regulations to protect the environment, compared to 37% of Republicans. A slim majority (53%) of Independents are in favor, while 44% are opposed.
Religiously unaffiliated Americans (69%) are significantly more likely more than other religious groups to favor tougher laws and regulations to protect the environment, even if they raise prices or cost jobs. A slim majority (52%) of white mainline Protestants favor tougher laws and regulations, while Catholics are divided, with 50% in favor and 47% opposed. Black Protestants are also nearly evenly divided (48% favor, 49% opposed). Meanwhile, a solid majority (57%) of white evangelical Protestants are opposed to tougher laws and regulations to protect the environment, even if they raise prices or cost jobs.
There is also a striking generational gap: nearly 6-in-10 (58%) Millennials favor tougher laws or regulations to protect the environment, compared to 42% of seniors.
Endnotes
1 In the current survey, a definition of the white working class that relied solely on education (those without a 4-year college degree), would yield a definition that finds white working class Americans accounting for nearly half (47%) of the adult population.
2 Four subgroups merited additional consideration: retirees, homemakers, disabled Americans, and students. Retirees who met the educational requirements and who reported not having a salaried position in their last full-time job were also included in the definition. Homemakers and disabled Americans who met the educational requirements were also included. Because the education variable did not allow us to discern whether students were currently in 4-year programs or 2-year programs, students were screened using an additional self-identification question. White students with only some college education were only included in the definition if they self-identified as working class or lower class.
3 These figures include the unemployed and retirees but not students, homemakers or the disabled. In other words, the figures include only those Americans who currently belong to or used to belong to the workforce.
4 There are substantial racial differences on this question: black non-Hispanic Americans (40%) are considerably less likely than Hispanic Americans (55%) or white Americans (63%) to say they display the American flag at their home, in their office, or on their car.
5 The original battery of desirable childhood traits asked whether Americans preferred respect for elders or independence, good manners or curiosity, self-reliance or obedience, and “well-behaved” or considerate. We substituted “creative” for “considerate” in the last pair.
6 Respondents who reported having no opinion or who volunteered that both traits were important on any of the four measures were excluded from the analysis. The Cronbach’s alpha for this scale is 0.65.
7 The voter numbers reported here are based on preferences in early to mid-August and do not reflect changes in the race that have occurred subsequently.
8 Public Religion Research Institute, PRRI/RNS Religion News Survey, November 2011.
Recommended citation:
Jones, Robert P., and Daniel Cox. “Beyond Guns and God: Understanding the Complexity of the White Working Class in America.” PRRI. 2012. http://www.prri.org/research/race-class-culture-survey-2012/.