Executive Summary
Download the full report in PDF.
Throughout 2013, there has been consistent bipartisan and cross-religious support for creating a path to citizenship for immigrants living in the United States. Today, 63% of Americans favor providing a way for immigrants who are currently living in the United States illegally to become citizens provided they meet certain requirements, while 14% support allowing them to become permanent legal residents but not citizens, and roughly 1-in-5 (18%) favor a policy that would identify and deport all immigrants living in the United States illegally. This support for a path to citizenship has remained unchanged from earlier this year, when in both March and August 2013 an identical number (63%) supported a path to citizenship for immigrants currently living in the United States illegally.
- Roughly 6-in-10 Republicans (60%) and independents (57%) and approximately 7-in- 10 (73%) Democrats favor a path to citizenship for immigrants currently living in the United States illegally.
- Majorities of white evangelical Protestants (55%), white mainline Protestants (60%), Catholics (62%), minority Protestants (69%), and the religiously unaffiliated (64%) also favor a path to citizenship for immigrants currently living in the United States illegally.
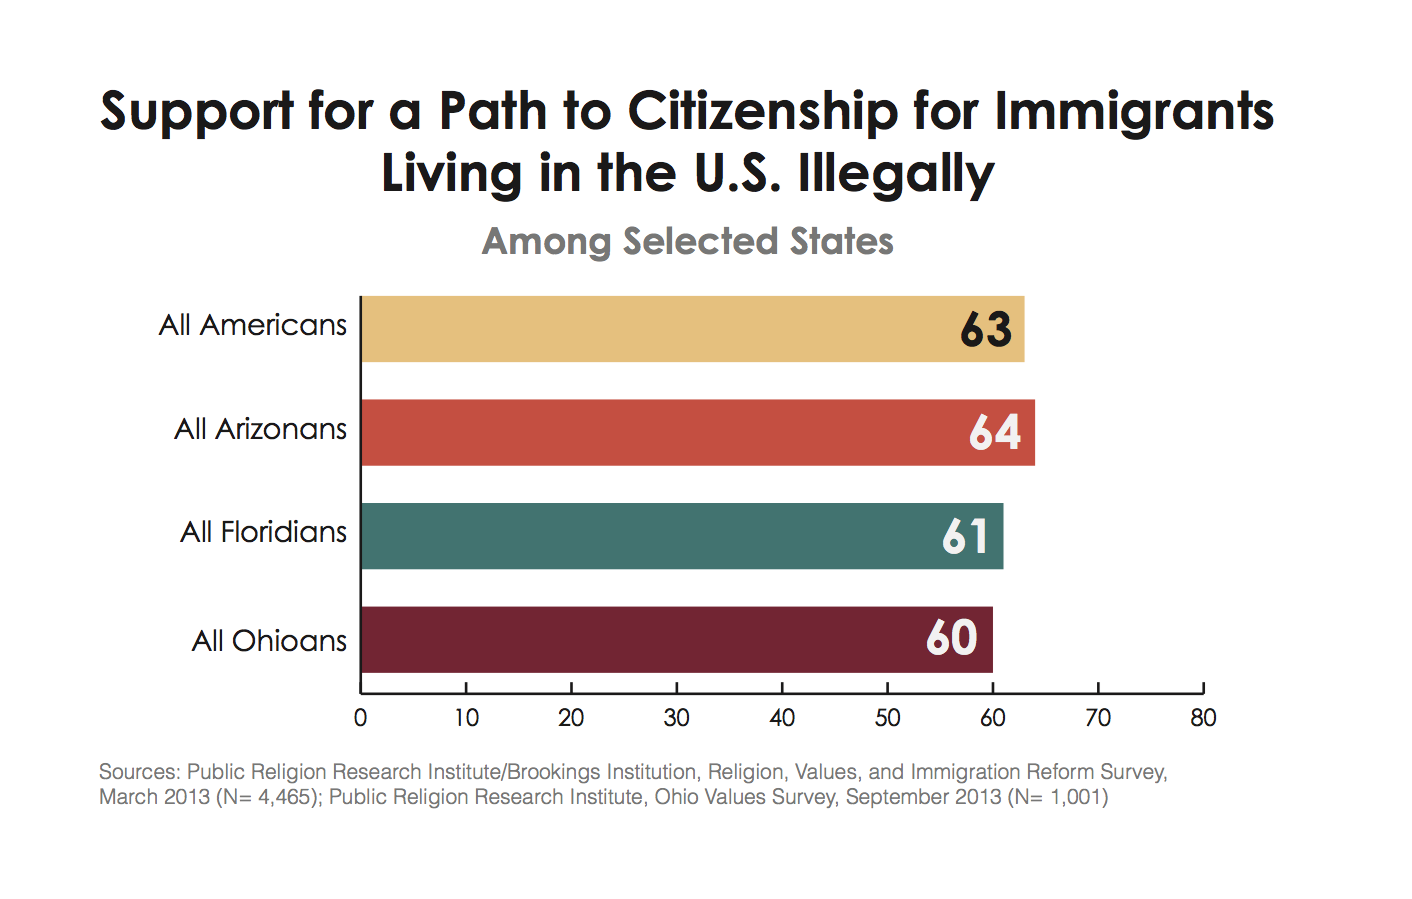
Despite having different experiences with immigrants, there is remarkable consistency in support for immigration reform policy across key states.
- Roughly 6-in-10 Ohioans (60%), Floridians (61%), and Arizonans (64%) favor a path to citizenship for immigrants currently living in the United States illegally.
- More than 6-in-10 (61%) Americans favor the DREAM Act, which would allow immigrants brought illegally to the United States as children a way to attain legal resident status by joining the military or going to college, while 34% oppose. The profiles of Ohio (60% favor, 34% oppose), Arizona (64% favor, 36% oppose), and Florida (64% favor, 33% oppose) residents look nearly identical to all Americans on this question.
Compared to earlier this year, Americans are now significantly more likely to say the U.S. immigration system is completely broken.
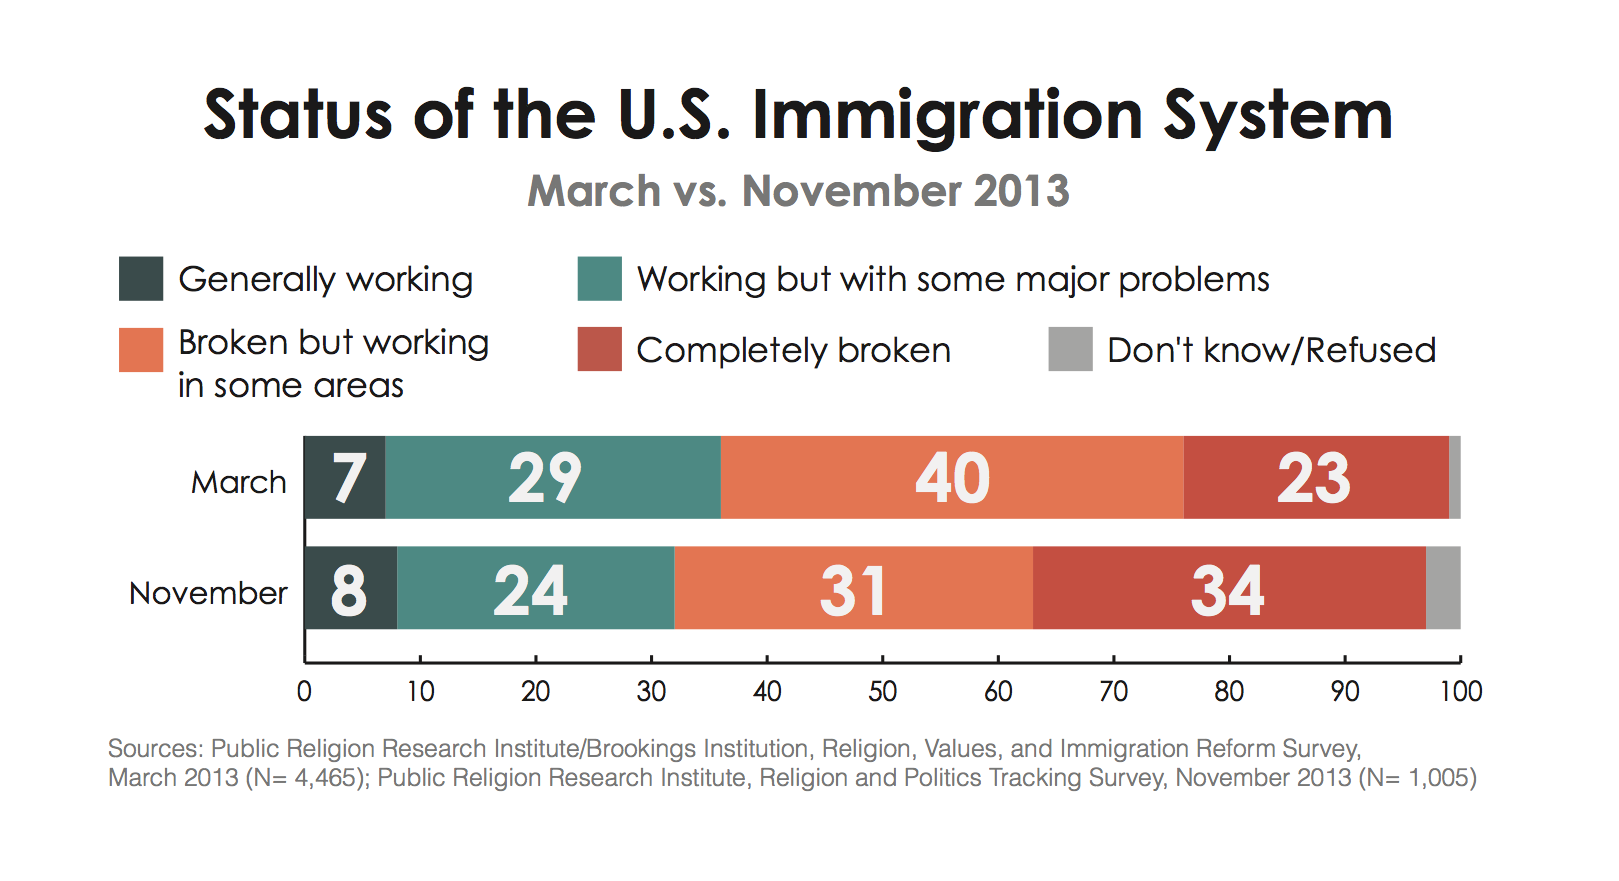
- Nearly two-thirds of Americans believe the U.S. immigration system is either completely broken (34%) or mostly broken but working in some areas (31%).
- In March 2013, more than 6-in-10 Americans said the immigration system was completely broken (23%) or mostly broken but working in some areas (40%).
Between March 2013 and today, there has been no significant shift in Americans’ opinions about how high a priority immigration reform should be for President Obama and Congress.
- Roughly 4-in-10 (41%) Americans believe immigration policy should be an immediate priority for President Obama and be a priority during the next couple of years. Only 14% of Americans say it should not be a priority at all. Notably, Hispanic Americans (55%) are significantly more likely than both white Americans (38%) and black Americans (39%) to say immigration policy should be an immediate priority for President Obama and Congress.
- In March 2013, 37% reported that immigration policy should be an immediate priority for the president and Congress, while 46% said it should be a priority over the next couple of years, and only 17% said it should not be a priority.
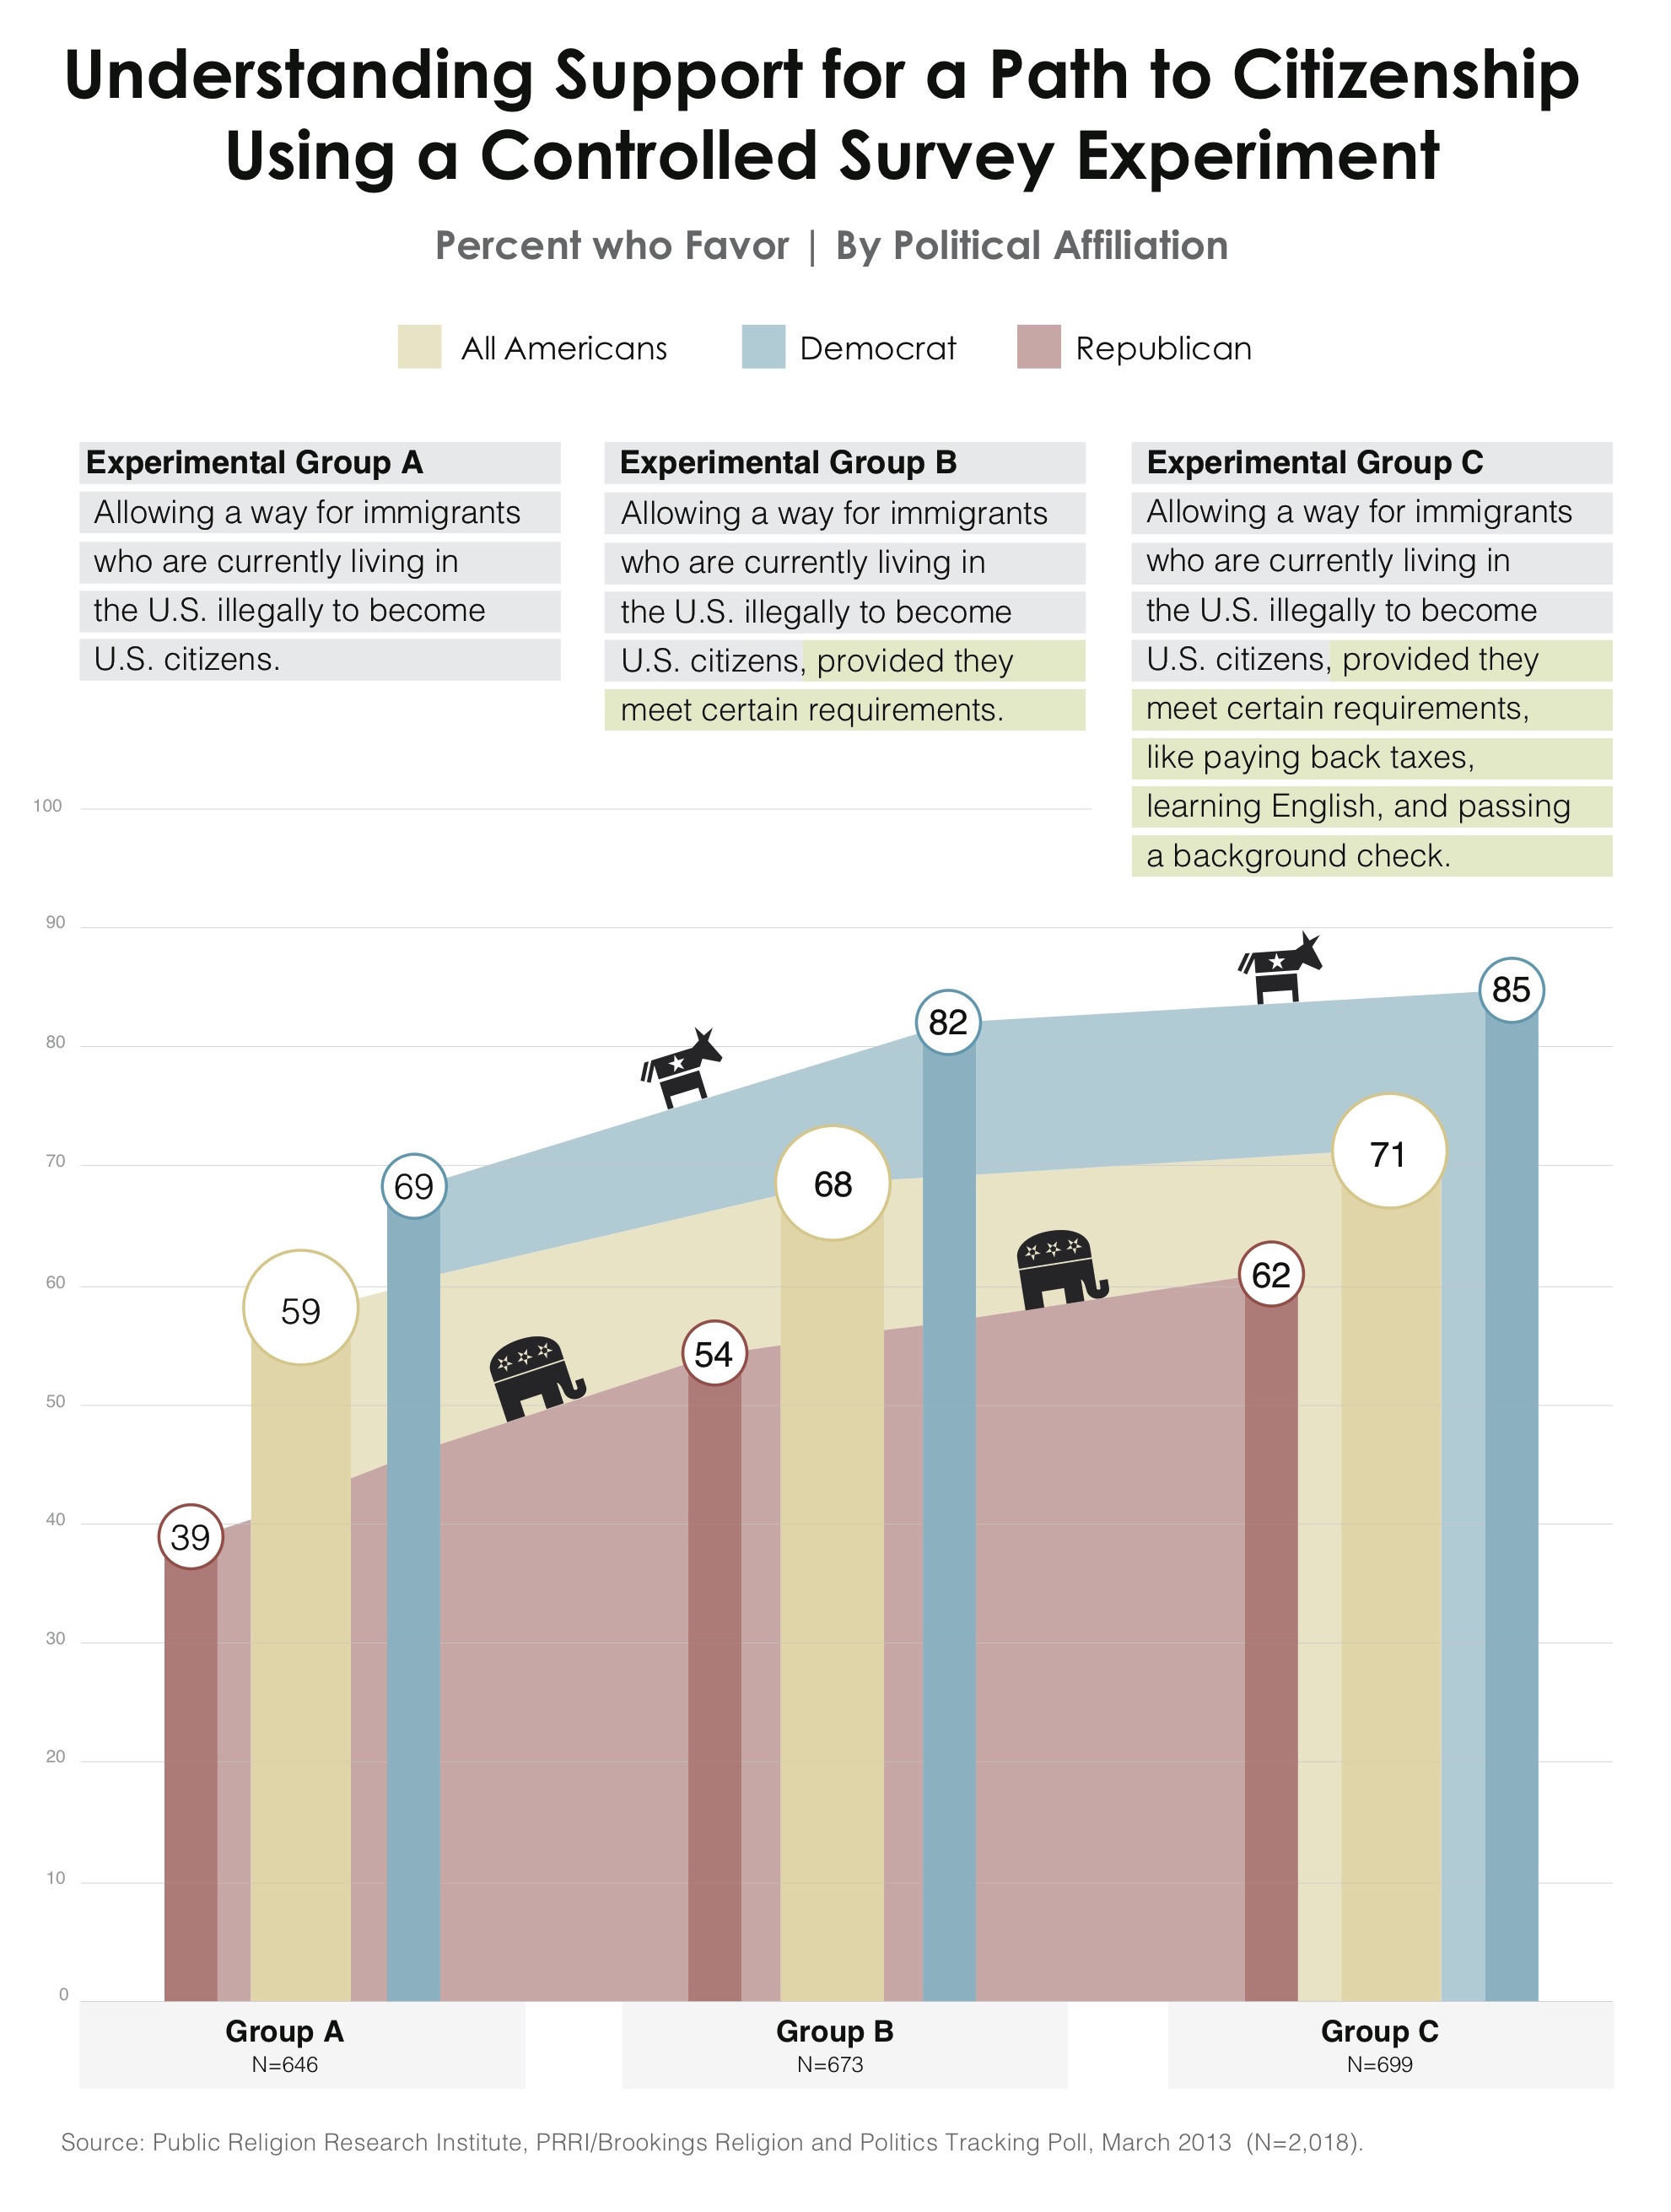
Using a controlled survey experiment, PRRI found survey questions that make no mention of requirements immigrants living in the country illegally must meet produce lower support for a path to citizenship than questions that do mention requirements, especially among more conservative groups such as Republicans and white evangelical Protestants.
- When there is no mention of requirements that immigrants living in the country illegally must meet, nearly 6-in-10 (59%) Americans support a path to citizenship.
- When the question mentions “certain requirements” that immigrants living in the country illegally must meet, nearly 7-in-10 (68%) Americans support a path to citizenship.
- When the question references specific requirements such as paying back taxes, learning English, and passing a background check, 71% support a path to citizenship.
There is general consensus across religious and political lines that the proposed 13-year waiting period is too long. Nearly 7-in-10 (68%) Americans feel that a 13-year waiting period for someone to receive citizenship is too long, roughly one-quarter (24%) say this length of time is about right, and only 5% report that it is too short.
More Americans than not (43%) say that an estimated $4,000 per person in mandatory fines and fees is too much, although a substantial minority (35%) say this amount is about right. Only 16% of Americans believe that $4,000 in fines and fees is too little.
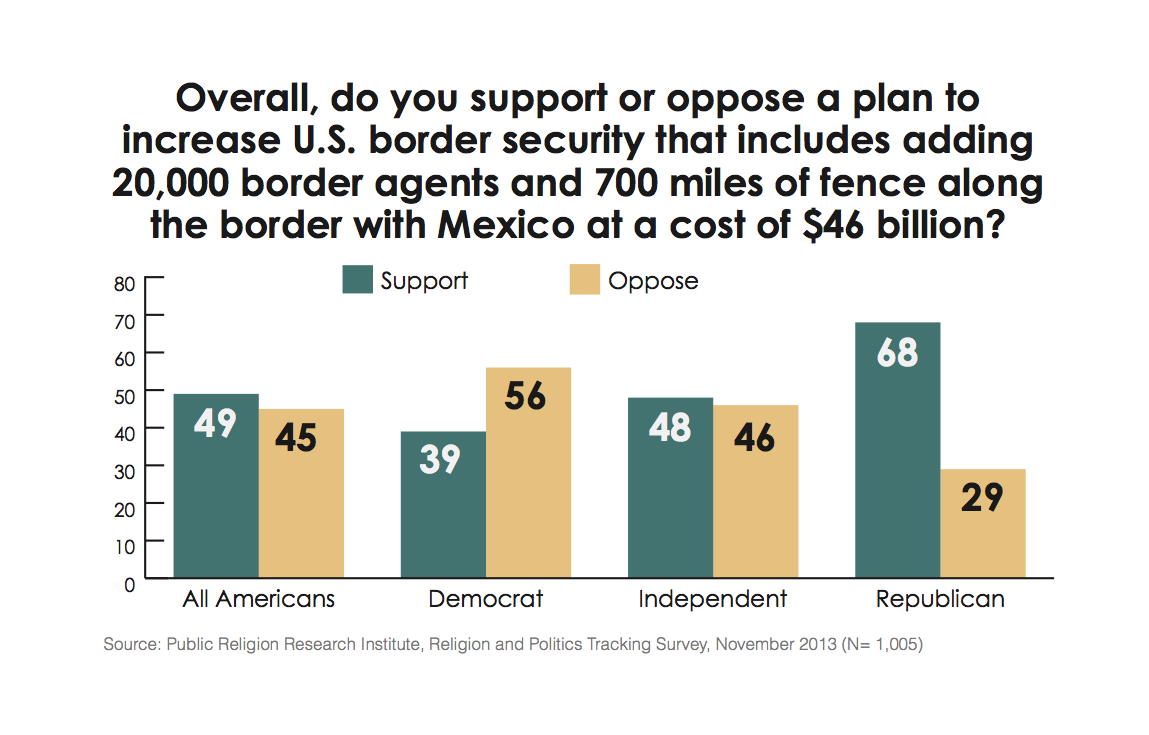
Americans are divided on the issue of increasing border security to include adding 20,000 new border control agents and 700 miles of fencing along the border with Mexico at an estimated cost of $46 billion. Nearly half (49%) are in favor of this proposal, while nearly as many (45%) are opposed.
I. American Attitudes about Immigration Reform in 2013
Stable Support for a Path to Citizenship
Throughout 2013, views on immigration reform have remained remarkably steady, with more than 6-in-10 expressing support for a policy that would provide a way for immigrants who are currently living in the United States illegally to become citizens, provided they meet certain requirements. Currently, 63% of Americans support a path to citizenship, while 14% support allowing them to become permanent legal residents but not citizens, and roughly 1-in-5 (18%) favor a policy that would identify and deport all immigrants living in the United States illegally. This support for a path to citizenship has remained unchanged from earlier in the year, when in both March and August 2013 an identical number (63%) supported a path to citizenship for immigrants who are living in the United States illegally.1
In March 2013, majorities of self-identified Democrats, independents, and Republicans supported a path to citizenship for immigrants living in the country illegally, and this remains true today. The political landscape has since shifted modestly, with an increase in support among Republicans for a path to citizenship for immigrants living in the country illegally accompanied by a decrease in support among independents. Support among Republicans for a path to citizenship has risen from 53% in March to 60% today. Conversely, support among independents has fallen from 64% in March to 57% today. Support for a path to citizenship has remained steady among Democrats, with 71% supporting the policy in March and 73% supporting it today.
There has also been relative stability among ideological groups in levels of support during the year. In March 2013, a majority (54%) of conservatives, 67% of moderates, and 72% of liberals supported a path to citizenship for immigrants living in the country illegally. Today, nearly 6-in-10 (58%) conservatives, 63% of moderates, and 72% of liberals support a path to citizenship.
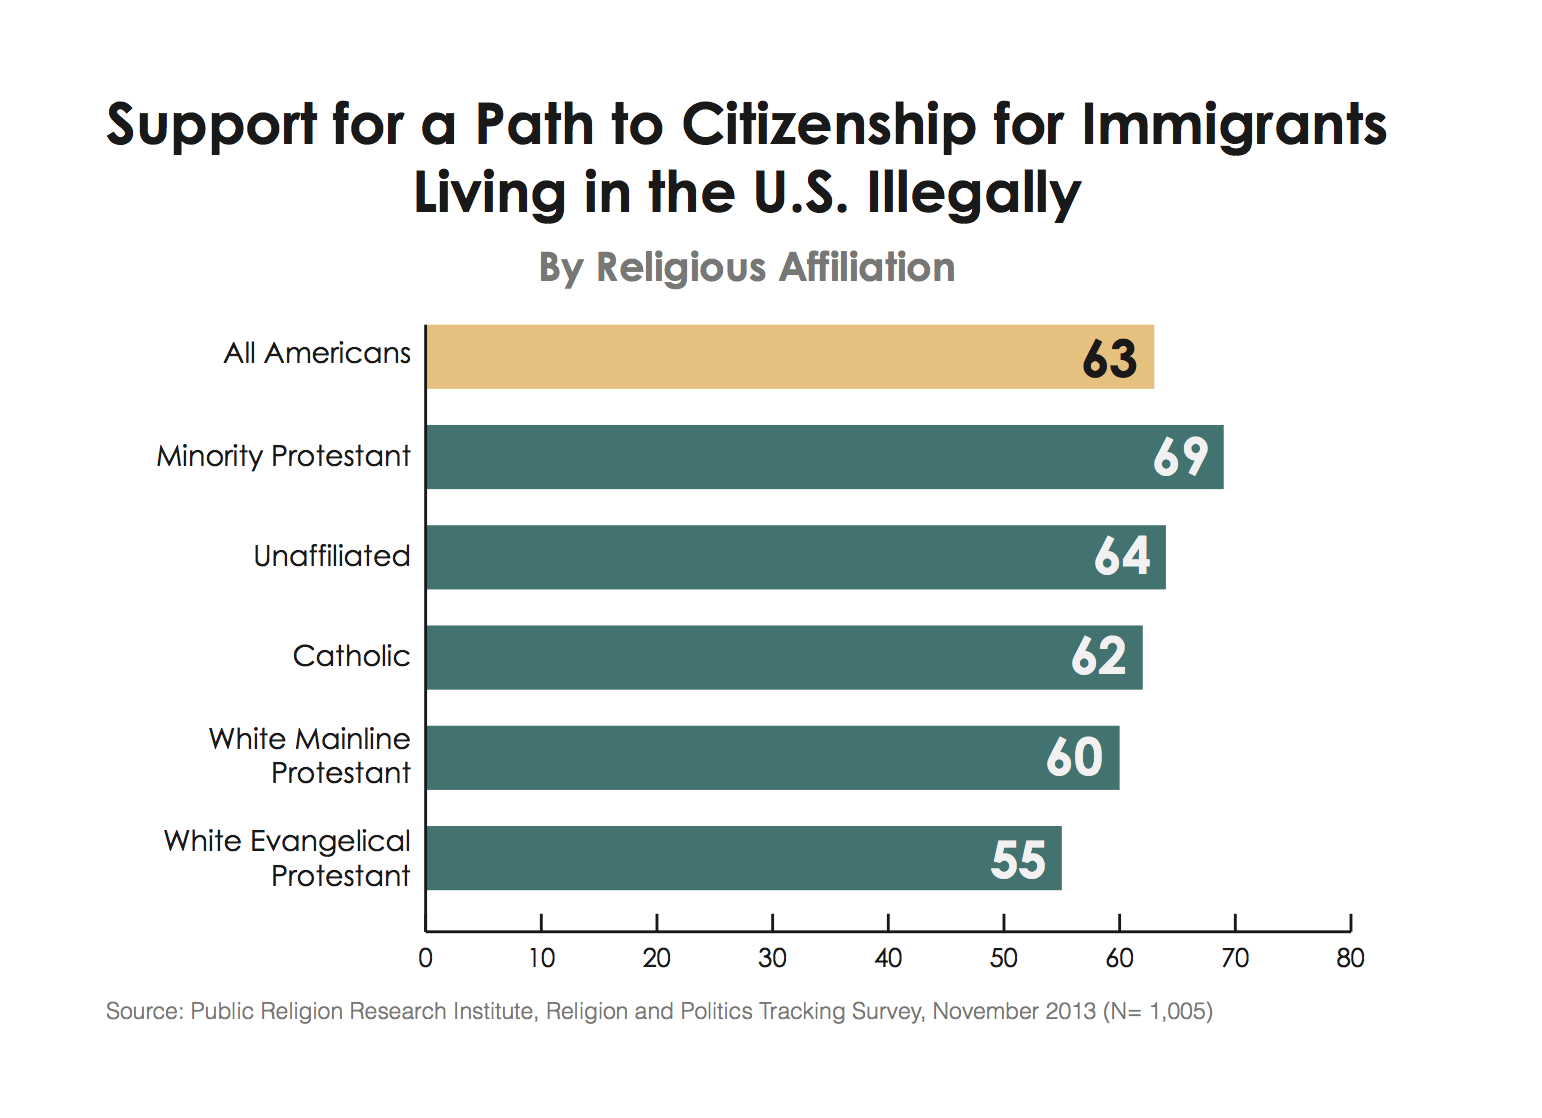
As in March 2013, majorities of all major religious groups support a path to citizenship for immigrants living in the country illegally. There have been no significant shifts in levels of support among religious groups during the year. Earlier in 2013, a majority of white evangelical Protestants (56%), and more than 6-in-10 white mainline Protestants (61%), minority Protestants (68%), Catholics (65%), and religiously unaffiliated Americans (64%) supported a policy that would allow immigrants currently living in the United States illegally to become citizens. At the end of 2013, nearly identical numbers of white evangelical Protestants (55%), white mainline Protestants (60%), minority Protestants (69%), Catholics (62%), and the religiously unaffiliated (64%) voiced support for this policy.
Growing Belief that the U.S. Immigration System is Broken
Compared to earlier this year, Americans are now significantly more likely to say the U.S. immigration system is completely broken. Nearly two-thirds of Americans believe the U.S. immigration system is either completely broken (34%) or mostly broken but working in some areas (31%). Only about one-third of the public believes the immigration system is generally working (8%) or that it is mostly working but with some major problems (24%). Earlier this year, more than 6-in-10 Americans said the immigration system was completely broken (23%) or mostly broken but working in some areas (40%). Across the political spectrum during 2013, Americans have become more likely to say the immigration system is completely broken.2
Few Americans are aware that deportation rates have increased during the past five or six years, and knowledge of the change in deportation rates varies by geographic location.3 Among Americans overall, less than 3-in-10 (28%) report, correctly, that the number of immigrants who were deported back to their home countries has increased in recent years. More than 4-in-10 (42%) believe it has stayed about the same, and 18% say deportations have decreased. Americans who reside in the West are more likely than other Americans to know that the number of deportations has increased during the last few years, but even in the West only about one-third (32%) are aware that deportation rates have increased. The most substantial knowledge gap on this question is related to race and ethnicity. Nearly half (46%) of Hispanic Americans correctly report that the number of illegal immigrants who were deported back to their home countries has increased during the past five or six years, compared to 34% of Asian Americans, 31% of black Americans, and less than one-quarter (24%) of white Americans.4
Priority of Immigration Reform for President Obama and Congress
Between March 2013 and today, there has been no significant shift in Americans’ opinions about how high a priority immigration reform should be for President Obama and Congress. In March, 37% reported that immigration policy should be an immediate priority for the president and Congress, while 46% said it should be a priority over the next couple of years, and only 17% said it should not be a priority.5 Roughly 4-in-10 (41%) Americans believe that immigration policy should be an immediate priority for President Obama and Congress, while roughly as many (42%) say it should be a priority during the next couple of years. Only 14% of Americans say it should not be a priority at all. Notably, Hispanic Americans (55%) are significantly more likely than both white Americans (38%) and black Americans (39%) to say immigration policy should be an immediate priority for President Obama and Congress.
Compared to both Democrats and independents, Republicans see less urgency in addressing immigration reform. Republicans are more likely to say immigration should be addressed during the next couple of years (48%) than to say it should be dealt with immediately (37%). Democrats and independents are about equally likely to say it should be an immediate priority (41% and 41%, respectively) as to say it should be a priority during the next couple of years (44% and 41%, respectively).
Importance of Requirements in Immigration Reform Legislation
Much of the debate surrounding immigration reform has focused on which requirements should be part of the citizenship process for immigrants currently living in the United States illegally. By conducting a unique survey experiment in partnership with the Brookings Institution, PRRI found that survey questions making no mention of requirements produce lower support for a path to citizenship in immigration reform legislation than questions that do mention requirements, especially among more conservative groups such as Republicans and white evangelical Protestants.6
The importance of requirements was also expressed in focus groups conducted by PRRI in August 2013. An evangelical Protestant man in Columbus, Ohio, put it this way:
Like the average person, I work a minimum wage job, and I have to pay taxes on it. I’m having loans already going to college. And I’m going to be paying for it out of my minimum wage job. Right now I’m losing money big time, but it’s like for a hope that after I graduate from college I can get a better job, pay back those loans you know, and get a whole life. If it was clear to [immigrants coming to the U.S. illegally]…that they should have to pay these taxes, then that would be both a just consequence and a fair treatment for the other people trying to work hard.
The survey experiment randomly divided the entire sample of respondents (n=2,018) into three demographically identical subgroups, and then asked each group a slightly different version of a question that gauged support for a path to citizenship. The first version included no mention of requirements, the second version included only a general mention of requirements, and the third version included specific requirements such as paying back taxes, learning English, and passing a background check.
When there is no mention of requirements that immigrants living in the country illegally must meet, nearly 6-in-10 (59%) Americans support a path to citizenship, compared to 35% who oppose. When the question references “certain requirements” that immigrants living in the country illegally must meet, support rises significantly in the general population, among Democrats and Republicans, and among nearly all major religious groups. When meeting “certain requirements” is mentioned, American support for a path to citizenship rises 9 points to 68%, while opposition declines to 27%. Finally, when the question references specific requirements such as paying back taxes, learning English, and passing a background check, support for a path to citizenship is similar in the general population, with roughly 7-in-10 (71%) Americans reporting favoring a path to citizenship while nearly 1-in-4 (23%) oppose. Overall, compared to a baseline question that has no mention of requirements, a question that mentions general requirements increases support for a path to citizenship by 9 points, and the inclusion of specific requirements increases support for a path to citizenship by 12 points.
The inclusion of mentioned requirements affects levels of support across the political spectrum, but is most important for Republicans. When the question makes no mention of requirements immigrants must meet, only about 4-in-10 (39%) Republicans favor a policy that allows immigrants currently living in the United States illegally to become citizens. When the question makes a general mention of requirements, support among Republicans jumps 15 points, moving support into majority territory at 54%. When specific requirements are included, Republican support increases again to 62%.7 Support among independents is not significantly higher when a policy includes general requirements versus when it does not (64% vs. 63%, respectively). However, independents are more inclined to support a path to citizenship when specific requirements are included; more than 7-in-10 (72%) favor allowing immigrants to become citizens when they must first pass a background check, pay back taxes, and learn English. Among Democrats, roughly 7-in-10 (69%) support a policy to provide immigrants a path to citizenship without any mention of requirements. Support among Democrats increases to 82% when general requirements are mentioned, but there is no significant increase in support when specific requirements are given (85%).
The specification of requirements also matters in determining the support levels of different religious groups, most notably among white evangelical Protestants, white mainline Protestants, and Catholics. Fewer than half (45%) of white evangelical Protestants favor an immigration policy that allows immigrants living in the United States illegally to become citizens if no requirements are stipulated. When general requirements are mentioned in the question, support jumps 15 points to 60%. The inclusion of specific requirements, however, does not further increase support among white evangelical Protestants; 55% say they support immigration reform policy when it requires immigrants to pay back taxes, learn English and pass a background check. Among white mainline Protestants, less than half (49%) support a path to citizenship when no requirements are mentioned. With the mention of general requirements, support among white mainline Protestants increases 10 points to 59%, while nearly two-thirds (64%) favor this policy with the inclusion of specific requirements. Catholics exhibit a much different pattern. The mention of general requirements has no effect on support among Catholics, with 68% reporting support for a path to citizenship when no requirements are mentioned and 65% voicing support when the question mentions general requirements. When specific requirements are included, however, Catholic support increases significantly to nearly 8-in-10 (78%).
Specific Provisions: Fines, Waiting Periods, and Increased Border Security
Although immigration reform policy is complex and continues to evolve, some key features have been included in nearly all proposed policies: specific requirements immigrants must meet as part of a path to citizenship, and an increased investment in border security. The Senate bill that passed in June includes a 13-year waiting period before immigrants may become full citizens, an estimated $4,000 in mandatory fines and fees to be paid over the course of the citizenship process, and a $46 billion investment in increased border security that includes adding roughly 20,000 new border agents and 700 miles of new fencing along the U.S.-Mexico border.8
One of the overarching sentiments expressed in the focus groups was the idea that any requirements needed to be significant but also practical and not so onerous that they would serve as a disincentive for moving from illegal to legal status. A Catholic woman in Phoenix, Arizona, expressed this idea as follows:
Where’s the incentive? If I put my hand out and you’re going to slap it no matter what I do, why am I going to put my hand out? I mean, if no matter what I do, you’re going to punish me anyway, why am I going to step forward?
Waiting Periods
There is general consensus among the American public that the proposed 13-year waiting period is too long. Nearly 7-in-10 (68%) Americans feel that a 13-year waiting period for someone to receive citizenship is too long, roughly one-quarter (24%) say this length of time is about right, and only 5% report that it is too short.
The 13-year waiting period elicited some of the strongest reactions from focus group participants. A Catholic man in Columbus, Ohio, stated bluntly, “I think 13 years sounds more like a prison sentence than anything. It should be something like in the three- to five-year range.” An evangelical Protestant man in Orlando, Florida, echoed these sentiments with an incredulous tone:
So they get jobs, they get educations, they buy a house, they’re living the American dream, and after 13 years the government says, ‘Well, we decided no.’ So 13 years they’ve lived the dream, and now they’ve just got to give their house up, and the family, the kids they’ve had that have lived here their whole lives?
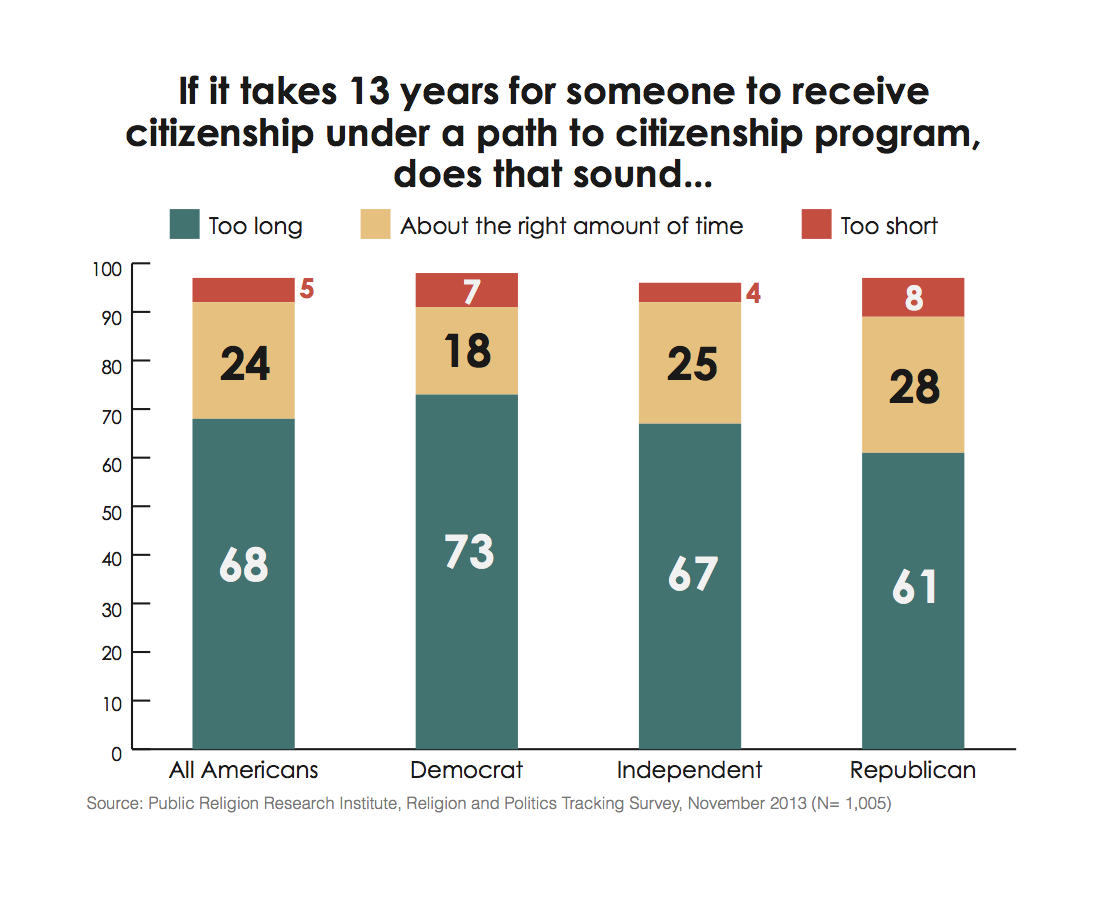
Majorities of Americans across religious and political affiliations agree that a 13-year waiting period is too long, including about 6-in-10 (61%) Republicans, two-thirds (67%) of independents, and nearly three-quarters (73%) of Democrats. Majorities of all major religious groups also agree that this length of time is too long. A majority (57%) of white evangelical Protestants, more than 6-in-10 (63%) Catholics, and roughly 7-in-10 white mainline Protestants (69%) and religiously unaffiliated Americans (71%) believe 13 years is too long a waiting period.
Fines & Fees
There is considerably more disagreement among Americans about the appropriate fines and fees that should be required as part of the citizenship process. More Americans than not say that an estimated $4,000 per person in mandatory fines and fees is too much, though a substantial minority say this amount is about right. More than 4-in-10 (43%) say $4,000 per person in fines and fees is too much, while a substantial minority (35%) say this amount is about right. Only 16% of Americans believe that $4,000 in fines and fees is too little.
This feeling of ambivalence was also reflected among the focus group participants. On one side, an evangelical Protestant man in Columbus, Ohio, argued that the fees have to “be attainable” because then “there’s a much better chance that they’ll at least attempt…to do it and not fight it.” On the other hand, many thought that the amount was too low, a sentiment expressed by a Catholic man in Orlando, Florida.
One thousand dollars a year is only twenty bucks a week. I bet you their drain on the system is more than $4,000, so at some levels we want independent citizens. We have enough drain on the system now.
There are pronounced differences across political, religious, and generational groups about the appropriate amount for mandatory fines and fees. A slim majority (52%) of Democrats say $4,000 per person is too much, compared to 30% who say it is about right and 12% who say it is too little. Independents are about as likely to say this amount is too much (40%) as they are to say it is about right (36%); 17% of independents say it is too little. Four-in-ten (40%) Republicans say that paying $4,000 in fines and fees is about right, while one-third (33%) say it is too much. More than 1-in-5 (22%) Republicans believe this amount is too little.
Among religious groups, white evangelical Protestants are significantly less likely than other groups to believe that $4,000 per person in fines and fees is too much. White evangelical Protestants are about as likely to believe this amount is too much (27%) as they are to say it is too little (26%). More than 4-in-10 (41%) white evangelical Protestants say it is about right. Roughly 4-in-10 white mainline Protestants (41%) and Catholics (42%) say this amount is too much, while nearly equal numbers say it is about right (40% and 36%, respectively). A majority (53%) of religiously unaffiliated Americans believe $4,000 in fines and fees is too much.
Younger Americans are more likely than older Americans to say the proposed fees are too much. A majority (55%) of young adults (age 18 to 29) say that having each immigrant pay up to $4,000 in fines and fees is too much, compared to 39% of seniors (age 65 and older) who say the same.
Increased Border Security
Americans are divided on the issue of increased border security, which would include adding 20,000 new border control agents and 700 miles of fencing along the border with Mexico at an estimated cost of $46 billion. Roughly half (49%) are in favor of this proposal, while nearly as many (45%) are opposed.
These divisions were also evident in the focus groups. One Catholic man in Columbus, Ohio, used the metaphor of building a house to articulate his view of the structural necessity of establishing security before allowing a path to citizenship.
I think the thing that gets me, you know, the maddest is when they want to put up this, ‘Why are you so mean to immigrants?’ [message], they’ll find the picture of the most pathetic banjoeyed child to use as their image. Would you put carpeting and furniture in a house that doesn’t have windows and a roof? No. You have to have the windows and a roof. You have to have the structure and the order, then you can have all the soft nice wonderful cushy things. Then you can have the fireplace and the fireside and the puppy dogs and the children, but you can’t have that without windows, walls and a roof.
Not everyone, however, was persuaded by such arguments. A Catholic man in Phoenix, Arizona, saw this amount of spending on border security as “ridiculous.”
I think it’s just a waste of money because there are so many areas where the fences can’t go – they can’t affect the national park, they can’t affect an environmental zone, they can’t go through the water… I mean, it’s ridiculous, the idea that we could somehow fence off that border. So knowing that that can’t be done, throwing billions of dollars at it is a complete waste of money.
There are wide differences of opinion between Americans of different political affiliations. Nearly 7-in-10 (68%) Republicans support increased border security measures that include additional border agents and fencing, including 42% who strongly support it. Independents are divided: nearly half (48%) of independents favor this policy, while a similar number (46%) oppose. In contrast, a majority of Democrats (56%) oppose this policy, compared to less than 4-in-10 (39%) who favor it.
Most religious groups are in favor of increased border security measures that include more border security agents and fencing. Six-in-ten (60%) white evangelical Protestants and a majority of white mainline Protestants (53%) and Catholics (52%) support this plan to increase U.S. border security. Religiously unaffiliated Americans are among the only religious groups opposed to these proposed new security measures. More than 6-in-10 (62%) religiously unaffiliated Americans oppose this plan, compared to roughly one-third (33%) who favor it.
II. Immigration Reform and Local Contexts: Ohio, Arizona, and Florida
The frequency with which Americans come into contact and interact with immigrants varies considerably by their place of residence. In order to assess the different experiences of Americans in their local contexts, PRRI conducted a series of four focus groups in three states: Ohio, Arizona, and Florida. Because of the large sample size of the PRRI/Brookings Religion, Values, and Immigration Reform Survey (March 2013), PRRI was also able to report out results for these three states from the national survey.9 Additionally, PRRI conducted the Ohio Values Survey in August 2013, which provided an in-depth look at Ohioans’ attitudes on a path to citizenship and specific provisions of the Senate immigration reform bill.10 The analysis below draws on these sources.
Local Contexts and Experiences
Overall, nearly half of Americans report living in a community with many new immigrants (24%) or some new immigrants (23%). Americans living in Arizona and Florida are about as likely to say their community has many new immigrants or some new
immigrants (48% vs. 42%) as Americans overall. In contrast, less than one-third of Ohioans report living in a community with many new immigrants or some new immigrants (32%). Roughly two-thirds (66%) of Ohioans report that their community has only a few or almost no new immigrants, compared to half (50%) of Floridians and 44% of Arizonans.
There are also notable geographic divisions in how often Americans interact with immigrants who do not speak English. Among all Americans, half (50%) say they often come into contact with immigrants who speak little or no English, a rate significantly higher than the 31% of Ohioans who say the same, but lower than rates reported by residents of Arizona (60%) and Florida (60%). Roughly 1-in-4 (23%) Americans say they rarely or never come into contact with immigrants who speak little or no English, marking a substantial difference both from Ohioans (36%), who are more likely to say the same, and Arizonans (15%) and Floridians (19%), who are less likely.
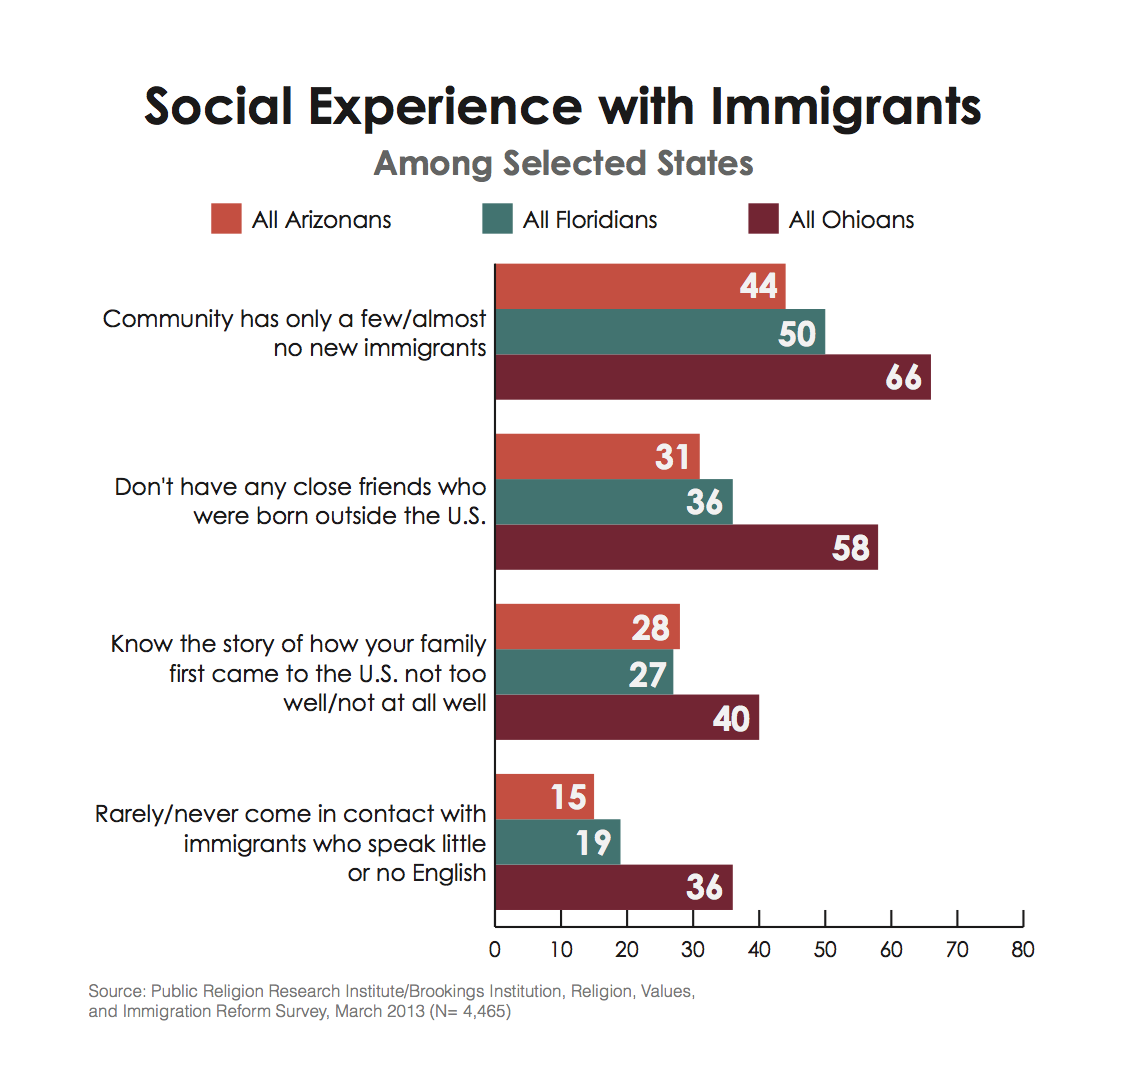
Most Americans (61%) report that they have a close friend who was born outside the United States, while 39% say they do not. Ohioans are less likely than Americans overall to report having a close friend born outside the United States (41%), while Arizonans (69%) and Floridians (64%) report levels similar to all Americans.
Nearly 7-in-10 Americans know the story of how their family first came to the United States either very well (43%) or somewhat well (26%), while roughly 3-in-10 (29%) report they do not know their family’s immigration story well. Ohioans are less likely than Americans overall to report knowing how their family first came to the United States, with fewer than 6-in-10 reporting they know their family’s immigration story very well (35%) or somewhat well (22%). Ohio residents are also more likely than Americans on the whole to say they are unfamiliar with their family’s immigration story (40%). Arizonans and Floridians closely resemble the population overall. Among Arizona residents, nearly 7-in-10 report they know their family’s immigration story either very well (45%) or somewhat well (24%). Similarly, among Florida residents, about 7-in-10 report that they know their family’s immigration story either very well (50%) or somewhat well (21%). Slightly more than one-quarter of Arizonans and Floridians report that they are unfamiliar with their family’s immigration story (28% and 27%, respectively).
Perceptions of Cultural Threat
Despite having much lower levels of social contact with immigrants, Ohio residents stand out as perceiving higher levels of cultural threat to American society and holding more negative views of immigrants across several different measures.
Most Americans (54%) believe that American culture and way of life have mostly changed for the worse since the 1950s, while 4-in-10 (40%) believe it has changed for the better. Ohioans are significantly more likely than Americans overall to say things have gotten worse (67%), while about 3-in-10 (29%) say American culture and way of life have changed for the better. Arizonans and Floridians closely resemble Americans overall, with roughly half of each state’s residents (52% and 50%, respectively) believing things have changed for the worse since the 1950s and about 4-in-10 (39% and 44%, respectively) reporting things have changed for the better.
A slim majority (53%) of Americans agree that the American way of life needs to be protected against foreign influence, while close to half (45%) disagree. Ohio residents are significantly more likely than Americans overall to agree that the American way of life needs protecting (66%), compared to just 33% who disagree. Arizonans and Floridians have similar profiles on this question to Americans overall, with a majority of the residents from each state (56% and 51%, respectively) agreeing that the American way of life needs to be protected from foreign influence.
In the focus groups, participants expressed concerns over changes in their communities, often citing feelings of displacement and discomfort, or even stronger feelings that their communities were being “invaded.” An evangelical woman in Orlando, Florida, expressed her experience this way:
There’s these little communities. There’s like grocery stores that I don’t feel comfortable going into, because I know that’s not my grocery store, because I am white, I’m American, I’m not Hispanic. They’re going to look at me when I walk into that store like, ‘Why am I there?’
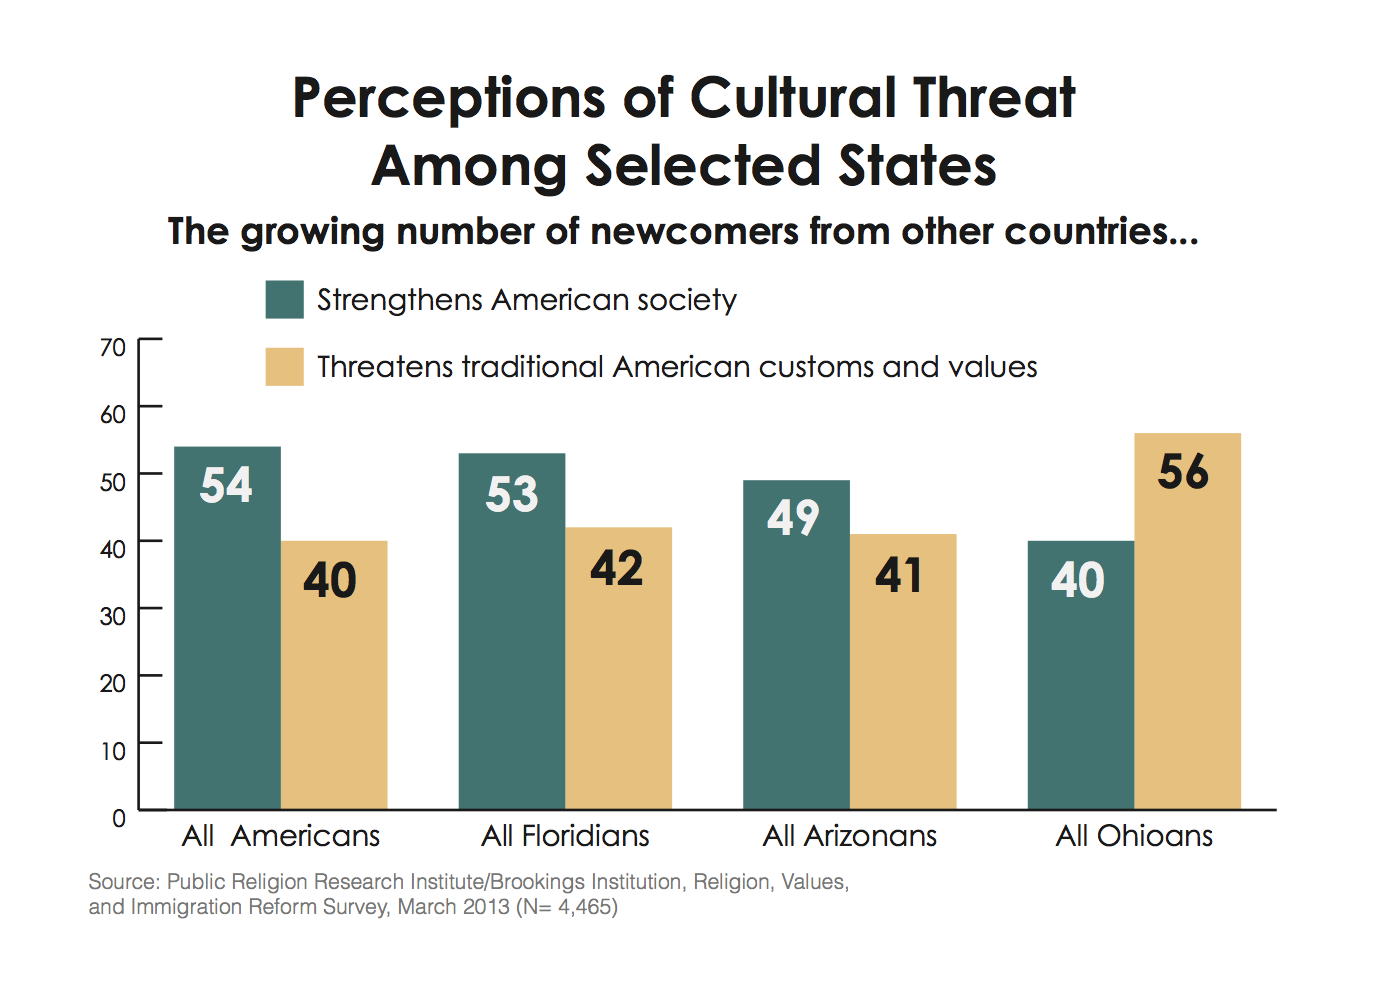
Perceptions of the impact of recent immigrants differ substantially among the three states. Most Americans (54%) report that the growing number of newcomers from other countries strengthens society, while 4-in-10 (40%) say the growth of the new immigrant population threatens traditional American customs and values. Ohioans again stand out from Americans overall in their concern about the cultural impact of recent immigrants. Four-in-ten (40%) of Ohioans say newcomers strengthen society, compared to a majority (56%) who believe the growing number of newcomers threatens traditional American customs and values. Arizonans and Floridians also look similar to Americans overall on this question. Roughly half of Arizonans (49%) and a majority of Floridians (53%) believe that newcomers strengthen American society, while about 4-in-10 in each state (41% and 42%, respectively) report that the growing number of newcomers threatens traditional American customs and way of life.
Along with these concerns, however, many participants in the focus groups expressed admiration for the work ethic of immigrants and gratitude for their contributions. An evangelical man in Orlando, Florida, cited his experience working with a Mexican roofing crew:
One of my first experiences working directly with immigrants was when I had a roof done on my house and it was a Mexican crew. The thing is, though, they were some of the best, hardest workers I’d ever met. Out in the broiling sun, they did an excellent job. Didn’t have to come back to redo anything, which has not been the case with other people I knew that have had their roofs done.
Americans are generally more likely to say that immigrants are changing American culture and way of life for the better (38%) than to say they are changing it for the worse (28%), though nearly one-quarter (26%) say immigrants are not having an impact one way or the other. Ohio residents are much more likely than Americans overall to say immigrants are changing American culture and way of life for the worse (42%), and less likely to say they are changing it for the better (26%); about one-quarter (24%) say immigrants are having no real impact. Arizona residents are twice as likely to say immigrants are changing American culture and way of life for the better (49%) as they are to say they are changing it for the worse (22%); about one-quarter (27%) say immigrants are having no real impact. Florida residents responded similarly to Americans overall, with 41% saying immigrants are changing American culture and way of life for the better, one-quarter (25%) saying they are changing it for the worse, and 27% reporting immigrants are not having any real impact.
Consistent Support for Path to Citizenship, DREAM Act Across States
Despite significant differences in the local social contexts and perceptions of cultural threat, there is broad agreement across the three states in support for immigration reform policy that includes a path to citizenship for immigrants currently living in the United States illegally. As previously noted, more than 6-in-10 (63%) Americans favor allowing immigrants a way to become citizens provided they meet certain requirements, while 14% prefer allowing them to become permanent legal residents but not citizens, and roughly 1-in-5 (18%) say immigrants living in the United States illegally should be identified and deported.11 On this question, there are few regional differences, and residents of Ohio, Florida, and Arizona look nearly identical to Americans overall. Roughly 6-in-10 Ohioans (60%), Floridians (61%), and Arizonans (64%) favor a path to citizenship for immigrants currently living in the United States illegally.12
There are also few differences in views about a policy commonly known as the DREAM Act, which would allow immigrants brought illegally to the United States as children a way to attain legal resident status by joining the military or going to college. More than 6-in-10 (61%) Americans favor this policy, while 34% are opposed. The profiles of Ohio (60% favor, 34% oppose), Arizona (64% favor, 36% oppose), and Florida (64% favor, 33% oppose) residents look nearly identical to all Americans on this question.
Endnotes
1 Unless otherwise specified, results from March 2013 are from the Religion, Values and Immigration Reform Survey, conducted by Public Religion Research Institute in partnership with Brookings Institution.
2 The recent increase in the number of Americans who think the immigration system is completely broken is notable, especially since public opinion has remained relatively stable since 2010, when 7% reported that the immigration system was generally working, more than one-third (34%) reported that it was working but with some major problems, roughly 4-in-10 (35%) Americans reported that it was broken but working in some areas, and just more than 1-in-5 (21%) said it was completely broken. See PRRI’s 2010 Religion, Values, and Immigration Reform Survey here.
3 According to the U.S. Immigration and Customs Enforcement (ICE), deportations increased by more than 10% between FY 2008, when nearly 370,000 immigrants were deported, and FY 2012, when about 410,000 immigrants were deported.
4 The results for Asian Americans are based on fewer than 100 cases (N=94) and should be interpreted with some caution.
5 The March 2013 numbers on the priority of immigration reform come from McClatchy/Marist Survey, March 2013.
6 Click here for the full details of the survey experiment.
7 This 8-point difference in Republican support is significant at the 90% confidence interval but not significant at the 95% confident interval.
8 Information on the immigration reform proposition comes from Border Security, Economic Opportunity and Immigration Modernization Act (S-744).
9 Results for Arizona are based on fewer than 100 cases (N=98) and should be interpreted with some caution.
10 The full results of the Ohio Values Survey can be found here. Ohio results in the local contexts and experiences section and perceptions of cultural threat section are based on the March 2013 national survey, while results in the path to citizenship and the DREAM Act sections are based on the September 2013 Ohio Values Survey
11 Results for Arizona and Florida residents are from the Religion, Values, and Immigration Survey, conducted by PRRI in partnership with the Brookings Institution in March, 2013.
12 Results for Ohio residents for a path to citizenship and the DREAM Act are from the Ohio Values Survey, conducted by PRRI in August 2013.
Recommended citation:
Jones, Robert P., Daniel Cox, and Juhem Navarro-Rivera. “What Americans (Still) Want from Immigration Reform: American Public Opinion March-November 2013.” PRRI. 2013. http://www.prri.org/research/2013-immigration-ii/.